• 검색 결과가 없습니다.

Research on the Characteristics of Chinese Tourists Flow to Thailand: Application of the Social Network Analysis (SNA) Method

N/A
N/A
Protected

Academic year: 2021

Share "Research on the Characteristics of Chinese Tourists Flow to Thailand: Application of the Social Network Analysis (SNA) Method"

Copied!
9
0
0

로드 중.... (전체 텍스트 보기)

전체 글

(1)

Print ISSN: 2288-4637 / Online ISSN 2288-4645 doi:10.13106/jafeb.2021.vol8.no11.0243

Research on the Characteristics of Chinese Tourists Flow to Thailand: Application of the Social Network

Analysis (SNA) Method*

Xiao-Chuan WANG

1

, Chun-Yan WANG

2

, Hyung-Ho KIM

3

Received: February 16, 2021 Revised: October 09, 2021 Accepted: October 16, 2021

Abstract

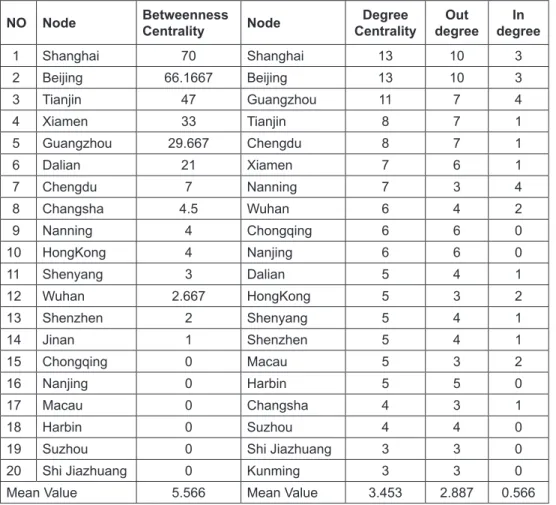
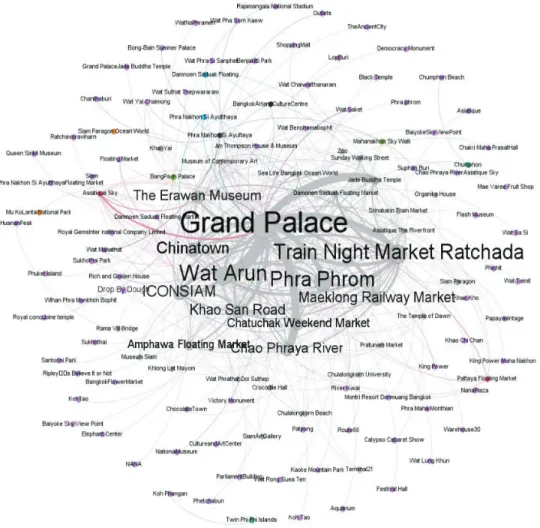
The goal of this study is to examine the characteristics of Chinese visitors visiting Thailand, determine the rules, and give a reference for Thai tourism authorities and businesses when developing marketing strategies for the Chinese market. This paper constructs the tourism flow network and takes Bangkok as the major research target. The statistical characteristics of the network are studied using the SNA method, based on the trip notes of Thailand on www.mafengwo.cn, a prominent travel website in China as the data source. The results show that: Shanghai, Beijing, and Tianjin occupy important positions in the network; The flow direction of Chinese tourists to Thailand mainly tends to Bangkok, Chiang Mai, Pattaya, and Phuket Island; Grand Palace have strong tourism flow aggregation, diffusion, and control over other nodes in the whole network structure; Tom Yu Kuang has the greatest degree centrality in all Thai cuisine. The findings of the study can help relevant management departments create tourist policies and modify market strategies by developing the regular characteristics of China’s tourism flow to Thailand in the theoretical field.

Keywords: Tourists Flow, Characteristics, Social Network Analysis, Bangkok, Travel Notes JEL Classification Code: M30, M31, Z32, Z33, Z39

over the world every year, which makes Thailand one of the most popular tourist destinations in the world. Tourism has become one of Thailand’s most important businesses for economic development, generating significant added value both directly and indirectly. For a long time, China and Thailand have had a healthy and stable relationship. With the rapid expansion of their tourism markets, the number of Chinese visitors visiting Thailand has increased by leaps and bounds, and the structure has changed.

According to the Thai tourism statistics, Chinese tourists to Thailand have grown at a rapid rate over the years. In 2019, Chinese tourists to Thailand totaled 10.995 million, making them the country’s largest source of visitors. Furthermore, China continues to lead in terms of its contribution to tourism spending. In 2019, Chinese travelers contributed 543.707 million baht to Thailand’s tourism revenue. Benefiting from a developed tourism market, Thailand’s tourism industry’s rapid growth not only encourages the country’s economic growth but also propels the growth of tourism-related and other service businesses.

The purpose of this research is to demonstrate that Thailand has grown in importance as a tourism destination,

*Acknowledgements:

This research was funded by the Joint Open Project of Key Laboratory of Beibu Gulf Environment Change and Resources Utilization of Ministry of Education (NNNU-KLOP-K1917). This study was also supported by the Sehan University Research fund in 2021.

1

First Author. Research Associate, General Administration Office, Nanning Normal University, Nanning, China.

Email: [email protected]

2

Professor, Faculty of Tourism Management, Jilin Engineering Normal University, Changchun, China. Email: [email protected]

3

Corresponding Author. Professor, Department of Air Transport and Logistics, Sehan University, South Korea [Postal Address:

33 Sehandae-gil, Sinpyeong-myeon, Dangjin-si, Chungcheongnam-do, 31746, Korea] Email: [email protected]

© Copyright: The Author(s)

This is an Open Access article distributed under the terms of the Creative Commons Attribution Non-Commercial License (https://creativecommons.org/licenses/by-nc/4.0/) which permits unrestricted non-commercial use, distribution, and reproduction in any medium, provided the original work is properly cited.

1. Introduction

Thailand is a country with various historical sites,

ethnically diverse cultural traditions, and abundant maritime

resources. It attracts a large number of tourists from all

(2)

attracting visitors from all over the world, particularly Chinese tourists. To put it another way, Chinese visitors have formed a significant and huge passenger flow in Thailand.

However, to give more satisfactory tourism products and services, we still need to understand its regular features and the demand preference for tourism destinations and products presented, to provide more satisfactory tourism products and services.

As a result, this article focuses on the study of Chinese tourists visiting Thailand, with Bangkok as the primary research object. Using the SNA (Social Network Analysis) method, this article analyzes the tourism motivation, tourism preference, consumption behavior characteristics, tourism destination cognition, and other aspects of Chinese tourists visiting Thailand, primarily in the context of tourist flow.

In terms of topic selection, while more and more connected topics are being examined at the moment, there are few relevant studies employing the SNA approach on the tourism flow of Chinese tourists to Thailand. As a result, there is some novelty in this research. This study not only adds to the regularity of Chinese tourism to Thailand, but it also has theoretical implications. It is useful for the formulation of tourism policies by relevant administrative departments in China and Thailand, as well as the market strategic planning and adjustment of tourism firms. The author expects that by doing this research, he would be able to contribute to the common development of tourism between China and Thailand, which will serve as a model for future inbound tourism development.

2. Literature Review

2.1. Research on Tourism Flow

Tourism flow has long been a major focus of study and development in the tourism industry. Foreign scholars began studying the impact of tourism flow and the spatial structure of tourism flow as early as the 1970s (Pearce, 1979; Gun, 1988). Some researchers conceptualized and modeled tourist routes, resulting in the identification of 26 different tourist route flow types (Alan et al., 2002). From the standpoint of theoretical research, some researchers used the social network analysis approach to evaluate the characteristics of tourism flow and debate the structure and evolution, as well as the role and function of nations/regions in the international tourism flow network (Wang et al., 2019; Shao et al., 2020).

Some researchers claim that tourism flow trends may be forecasted using mobile tour applications and images taken by travelers as data collecting routes (Lee et al., 2015; Kim

& Stepchenkova, 2015). Furthermore, from the standpoint of an innovation mechanism, examining the impact of

community engagement on the sustainability and spirituality of community destinations can be used as a model for the diversification of tourism products and the dynamics of tourism flow (Than et al., 2020).

2.2. Research on Tourism Flow Using SNA Method

As an essential research method in modern economic sociology, Social Network Analysis was established based on the social measurement approach presented by American social psychologist Moreno, which is used to investigate the relationship between actors. It is mostly used in the study of foreign tourism to describe the link between locations and organizations (Palvovich, 2003; Wu et al., 2016).

The agglomeration impact is bigger the higher the degree and size of economic development of tourist destinations, according to an analysis of destination network structure and network cohesiveness (Scott et al., 2008; Timur, 2008).

Through the Social Network Analysis of tourism flow, the status and role of tourist node cities in the whole network can be clarified, which is the entry point of this paper.

3. Study Design

3.1. Data Source and Processing

Online trip notes are “Unobtrusive and Available Data”

that include geographic, emotional, and assessment data.

Looking up other people’s trip notes and experiences is a valuable resource and foundation for self-service travel planning. The Ma Fengwo travel website (www.mafengwo.

cn) is China’s largest and most influential travel sharing community website, having classified a huge number of travel notes and providing local travel notes and schedules by destination. From January to December 2019, the self- service travel notes of Thailand shared by Chinese tourists were selected and released in this study.

The majority of social network research on tourism flow simply collects the cities or famous scenic spots that travelers pass through. The data is usually collected through questionnaires and interviews. This study uses data from over 400 Chinese visitors’ travel notes to Thailand from the Mafengwo travel website to retain not only the cities that the tourists traveled through, but also tourist sites, meals, and other information. This network’s tourism flow network represents tourist preferences as well as the spatial distribution characteristics of Thailand’s tourism flow.

3.2. Research Methods

A social network is a grouping of social players and their

interconnections. It examines the tourism flow network’s

(3)

geographical structure from a new perspective, analyses the agglomeration and diffusion relationships of each tourism node city in the network, and locates the status and role of tourism nodes in the network (Lee &Jung, 2020).

A hub is a node in a social network that has a much higher degree than other nodes. Hub was the core study topic, and it drew research interest from a variety of academic fields via social media (Lee, 2020; Lee & Jing 2015).

Based on the theory of Social Network Analysis, this paper analyzes the collected tourism data and constructs a directed network of Chinese tourists flow to Thailand.

The research selects the centrality as the node structure evaluation index of the self-service tourism flow network of Chinese tourists to Thailand. Centrality is one of the key points in Social Network Analysis, including degree centrality, closeness centrality, and betweenness centrality.

If tourists flow from a node to other points, it is called in degree centrality, otherwise, it is called out degree centrality.

This degree of nodes in the network’s core is measured by closeness centrality. The closer a node is to the center of the network, the more central it is. The degree of control and dependence of a node on other nodes on the macro level is reflected by its betweeness centrality. The stronger the control of neighboring nodes, the higher the betweeness centrality of a node. To examine the tourism flow network, degree centrality, proximity centrality, and betweeness centrality indices reflecting the key characteristics of social networks were used.

4. Results and Discussion

4.1. Construction of Tourism Origin Network The Excel travel node data was converted into. CSV file and Gephi 0.9.2 software was used to construct the tourism origin network structure of China’s traveler flows to Thailand in 2019.

Figure 1 shows a topology diagram in which the location of node cities is not the actual geographic location.

The 65 nodes in Figure 1 represent the tourism origin and destination of Chinese visitors traveling to Thailand, form the major network structure of Chinese tourism flow to Thailand, and serve as the departure and visit points for travelers. The bigger the sum of the in degree and out the degree of the node, i.e. the greater the number of visitors, the darker the colour of the node is. The thicker the link between nodes, the more connections there are between them, implying that the flow of tourists from tourism origin will be more frequent.

Shanghai, Beijing, Guangzhou, Tianjin, and Chengdu are the key source nodes with huge circular areas and close relationships, as illustrated in Figure 1. Furthermore, the greater the number of shortest pathways that these main nodes cross via a certain node, the greater the degree of mediation center of that node, i.e., the more times tourists transit here. Shanghai and Beijing are crucial intermediaries connecting China and Thailand, as they are nodes with high

Figure 1: Network Structure of Chinese Tourists Flow to Thailand in 2019

(4)

betweenness centrality and are reasonably easy to pass through during Chinese tourist to Thailand.

As can be seen from Table 1, the node cities with the highest out-degree centrality are Shanghai (10) and Beijing (10), followed by Guangzhou (7), Chengdu (7) and Tianjin (7), and then Xiamen (6), Chongqing (6) and Nanjing (6).

This indicates that these cities are the main sources of Chinese tourists visiting Thailand. Shanghai (13) and Beijing (13) have the highest degree of centrality, followed by Guangzhou (11), Chengdu (8), Tianjin (8), Xiamen (7), and Nanning (7) in fourth place. These cities, in other words, serve as important distribution hubs for Chinese tourists visiting Thailand. Shanghai (70), Beijing (66.167), and Tianjin are the nodal cities with the highest betweeness centrality (47).

The average value of 5.566 is surpassed by Xiamen (33), Guangzhou (29.667), Dalian (21), Chengdu (7), and other cities, showing that these cities have a commanding position over other nodes in the network and serve as the channel for tourist flows.

4.2. Construction of Tourism Destinations Network

The 29 nodes in Figure 2 indicate the most popular tourist attractions in Thailand for Chinese visitors. Bangkok, Chiang Mai, Phuket Island, and Pattaya, which make up the majority of the transport network between China and Thailand, are four important nodes with huge circular areas and tight connections. Bangkok, for example, has the greatest node area and hence dominates the entire network.

The higher the degree of mediation center of a node, that is, the more times tourists transfer at that node, the greater the number of shortest paths through that node.

Bangkok is a node with high betweenness centrality and is easy to pass through, therefore, it is an important intermediary point connecting various cities in tourism. In addition, Chiang Mai, Phuket, Pattaya, and Krabi are closely connected with each other, and the flow of tourists between them is also relatively frequent.

Table 1: Tourist origins Centrality Statistics

NO Node Betweenness

Centrality Node Degree

Centrality Out

degree In degree

1 Shanghai 70 Shanghai 13 10 3

2 Beijing 66.1667 Beijing 13 10 3

3 Tianjin 47 Guangzhou 11 7 4

4 Xiamen 33 Tianjin 8 7 1

5 Guangzhou 29.667 Chengdu 8 7 1

6 Dalian 21 Xiamen 7 6 1

7 Chengdu 7 Nanning 7 3 4

8 Changsha 4.5 Wuhan 6 4 2

9 Nanning 4 Chongqing 6 6 0

10 HongKong 4 Nanjing 6 6 0

11 Shenyang 3 Dalian 5 4 1

12 Wuhan 2.667 HongKong 5 3 2

13 Shenzhen 2 Shenyang 5 4 1

14 Jinan 1 Shenzhen 5 4 1

15 Chongqing 0 Macau 5 3 2

16 Nanjing 0 Harbin 5 5 0

17 Macau 0 Changsha 4 3 1

18 Harbin 0 Suzhou 4 4 0

19 Suzhou 0 Shi Jiazhuang 3 3 0

20 Shi Jiazhuang 0 Kunming 3 3 0

Mean Value 5.566 Mean Value 3.453 2.887 0.566

Note: This table only lists the top 20 tourist origins in terms of degree centrality.

(5)

4.3. Construction of Tourism Attractions Network of Bangkok

The key phrases of tourist attractions were evaluated using three indicators of degree centrality, closeness centrality, and betweeness centrality in this study.

Gephi0.9.2 software was used to generate the data in order to better depict the network features.

Figure 3 depicts the key tourist sites in Bangkok and its environs, with 127 nodes. The greater the degree centrality of the node, and the greater the sum of the in and out degrees of the network, the more visitors visit. The greater the number of links between nodes, the greater the flow of tourists. The larger the node’s font size, the higher the node’s proximity centrality, and the closer it is to the network center in space. Figure 4 shows that the Grand Palace is a popular tourist destination, followed by the Train Night Market Ratchada, Wat Arun, and Phra Phrom.

It can be seen from Table 2 that the average degree centrality of Chinese tourists in Bangkok’s tourism flow network nodes is 6.677, that is to say, each node is associated with 6.677 other nodes in terms of tourism flow agglomeration and radiation.

Grand Palace (31), Wat Arun (27), Train Night Market Ratchada (22), Phra Phrom (20), and ICONSIAM (20) are the tourism nodes with the highest degree of centrality (17). Grand Palace (59), Train Night Market Ratchada (28), and Chinatown are the top three tourism nodes with the highest out-degree centrality (27). Grand Palace and Train Night Market Ratchada, for example, have a high degree of centrality, indicating that they are at the heart of the entire tourism flow network and the distribution point for Chinese tourists in Bangkok. The values for Srinakarin Train Market (2) and Pratunam Market (1) are both lower than the mean, showing that these travel nodes have little impact on tourism flow aggregation. Closeness centrality shows how close a network node is to the center of the travel flow network.

As shown in Table 2, the top six tourist attractions in

terms of proximity centrality are Grand Palace (0.64),

Train Night Market Ratchada (0.54), ICONSIAM (0.539),

Chinatown (0.523), Wat Arun (0.504), and The Erawan

Museum (0.5), all of which are significantly higher than

the average 0.164, indicating that these six attractions are

in the heart of the network and have better accessibility

and independence from other tourist nodes. The degree

Figure 2: Network Structure of Chinese Tourists Destinations in Thailand in 2019

(6)

Figure 3: Network Structure of Chinese Tourists Flow to Bangkok in 2019 of control and reliance a tourism node has on other nodes

in the tourism flow network is measured by betweenness centrality. The higher the value, the more powerful the node’s control.

Grand Palace (2093.303), according to Table 2, has the highest betweeness centrality, which is significantly higher than the mean value (55.008). Wat Arun (559.01), Train Night Market Ratchada (546.673), Phra Phrom (541.853), ICONISIAM (478.899), and Chatuchak Weekend Market (424.16), which govern other nodes in the network and are important mediums to undertake and transit tourism flows, are among the higher-ranking nodes. Furthermore, the distance between Asiatique Sky (3.794) and Srinakarin Train Market (6.467) reveals that both nodes are on the periphery of the tourism flow network.

4.4. Centrality Statistics of Bangkok Food

In addition to its numerous historical sites, temples, and popular tourist attractions, Bangkok also attracts a

large number of tourists with its various delicacies. In this study, the information records regarding food in Bangkok kept by travelers in their travel notes were sorted out and converted into into.CSV a format file, CSV format file, and the network structure chart of Bangkok’s favorite food by Chinese tourists is constructed by Gephi0.9.2 software.

As can be seen from Figure 4, the 74 nodes represent the main delicacies enjoyed by Chinese tourists in Bangkok.

Tom Yum Kuang node has the largest circle, which represents the maximum degree centrality of nodes. In other words, it is the food with the largest number of visitors and the highest popularity. In addition, other popular delicacies among Chinese tourists include Kao Neaw Ma Muang, Puu Pud Pong Karee, Patai, Laeng Saeb, Load Chong Sing Ka Po, and Cha Yen.

5. Conclusion and Limitations

Based on the full sample data mining of Chinese tourists’

travel notes to Thailand online, this paper constructs the

(7)

Table 2: Tourist Attractions Centrality Statistics

NO Node Degree

Centrality In

Degree Out

Degree Betweeness

centrality Closeness centrality

1 Grand Palace 90 31 59 2093.303 0.64

2 Train Night Market Ratchada 50 22 28 546.673 0.54

3 Wat Arun 45 27 18 559.01 0.504

4 Phra Phrom 42 20 22 541.853 0.496

5 ICONSIAM 40 17 23 478.899 0.539

6 Chinatown 39 12 27 322.779 0.523

7 Khao San Road 34 18 16 329.912 0.477

8 The Erawan Museum 31 11 20 325.874 0.5

9 Chao Phraya River 31 18 13 213.332 0.462

10 Maeklong Railway Market 28 19 9 82.301 0.438

11 Chatuchak Weekend Market 27 12 15 424.16 0.498

12 Jade Buddha Temple 27 16 11 75.736 0.444

13 Damonen Saduak Floating Market 23 16 7 47.085 0.429

14 Asiatique The Riverfront 21 10 11 110.543 0.449

15 Sea Life Bangkok Ocean World 20 10 10 161.084 0.469

16 Amphawa Floating Market 20 11 9 110.829 0.454

17 Museum of Contemporary Art 19 6 13 60.778 0.494

18 Asiatique Sky 13 8 5 3.794 0.421

19 Srinakarin Train Market 9 2 7 6.467 0.44

20 Pratunam Market 8 1 7 0 0.424

Mean Value 6.677 3.339 3.339 55.008 0.164

tourists flow network and finally draws the following conclusions:

Shanghai, Beijing, Guangzhou, Chengdu, Tianjin, Xiamen, Chongqing, and Nanjing occupy a significant position in the network in terms of tourist origin, indicating that these cities are the main departure places for Chinese visitors visiting Thailand. Due to their developed tourism transportation environment and superior geographical location, Shanghai, Beijing, Tianjin, and Xiamen have become significant transit points for travelers from all across the country. Nanning, Changsha, Kunming, and other provincial capitals can further play a connecting role by increasing flights and tourist routes with their unique geographical advantages close to Southeast Asia.

From the aspect of tourism destination selection, the preferred cities for Chinese tourists to visit Thailand are Bangkok, Chiang Mai, Pattaya, and Phuket. Secondly, Krabi, Ko Samui, Kuala Lumpur, and other cities are preferred.

Among all the tourist destinations, Bangkok has become the most important tourist destination in Thailand because of its great attraction and international reputation, as well as

its position as an important political and economic center in Thailand.

The key nodes in the network, such as the Grand Palace, Train Night Market Ratchada, Wat Arun, Phra Phrom, and ICONSIAM, have a very high degree of centrality, closeness centrality, and betweenness centrality, which means that these key nodes not only have strong tourism flow aggregation capacity but also have strong diffusion and control ability to other nodes. It demonstrates that most Chinese tourists would visit well-known attractions while in Bangkok, but they also have a strong pioneering spirit when it comes to finding new locations to play.

When we look at the network structure of Chinese

tourists’ favorite foods in Bangkok, we can observe that Tom

Yu Kuang is at the heart of it all, with a strong cohesiveness

impact. The most representative and characteristic cuisine in

Thailand, Tom Yu Kuang, is the first dish most tourists try

after arriving. Other delights popular with Chinese guests

include Kao Neaw Ma Muang, Puu Pud Pong Karee, Patai,

Laeng Saeb, and Kao Ka Muu. The observation nodes for

these popular dishes are placed close the concentration area

(8)

extending around Siam, Bangkok’s largest business sector.

The design of such a tourism product structure can facilitate tourists to enjoy special food while shopping at the same time. Therefore, it can meet the needs of short-term visitors for tourism and dining.

In terms of data collection, although this paper has collected the full sample data of the Mafengwo travel website, it has ignored some small-scale tourism sharing websites and blog portals, so the travel tourists flow data can be further supplemented. In the future, with the integration of various research methods and cross-disciplinary research, as well as the application of big data and cloud computing platforms the theoretical system related to tourism flow will be gradually improved.

References

Alan L., & Bob M. (2002). Trip destinations, gateways, and itineraries: The example of Hong Kong. Tourism Management, 23(4), 609–621. https://doi.org/10.1016/S0261- 5177(02)00026-2

Gun, C. A. (1988). Vacation scape: Designing tourist regions.

Netherlands: Elsevier.

Han, H. C., Lee, Y. C., & Park, B. H. (2017). A study on the tourist network in Chinese inbound tourists by using social network analysis. Journal of Hotel & Resort, 16(2), 135–150, https://

doi.org/10.1177/0047287517722232

Kim, H., & Stepchenkova, S. (2015). Effect of tourist photographs on attitudes towards destination: manifest and latent content.

Tourism Management, 49, 29–41. https://doi.org/10.1016/

j.tourman. 2015.02.004

Lee, D. E., Kang, S. H., & Park, D. H. (2017). Analyzing multi- destination travel of Chinese free independent tourists using social network analysis techniques: The case of Seoul, Incheon, and Gyeonggi Province. International Journal of Tourism and Hospitality Research, 31(5), 37–48. http://doi.

org/10.21298/IJTHR.2017.05.31.5.37

Lee, H. T., & Jung, B. H. (2020). Digital Item Purchase Model in SNS channel applying dynamic SNA and PVAR. Journal of Distribution Science, 18(3), 25–36. http://doi.org/10.15722/

jds.18.3.20203.25

Lee, S. J., & Jing, D. (2015). Use intentions of mobile tour apps through expansion of the technology acceptance model.

Figure 4: Network Structure of Chinese Tourists’ Favorite Food in Bangkok

(9)

Journal of Distribution Science, 13(10), 135–142. http://doi.org/

10.15722/jds.13.10.201510.135

Pearce, D. (1979). Towards a geography of tourism. Annals of Tourism Research, 6(3), 245–272. https://doi.org/10.1016/0160- 7383(79)90101-4

Scott, N., Cooper, C., & Baggio, R. (2008). Destination networks- theory and practice in four Australian cases. Annals of Tourism Research, 35(1), 169–188. https://doi.org/10.1016/

j.annals.2007.07.004

Shao, Y. H., Huang, S. S., & Wang, Y. Y. (2020). Evolution of international tourist flows from 1995 to 2018: A network analysis perspective. Tourism Management Perspectives, 36, 75–88. https://doi.org/10.1016/j.tmp. 2020.100752

Than, T. T., Kieut, P. H., Phamt, A. D., Hoang, T. C. V., Tran, T.

H., Nguyen, H. D. & Dao, T. K. (2020). Impact of community attachment and resident’s support on destination sustainability:

Evidence from spiritual and community destination in Vietnam. Journal of Asian Finance, Economics, and Business, 7(8), 361–369. http://doi.org/10.13106/jafeb.2020.vol7.no8.361 Timur, S. (2008). A network perspective on managing stakeholders

for sustainable urban tourism. International Journal of Contemporary Hospitality Management, 20(4), 445–461.

https://doi.org/10.1108/09596110810873543

Wang, C. Y., Jang, P. S., & Kim, H. H. (2019). A study on the characteristics of the seasonal travel path of individual Chinese travelers in Korea. Journal of the Korea Convergence Society, 10(7), 1–9. https://doi.org/ 10.15207/JKCS.2019.10.7.023 Wu, Z. T., Liu, J. H., & Yuan, J. (2016). Network analysis and

evolutionary studies based on tourist flows of mainland

residents’ self-service traveling in Taiwan. Tourism Tribune,

31(10), 113–121. https://www.cnki.com.cn/Article/CJFDTOTAL-

LYXK201610025.htm

수치

Figure 1 shows a topology diagram in which the  location of node cities is not the actual geographic location
Table 1:  Tourist origins Centrality Statistics
Figure 3 depicts the key tourist sites in Bangkok  and its environs, with 127 nodes. The greater the degree  centrality of the node, and the greater the sum of the in  and out degrees of the network, the more visitors visit
Figure 3: Network Structure of Chinese Tourists Flow to Bangkok in 2019 of control and reliance a tourism node has on other nodes
+3

참조

관련 문서

The objective of this research is to propose a method for evaluating service reliability based on service processes using fuzzy failure mode effects analysis (FMEA) and grey

This study the changes in structure and mechanical characteristics by the analysis on mechanical characteristics of the welding part and the post weld

Comparison of the groups’ awareness to the herpes zosterin relation to characteristics of the study papulation. † Statistical analysis performed

Fifth, It is necessary to establish an information network related to Taekwondo tourism information. Until now, the reason why Taekwondo does not receive

Currently, the method of radioactive strontium( 90 Sr) analysis uses the nitric acid method and resin method.. The act of nitric acid method and

In addition, it is the purpose of this study to analyze social and historical background and the characteristics on the establishment of the varied

이를 위해 부산항을 기항하는 컨테이너 정기선 항로를 파악하고 사회연결망 분 석(Social Network Analysis : SNA) 방법 중 연결정도 중심성(Degree

This research aims to develop the Korean handwriting recognition method with the help of Backpropagation Neural Network Learning Method, apply the method to the evaluation