544
Copyright © 2020 The Korean Society of Fisheries and Aquatic Science pISSN:0374-8111, eISSN:2287-8815
서 론
우리나라의전복양식에관한연구는 1960년대북방전복종 묘생산연구를시작으로전복증식, 산란유발자극, 수정률, 유 생발생및치패생존율등에관한다양한연구를수행해오면 서전복종묘의대량생산체제기술을확립하게되었다(NFRDI, 2008). 전세계적으로전복은약 100여종이알려져있으며, 우 리나라에는둥근전복(Haliotis discus), 말전복(Haliotis giant- ea), 왕전복(Haliotis madaka), 오분자기(Haliotis diversicolor aquatilis) 그리고북방전복(Haliotis discus hannai)등이 서식 하고있다. 특히, 북방전복은우리나라전복의대표품종으로 전남지역을중심으로해상가두리양식에의해주로생산되고 있으며, 육상수조에서도전복을양성하는곳도있다(Jee et al.,
1988; Jeong et al., 1994). 그러나북방전복은부가가치가높은 반면에생태특성상한류성으로 3-4년의비교적양성기간이길 어출하상품까지양식에소요되는시간과비용을줄일필요가 있다. 이에전복양식에있어성장향상을위한여러가지육종연 구가진행되고있으며(Hara and Kikuchi, 1992; Vinna, 2002;
Park et al., 2012b), 그중에서선발육종을통한생산성향상 에관한많은연구도진행되고있다(Gjedrem, 1983, Argue et al., 2002; Gjerde et al., 2004; Lucas et al., 2006; Zheng et al., 2006; Park et al., 2013; Park et al., 2016). 일반적으로어패류 등의수산생물은후대에생산되는자손수가많고선발반응도 좋으며(Olesen et al., 2003), 성장형질에대한변동계수또한높 아서육상동물보다선발효과가크다고보고되어있으며, 특히 전복의각장, 각폭및중량과같은성장형질들은생산성과직
육종가 기반 북방전복(Haliotis discus hannai) 성장형질의 유전적 개량량 추정
박종원*·박철지·이다인·정효선·김혜진·김주란·김우진
국립수산과학원 육종연구센터
Estimation of Genetic Improvement Based on the Breeding Values of Growth Traits of the Abalone Haliotis discus hannai
Jong-Won Park*, Choul-Ji Park, Dain Lee, Hyo Sun Jung, Hyejin Kim, Julan Kim and Woo-Jin Kim
Genetics and Breeding Research Center, National Institute of Fisheries Science, Geoje 53334, Korea
This study was conducted to estimate the genetic improvements by selection criteria using the genetic parameters and breeding values for population of abalone Haliotisdiscushannai. Genetic parameters and breeding values were estimated using all measurement data of growth traits (shell length, shell width and total weight) at 18 and 30 months old after artificial fertilization for 3,029 individuals produced in April 2014. Growth traits all exhibited moderate heri- tability (0.253-0.354). So it is considered that family selection will be more advantageous than individual selection.
It was found that a higher genetic improvement could be expected when selecting the top 10% based on the breeding values of total weight rather than other traits. In particular, a higher genetic improvement could be expected when selecting the top 10% at 30 months old than 18 months old after artificial fertilization. This seems to be because the selection differential and heritability were higher at the 30 months old. Therefore, by estimating genetic parameters and breeding values of a population for production of the next generations by stage of growth, if they are used prop- erly in selection and mating according to the improvement direction, it is considered that more breeding effects can be expected.
Keywords: Genetic improvement, Heritability, Growth traits, Selection, Abalone
*Corresponding author: Tel: +82. 55. 639. 5815 Fax: +82. 55. 639. 5809 E-mail address: [email protected]
This is an Open Access article distributed under the terms of the Creative Commons Attribution Non-Commercial Licens (http://creativecommons.org/licenses/by-nc/3.0/) which permits unrestricted non-commercial use, distribution, and reproduction in any medium, provided the original work is properly cited.
Received 6 July 2020; Revised 10 August 2020; Accepted 13 August 2020
저자 직위: 박종원(연구사), 박철지(연구관), 이다인(연구사), 정효선(연구사), 김혜진(연구사), 김주란(연구사), 김우진(연구관)
https://doi.org/10.5657/KFAS.2020.0544
Korean J Fish Aquat Sci 53(4), 544-550, August 2020
접적으로관련이있는형질로서후대를생산하기위한선발에 이용하고있다(Refstie, 1990). 어패류의유전적개량량증가를 위한일반적이고가장효과적인방법이선발육종이며, 이를통 해개량대상형질의표현형및유전적능력평가결과를이용하 여육종효과를예측하고있다(Argue et al., 2002; Gjerde et al., 2004; Zhen et al., 2006; Choe et al., 2009). 선발에의해기대 되는후대의유전적개량량은선발의정확도, 선발강도및그집 단의상가적유전변이의크기에의해결정된다. 선발육종의주 목적은경제적으로유용한형질의유전적개량을극대화시키는 것이며, 이를위해서는체계적인선발과계획교배가필요하다. 또한성공적인육종을위해서는먼저유전적다양성이확보된 큰집단이만들어져야하며, 친자확인을통한혈통자료를이용 하여정확한유전능력평가로대상형질에대한유전모수및육 종가를추정하고선발과교배에이용하는기술도중요하다(Su et al., 1996). 선발육종에의한유전적개량은육종가의정확도 에따라좌우되며, 육종가를정확하게추정하기위해서는먼저 모집단의주요경제형질에대한유전력및유전상관등의유전 모수추정이선행되어야한다. 이에본연구는우리나라주요양 식품종인북방전복의모집단에대한유전모수와육종가를바 탕으로후대생산을위한모패의선발기준및선발시기에따른 기대되는유전적개량량을추정하여전복집단의유전적인성 장능력개선을위한기초자료를제공하고자수행되었다.
재료 및 방법 재료
본연구에서는 2014년에생산된북방전복을대상으로 수정 후 18개월및 30개월째성장형질인각장, 각폭및중량에대한 유전모수및개체별육종가추정을위해친자확인된 228가계
의총 3,029마리를이용하였다. 집단의유전적다양성을유지
하기위해 microsatelite DNA (deoxyribonucleic acid) 마커를 이용하여유전적유연관계를분석하고총 666개의교배지침을
수립하여암수 1:1 교배로생산되었다. 생산시기에따른오차를
줄이기위해모패의산란및수정을동시에실시하였고, 환경요 인을최소화하기위해최대한동일한사육수조환경에서사육
하였다. 수정후 18개월째에성장형질을측정하고개체식별을 위한전자칩을패각에부착하였으며, 30개월째에서도동일한 개체를대상으로성장형질을측정하였다. 성장형질측정은정
밀도가높은디지털기기를이용하여각장과각폭은 0.01 mm
단위, 중량은 0.01 g 단위로하여각개체별로측정하였다. 유전 모수및육종가추정에있어서자료의이상치제거를위해표준 편차의 ±3배의자료와암수구분이불분명한개체그리고유 전적친자확인이불가능한개체는분석에서제외하였다. 통계분석방법
조사된각형질에대한성별등분산성에대한 t-검정을실시 한결과분산이같지않다는결과를보여각장, 각폭및중량에 대한성의효과를추정하기위해 SAS Package의 GML (gen- eral linear model)으로분산분석을실시하였으며, 최소자승평 균치간의유의성검정을위해 H0:LSM (i)=LSM (j)와같은귀 무가설을유의수준 5%로 Pairwise T 검정을실시하였다. 여기 서, LSM (i)와 LSM (j)는각각 i와 j (i≠j)번째효과의최소자 승평균치이다. 성장형질에대한유전모수및각개체별육종가 를추정하기위해성을고정효과로처리하였으며, EM-REML (expectation maximization-restricted maximum likelihood)알 고리즘을전산프로그램화한 REMLF90 (Misztal, 1990)을이 용하여 최적선형불편예측법(best linear unbiased prediction, BLUP)에의해다음과같은다형질개체모형(Henderson and Quass, 1976)을이용하였다.
Yijk=ui+Sexij+aijk+eijk
여기서, Yijk는 i번째형질에서 j번째성에속하는 k번째개체 에대한측정치, ui는 i번째형질의전체평균, Sexij는 i번째형 질의 j번째성의효과(j=1, 2), aijk는개체에대한임의효과 N (0, G) 그리고 eijk는임의오차 N (0, R)이다. G와 R은각각상가적 유전분산과잔차분산이며, G는추정된값이지역최대값(local
maximum)으로수렴하는것을방지하기위하여최종적으로구
해진추정치를시작값으로하여그차이가 10-9이하로되는경 우를수렴값으로결정하였다. 구해진분산-공분산값을이용 하여상가적유전분산 σa2와잔차(환경)분산 σe2에의한유전력 Table 1. Overall means, standard deviations (STD) and coefficient of variation (CV) for growth traits at 18 and 30 months old
Item SL181 (mm) SW182 (mm) TW183 (g) SL304 (mm) SW305 (mm) TW306 (g)
Means±STD 61.01±3.76 41.06±2.60 26.10±5.14 84.04±6.40 55.36±4.05 67.96±15.6
Maximum 76.85 52.91 55.33 107.11 69.80 147.94
Minimum 49.43 32.03 14.72 59.23 39.72 21.85
Kurtosis 0.43 0.50 1.45 0.25 0.35 0.53
Skewness 0.53 0.54 1.00 -0.17 0.00 0.35
CV (%)7 6.17 6.32 19.76 7.41 6.93 20.95
1Shell length at 18 months old. 2Shell width at 18 months old. 3Total weight at 18 months old. 4Shell length at 30 months old. 5Shell width at 30 months old. 6Total weight at 30 months old. 7CV=(STD/mean)×100.
h2계산은다음과같이하였다(Groeneveld and Kovac, 1990).
h2=
^σa2
^σa2+^σe2
집단의확률분포에대한정규성검정(Normality test)을위해 SAS Package의 Univariate Procedure (SAS, Cary, NC, USA) 를이용하였으며, 조사된각형질간의표현형상관계수및유전 상관계수는아래와같은공식을이용하였다.
^ ^
rP= COVp(i,j )
, (i≠j ), rG= COVa(i,j ) , (i≠j )
σp(i )2×σp (j )2 σa(i )2×σa(j )2
여기서, σp2와 σa2는각각표현형분산과상가적유전분산이며,
COVp (i, j )와 COVa (i, j )는각각 i와 j간의표현형공분산및유전
공분산이다. 선발차는선발한집단의평균-모집단의평균, 유전 적개량량은유전력×선발차로계산하였다.
결과 및 고찰
본연구에서이용된북방전복모집단의수정후 18개월째성 장형질에대한표현형의전체평균은각장, 각폭및중량이각각 61.01 mm, 41.06 mm 및 26.10 g로조사되었으며, 각형질의최 대값과최소값은각장의경우 76.85 mm 및 49.43 mm, 각폭은 52.91 mm 및 32.03 mm 그리고중량은 55.33 g 및 14.72 g이었 다. 수정후 30개월째성장형질에대한전체평균은각장, 각폭 및중량이각각 84.04 mm, 55.36 mm 및 67.96 g로나타났고, 최대값과최소값은각장의경우 107.11 mm 및 59.23 mm, 각 폭은 69.80 mm 및 39.72 mm 그리고중량은 147.94 g 및 21.85 g이었다. 수정후 18개월째각장, 각폭및중량의표현형변동 계수(coefficient of variation)는각각 6.17%, 6.32% 및 19.76%
그리고 30개월째의경우각각 7.41%, 6.93% 및 20.95%로조
사되었으며, 중량이다른두형질에비해서자료의변이가가 장크게나타났다(Table 1). 이와같은결과는적정수온, 양질 의먹이및수질등최적의사육환경이나조건에서의성장과는 다소차이가있으며, 본연구에이용된북방전복은양식현장과 최대한유사한환경에서사육하여집단의유전적다양성을유 지하기위한계획교배에의한결과로사료된다. 변동계수는자 료또는확률분포의산포를측정하는표준화된측도이며, 표준 편차를평균으로나눈값으로상대표준편차(relative standard deviation, RSD)라고하기도한다. 변동계수는측정단위가다 른자료들의상대적변동성을비교하는데용이하며, 그값이작
을수록평균에가깝게분포하고있다는것을의미한다(Park et
al., 2013).
본연구에서조사된북방전복모집단의수정후 18개월및 30 개월째성장형질에영향을미치는성(sex)의효과를추정하기 위해성을고정효과로처리하고분산분석을실시한결과수정 후 18개월및 30개월째각장, 각폭및중량의모든형질에있어 서고도의유의성(P<0.001)이인정되었다(Table 2).
Table 3에는조사된각형질의성의효과에대한최소제곱평
균과그표준오차를나타내었다. 수정후 18개월째에있어서각 장의경우암컷이 61.27 mm로수컷의 60.76 mm에비해 0.51 mm 길었으며, 각폭은암컷이 41.28 mm로수컷의 40.88 mm 에비해 0.40 mm 길게나타났다. 중량의경우암컷이 26.40 g 로수컷의 25.62 g보다 0.78 g이더무거웠다. 수정후 30개월
째성장에있어서각장의경우암컷이 84.56 mm 그리고수컷
이 83.34 mm으로암컷이 1.22 mm 더길었으며, 각폭은암컷이 55.76 mm 그리고수컷이 54.90 mm로암컷이 0.86 mm 더길 었다. 중량의경우암컷이 70.08 g로수컷의 65.27 g보다 4.81 g 더무겁게나타났다.
이와같이본연구에서조사된북방전복의수정후 18개월및 30개월째에서모든성장형질은 수컷보다암컷이유의적으로 크게나타났다(Table 3). Park et al. (2016)은수정후 30개월째
Table 2. Source of the variation, degree of freedom, mean squares and test of significance for growth traits at 18 and 30 months old
Source df1 SL182 SW183 TW184 SL305 SW306 TW307
Sex 1 189.7* 142.9* 454.5* 1114.7* 554.2* 17300.6*
Error 3027 14.1 6.71 26.2 40.6 16.2 239.9
1Degree of freedom. 2Shell length at 18 months old. 3Shell width at 18 months old. 4Total weight at 18 months old. 5Shell length at 30 months old. 6Shell width at 30 months old. 7Total weight at 30 months old. *High significance (P<0.001).
Table 3. Least-square means and standard errors of growth traits at 18 and 30 months old
Sex SL181 (mm) SW182 (mm) TW183 (g) SL304 (mm) SW305 (mm) TW306 (g) Female 61.27a±0.09 41.28a±0.06 26.40a±0.12 84.56a±0.15 55.76a±0.09 70.08a±0.38 male 60.76b±0.10 40.85b±0.07 25.62b±0.14 83.34b±0.17 54.90b±0.11 65.27b±0.42
a, bMeans in the same column with different letter are statistically significant at 5% level of significance. 1Shell length at 18 months old.
2Shell width at 18 months old. 3Total weight at 18 months old. 4Shell length at 30 months old. 5Shell width at 30 months old. 6Total weight at 30 months old.
북방전복의성별에따른성장형질및유전모수추정에있어서 각장, 각폭및중량의모든형질에있어서암컷이수컷보다유의 적으로높게나타났고보고하여본연구와일치하였으며이는 생물학적성에따른성장차이가있음을알수있다.
성장형질과같이경제형질에대한유전모수, 유전력및육종 가의추정치는시대, 대상, 집단, 사육관리및추정방법등에의 해매우다양하게나타나며, 특히유전력은대상형질의선발반 응을예측하고선발방법을결정할뿐만아니라향후육종계획 을수립하는데매우중요한기초자료로활용된다. 표현형은유 전과환경의상호작용에의해나타나는데유전의영향을많이 받는형질이있는반면에환경의영향을많이받는형질이있으 며, 형질들의변이를일으키는데있어서유전과환경의상대적 인비중을유전력으로나타낼수있다. 일반적으로유전력의범 위는 0-1이며, 0.2 이하를저도의유전력, 0.2-0.4의범위는중
도의유전력그리고 0.4 이상의범위를고도의유전력이라고한
다. 보통유전력이낮을경우가계선발이유리하고유전력이높 을경우개체선발을하는것이유리하다. 유전력이낮은형질에 있어서는개체간의차이가주로환경요인에의하여나타나므
로개체의표현형에만근거하여유전자형을정확하게추정하 기어렵기때문이다.
Choe et al. (2009)은 9개월령북방전복에있어서각장, 각폭 및중량의유전력이각각 0.29, 0.29 및 0.31로중도의유전력을 보고하였고, Lucas et al. (2006)은 microsatellite에의한친자 확인법을이용하여개체모형으로유전모수를추정한결과각 장, 각폭및중량의유전력을각각 0.48, 0.38 및 0.36으로보고 한바있다. 본연구에서조사된북방전복의수정후 18개월및 30개월째성장형질에대한유전분산및환경분산에따른유전
력을추정한결과 0.253-0.354의중도의유전력을나타내어개
체선발보다는가계선발을하는것이선발효과가더좋을것으 로사료된다(Table 4).
수정후 18개월및 30개월째에서각성장형질간의유전상관 및표현형상관계수를 Table 5와 Table 6에각각나타내었다. 18 개월째각성장형질간의표현형상관계수는 0.905-0.923으로 나타났고, 유전상관계수의경우 0.953-0.957의범위로매우강 한정의상관관계를보였다. 30개월째의경우표현형상관계수 는 0.916-0.929로나타났고, 유전상관계수는 0.906-0.913의범
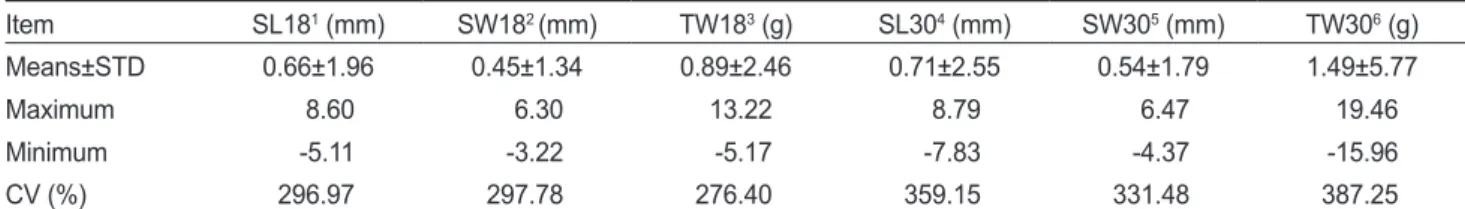
Table 8. Breeding value, standard deviations (STD) and coefficient of variation (CV) for growth traits at 18 and 30 months old Item SL181 (mm) SW182 (mm) TW183 (g) SL304 (mm) SW305 (mm) TW306 (g)
Means±STD 0.66±1.96 0.45±1.34 0.89±2.46 0.71±2.55 0.54±1.79 1.49±5.77
Maximum 8.60 6.30 13.22 8.79 6.47 19.46
Minimum -5.11 -3.22 -5.17 -7.83 -4.37 -15.96
CV (%) 296.97 297.78 276.40 359.15 331.48 387.25
1Shell length at 18 months old. 2Shell width at 18 months old. 3Total weight at 18 months old. 4Shell length at 30 months old. 5Shell width at 30 months old. 6Total weight at 30 months old.
Table 7. Phenotypic correlation among growth traits at 18 and 30 months old
Traits SL304 SW305 TW306
SL181 0.663 0.677 0.660
SW182 0.614 0.723 0.652
TW183 0.609 0.661 0.682
1Shell length at 18 months old. 2Shell width at 18 months old. 3To- tal weight at 18 months old. 4Shell length at 30 months old. 5Shell width at 30 months old. 6Total weight at 30 months old.
Table 6. Genetic and phenotypic correlations1 among growth traits at 30 months old1
Traits SL302 SW303 TW304
SL30 0.916 0.929
SW30 0.906 0.918
TW30 0.923 0.917
1Genetic correlations are below diagonal and phenotypic correla- tions are above diagonal. 2Shell length at 30 months old. 3Shell width at 30 months old. 4Total weight at 30 months old.
Table 5. Genetic and phenotypic correlations among growth traits at 18 months old1
Traits SL182 SW183 TW184
SL18 0.915 0.923
SW18 0.957 0.905
TW18 0.958 0.953
1Genetic correlations are below diagonal and phenotypic correla- tions are above diagonal. 2Shell length at 18 months old. 3Shell width at 18 months old. 4Total weight at 18 months old.
Table 4. Heritability (h2), additive genetic variance (σa2) and envi- ronmental variance (σe2) of growth traits at 18 and 30 months old Item SL181 SW182 TW183 SL304 SW305 TW306 σa2 8.393 3.852 13.47 12.29 5.706 82.33 σe2 24.81 10.93 34.35 28.28 10.44 171.5 h2 0.253 0.261 0.282 0.303 0.354 0.324
1Shell length at 18 months old. 2Shell width at 18 months old. 3To- tal weight at 18 months old. 4Shell length at 30 months old. 5Shell width at 30 months old. 6Total weight at 30 months old.
위로나타났다. 이처럼성장형질간의상관계수는모두강한정 의상관관계에있으므로한형질의개량만으로다른두형질의 개량효과를동시에기대할수있을것으로사료된다.
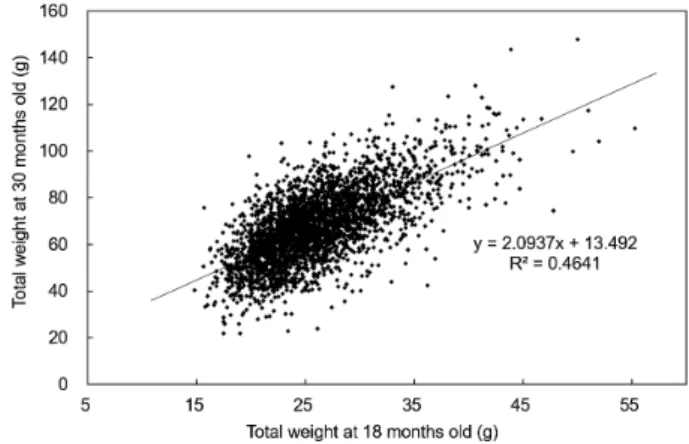
Table 7에는수정후 18개월째성장과 30개월째의성장간의 표현형상관계수를나타내었다. 그결과를살펴보면 18개월째 각장과 30개월째각장의상관계수가 0.663, 18개월째각폭과 30개월째각폭의상관계수가 0.723 그리고 18개월째중량과 30개월째중량의상관계수가 0.682로비교적약한정의상관 관계를보였는데이는 Fig. 1과 Fig. 2에나타낸바와같이 18개 월째에서동일한크기의개체들이 1년후인 30개월째에서서로 다른성장차이를보여성장과정에서개체또는가계간의성장 역전현상이일부나타났음을알수있었다.
본연구에서추정된유전모수를이용하여수정후 18개월및 30개월째의성장형질에대한각개체별육종가를추정한결과 18개월째의각장, 각폭및중량에대한육종가평균은각각 0.66 mm, 0.45 mm 및 0.89 g로나타났고, 최대값과최소값은각장 의경우 8.60 mm 및 -5.11 mm, 각폭이 6.30 mm 및 -3.22 mm 그리고중량의경우 13.22 g 및 -5.17 g이었다. 30개월째의각 장, 각폭및중량에대한육종가평균은각각 0.71 mm, 0.54 mm 및 1.49 g로나타났고, 최대값과최소값은 각장의경우 8.79 mm 및 -7.83 mm, 각폭은 6.47 mm 및 -4.37 mm 그리고중량 의경우 19.46 g 및 -15.96 g로나타났다(Table 8). Yang (2007) 은수정후 21개월째북방전복의성장형질대한육종가를추정 하였는데각장은 -18.2~18.3 mm, 각폭은 -11.9~12.3 mm 그리 고중량은 -31.9~35.8 g로나타나본연구결과와같이개체간 의다양한유전적변이를보였다고보고하였다.
Table 9에는수정후 18개월및 30개월째에서각장육종가및 중량육종가를기준으로각각상위 10%를선발할때기대되는 유전적개량량을나타내었다. 수정후 18개월째에서각장육종 가를기준으로선발된집단의평균각장, 각폭및중량은각각 63.60 mm, 42.79 mm 및 29.38 g이었으며, 예측되는후대집
단의평균각장, 각폭및중량은각각 64.26 mm, 43.24 mm 및 30.30 g로각각 1.02%, 1.03% 및 3.13%의선발효과를기대할 수있는것으로나타났다. 또한수정후 18개월째에서중량육 종가를기준으로선발된집단의평균각장, 각폭및중량은각 각 63.93 mm, 43.15 mm 및 30.70 g이었으며, 예측되는후대 집단의평균각장, 각폭및중량은각각 64.67 mm, 43.70 mm 및 32.00 g로각각 1.16%, 1.27% 및 4.23%의선발효과가있는 것으로나타났다.
Fig. 1. Correlation for growth of shell length at 18 and 30 months
old by regression analysis. Fig. 2. Correlation for growth of total weight at 18 and 30 months old by regression analysis.
Table 9. Genetic improvement when selecting the top 10% for breeding value of shell length and total weight at 18 and 30 months old
Criteria1 Traits2 Means Sel.D.3 IPT4 PV5 Effect
SL_BV
SL18 (mm) 63.60 2.59 0.66 64.26 1.02%
SW18 (mm) 42.79 1.73 0.45 43.24 1.03%
TW18 (g) 29.38 3.28 0.92 30.30 3.13%
SL30 (mm) 92.28 8.24 2.50 94.78 2.71%
SW30 (mm) 60.55 5.19 1.84 62.39 3.04%
TW30 (g) 86.15 18.19 5.89 92.04 6.84%
TW_BV
SL18 (mm) 63.93 2.92 0.74 64.67 1.16%
SW18 (mm) 43.15 2.09 0.55 43.70 1.27%
TW18 (g) 30.70 4.60 1.30 32.00 4.23%
SL30 (mm) 92.79 8.75 2.65 95.44 2.86%
SW30 (mm) 61.38 6.02 2.13 63.51 3.47%
TW30 (g) 91.47 23.51 7.62 99.09 8.33%
1SL_BV, when selecting the top 10% for breeding value of shell length; TW_BV, when selecting the top 10% for breeding value of total weight. 2SL18,shell length at 18 months old; SW18, shell width at 18 months old; TW18, total weight at 18 months old; SL30, shell length at 30 months old; SW30, shell width at 30 months old; TW30, total weight at 30 months old. 3Selection dif- ferential. 4Genetic improvement. 5Predictive value (mean).
그리고수정후 30개월째에서각장육종가를기준으로선발된 집단의평균각장, 각폭및중량은각각 92.28 mm, 60.55 mm 및 86.15 g이었으며, 예측되는후대집단의평균각장, 각폭및 중량은각각 94.78 mm, 62.39 mm 및 92.04 g로각각 2.71%,
3.04% 및 6.84%의선발효과를기대할수있는것으로나타났
다. 또한수정후 30개월째중량육종가를기준으로선발할경 우선발된집단의평균각장, 각폭및중량은각각 92.79 mm, 61.38 mm 및 91.47 g이었으며, 예측되는후대집단의평균각 장, 각폭및중량은각각 95.44 mm, 63.51 mm 및 99.09 g로각 각 2.86%, 3.47% 및 8.33%의선발효과가있는것으로나타났 다. 이처럼수정후 18개월및 30개월째모두중량육종가를기 준으로상위 10%를선발할때가각장육종가기준으로선발할 때보다각장, 각폭및중량의세형질모두다소높은유전적개 량량을기대할수있는것으로나타났다.
특히, 수정후 18개월째보다 30개월째에서상위 10%를선발 할때더높은유전적개량량을기대할수있는것으로나타났 는데, 이는 18개월째보다 30개월째에서의선발차와유전력이 더높았기때문인것으로판단되며, 후대생산을위한모패선 발시수정후 18개월째보다는 30개월째에서의중량육종가를 기준으로모패를선발하는것이더유리할것으로사료된다. 본 연구와유사한연구를살펴보면 Cheo et al. (2008)은 12개월 령북방전복을대상으로성장형질육종가를추정하여선발강 도에따른선발효과를추정하였는데선발강도 5-30%의범위 에서각장이 9.2-14.9% 그리고중량은 22.2-32.3%로예측되 었으며, 중량의개량효과가각장에비해상대적으로높게나타 났다고보고하였다. 또한 Park et al. (2012b)에의하면선발 2 세대의 31개월째북방전복을대상으로선발반응을추정한결 과약 5%의선발강도에서각장, 각폭및중량이각각 6.96 mm (9.6%), 4.47 mm (9.5%) 및 12.93 (26.1%)의유전적개량량을 보고하였으며, Cheo et al. (2009)은 9개월령북방전복을대상 으로선발효과를예측한결과선발강도 5%에서각장및중량 이각각 12.72% 및 34.26%, 선발강도 40%에서는각각 8.62%
및 24.87%의효과가있는것으로보고하였다. 그리고 Hara and Kikuchi (1992)는북방전복을대상으로각장의경우 63%의개 량을나타내었다고보고하였으며, Lucas et al. (2006)은열대 전복(Tropical abalone Haliotis asinina)을대상으로선발강도
5%에서세대당 25%의유전적개량의효과를보고한바있다.
이와같이선발강도가높을수록예측되는유전적개량량도높 아지는데너무높은선발강도를유지할경우세대를거듭할수 록유전자빈도가변하고더불어표현형변이가줄어들수있다 (Flaconer and Mackay, 1996). 이러한현상을방지하기위해서 는집단의유전적다양성을유지하면서근친화를최소화하는 것이필요하다(Park et al., 2012a).
본연구결과를미루어볼때유전적개량량을크게하는방법 은우선개량하고자하는형질에대한유전력을높여야하며, 모 집단과선발된집단간의선발차를크게하는것이다. 모집단으
로부터모패의선발비율을줄여선발강도를높일수록유전적 개량량은커지며, 개량속도도빨라지게되지만선발되는모패 의비율은후대생산을위해서적절한비율의개체수가확보되 어야하기때문에모집단에속해있는개체들의변이가큰것이 중요하다. 전복은오랜기간양성을필요로하는특성상성장률 향상을위한지속적인선발육종연구가무엇보다필요하며, 각 성장형질에대한유전능력을평가하고추정된유전모수와육종 가를바탕으로개량방향에맞추어선발과교배에적절히이용 한다면더욱높은육종효과를기대할수있을것으로사료된다.
사 사
본연구는국립수산과학원수산과학연구사업(R2020001)의 지원에의해수행되었습니다.
References
Argue BJ, Arce SM, Lotz JM and Moss SM. 2002. Selec- tive breeding of pacific white shrimp (Litopenaeus van- namei) for growth and resistance to taura syndrome virus.
Aquaculture 204, 447-460. https://doi.org/10.1016/S0044- 8486(01)00830-4.
Choe MK, Han SJ, Yang SG, Won SH, Park CJ and Yeo IK.
2008. Estimation of genetic parameter for growth-related traits in 1-year old of two Korean abalone subspecies, Hi- aliotis discus hanni and H. discus discus, by using multiple traits of animal model. Korean J Malacol 24, 121-130.
Choe MK, Yang SG, Won SH, Park CJ, Han SJ and Yeo IK.
2009. Estimation of genetic parameters for growth-related traits in 9-month old of two Korean abalone subspecies Hal- iotis discus hanni and H. discus discus, by using multiple traits of animal model. Korean J Fish Aquat Sci 42, 591-599.
https://doi.org/10.5657/kfas.2009.42.6.591.
Flaconer DS and Mackey TFC. 1996. Introduction to quantita- tive genetics. Prentice hall, New York, NY, U.S.A.
Groeneveld E and Kovac M. 1990. A note on multiple solutions in multivariate restricted maximum likelihood covariance component estimation. J Dairy Sci 73, 2221-2229. https://
doi.org/10.3168/jds.S0022-0302(90)78902-3.
Gjerde B, Terjesen BF, Barr Y, Lein I and Thorland I. 2004. Ge- netic variation for juvenile growth and survival in Atlantic cod Gadus morhua. Aquaculture 236, 167-177. https://doi.
org/10.1016/j.aquaculture.2004.03.004.
Gjedrem T. 1983. Genetic variation in quantitative traits and se- lective breeding in fish and shellfish. Aquaculture 33, 51-72.
https://doi.org/10.1016/0044-8486(83)90386-1.
Hara M and Kikuchi S. 1992. Increasing growth rate of abalone Haliotis discus hannai, using selection techniques. NOAA Technical report 106, 21-26.
Henderson CR and Quass RL. 1976. Multiple trait evaluation using relative’s record. J Aim Sci 43, 1188-1197. https://doi.
org/10.2527/jas1976.4361188x.
Jee YJ, Yoo SK, Rho S and Kim SH. 1988. The stocking den- sity and growth of young abalone Haliotis discus hannai Ino clutured in the hanging net cage. Bull Nat Fish Res Dev Agency 42, 59-69.
Jeong SC, Jee YJ and Son PW. 1994. Indoor tank culture of the abalone Haliotis discus hannai Ⅱ. Effects of diets on growth of young abalone. J Aquacult 7, 77-87.
Lucas T, Macbeth M, Degnan SM, Knibb W and Degnan BM.
2006. Heritability estimates for growth in the tropical aba- lone Haliotis asinina using microsatellites to assign parent- age. Aquaculture 259, 146-152. https://doi.org/10.1016/j.
aquaculture.2006.05.039.
Misztal I. 1990. Restricted maximum likelihood estimation of variance components in animal model using sparse matrix inversion and a supercomputer. J Dairy Sci 73, 163-172.
https://doi.org/10.3186/jds.S0022-0302(90)78660-2.
NFRDI (National Fisheries Research and Development Insti- tute). 2008. Standard manual of abalone culture. NFRDI, Busan, Korea.
Olesen I, Gjedrem T, Bentsen HB, Gjerde B and Rye M.
2003. Breeding programs for sustainable aquaculture. J Appl Aquaculture 13, 179-204. https://doi.org/10.1300/
J028v13n03_01.
Park CJ, Lee JH, Noh JK, Kim HC, Park JW, Hwang IJ and Kim SY. 2012a. Growth of Pacific abalone Haliotis discus han- nai using selection breeding techniques. Korean J Malacol 28, 343-347. https://doi.org/10.9710/kjm.2012.28.4.343.
Park JW, Park CJ, Lee JH, Noh JK, Kim HC, Hwang IJ and Kim SY. 2012b. The estimation of selection response for growth traits in 31-monts old of pacific abalone Haliotis discus han- nai. Korean J Malacol 28, 335-342. https://doi.org/10.9710/
kjm.2012.28.4.335.
Park JW, Park CJ, Lee JH, Noh JK, Kim HC, Hwang IJ and Kim SY. 2013. Estimation of Family Variation and Genetic Pa- rameter for Growth Traits of Pacific Abalone Haliotis discus hannai on the 3th Generation of Selection. Korean J Mala- col 29, 325-334. https://doi.org/10.9710/kjm.2013.29.4.325.
Park CJ, Park JW, Kim BR, Jeong KH, Kim YJ, Son YS and Kim KK. 2016. Estimation of genetic parameter and growth traits by sex of pacific abalone Haliotis discus hannai.
Korean J Malacol 32, 249-254. https://doi.org/10.9710/
kjm.2016.32.4.249.
Refstie T. 1990. Application of breeding schemes. Aquaculture 85, 163-169. https://doi.org/10.1016/0044-8486(90)90015- Su GS, Liljedahl LE and Gall GAE. 1996. Genetic and envi-F.
ronmental variation of body weight in rainbow trout On- corhynchus mykiss. Aquaculture 144, 71-80. https://doi.
org/10.1016/S0044-8486(96)01306-3.
Vinna MT. 2002. Abalone aquaculture, an overview. World Aquacult 33, 34-39.
Yang SG, 2007. Genetic diversity and evaluation for selective breeding in pacific abalone Haliotis discus hannai. Ph. D.
thesis, University of Dong-eui, Busan, Korea.
Zheng H, Zhang G, Liu X and Guo X. 2006. Sustained response to selection in an introduced population of the hermaphro- ditic bay scallop Argopecten irradians irradians Lamarck (1819). Aquaculture 255, 579-585. https://10.1016/j.aqua- culture.2005.11.037.