1)
†To whom correspondence should be addressed.
Department of Civil and Environmental Engineering, Kongju National University
E-mail: [email protected]
Water Quality Analysis and Evaluation of Management Strategies and Policies in Laguna Lake, Philippines
Nash Jett D.G. Reyes・Franz Kevin F. Geronimo・Marla M. Redillas*・Jungsun Hong・Lee-Hyung Kim†
Department of Civil and Environmental Engineering, Kongju National University
*Civil Engineering Department, De La Salle University-Manila, Malate Manila, Philippines
필리핀 라구나호수의 수질분석 및 관리 정책 평가
Nash Jett D.G. Reyes・Franz Kevin F. Geronimo・Marla M. Redillas*・홍정선・김이형† 공주대학교 건설환경공학부
*Civil Engineering Department, De La Salle University-Manila, Malate Manila, Philippines (Received : 29 November 2017, Revised: 06 February 2018, Accepted: 06 February 2018)
Abstract
Laguna Lake is the largest inland fresh water body in the Philippines. It primarily serves as a site for aquaculture, hydropower, transportation, and water supply industries. Due to Laguna Lake’s diverse functionalities, competition among water users became prominent. Water quality began to deteriorate due to various pollutant contributions in this process, thereby affecting the soundness of the aquatic ecosystem. This study was conducted to evaluate the current water quality management policy from the viewpoint of ecological environment through the evaluation of the water quality of Laguna Lake. Concentrations of water pollutants such as ammonia (NH3), biochemical oxygen demand (BOD), chloride (Cl-), pH, and total suspended solids (TSS) exceeded the water quality standards of the Philippines’ Department of Environment and Natural Resources (DENR). The water quality of the lake was also affected by the pollutant load due to agriculture and urban stormwater runoff in the watershed. The salinity and contaminated water from Pasig River also affected the water quality of Laguna Lake. Long-term water quality analysis showed that the water quality of Laguna Lake is also influenced by rainfall-related seasonal variations. The results of the water quality analysis of Laguna Lake indicated that the environmental management techniques of the Philippines should be changed from the conventional water management into an integrated watershed management scheme in the future. It is therefore necessary to study and introduce advanced watershed management measures in the Philippines based from the policies of other developed countries.
Key words : Laguna Lake, Philippines, Water quality policy, Water quality management
요 약
라구나 호(Laguna Lake)는 필리핀(Philippines)에서 가장 큰 담수호이며 주로 양식, 수력발전, 운송 및 상수도 산업을 위한 목적으로 활용된다. 라구나 호의 다양한 이용목적은 물 이용자 간의 경쟁과 반목을 초래하고 있으며, 이 과정에 다양한 오염원으로 인하여 수질은 악화되고 있으며, 수생태계의 건전성도 영향을 받고 있다. 따라서 본 연구는 라구나 호(Laguna Lake)의 수질평가를 통해 현 수질관리 정책을 생태학적 환경관점에서 평가하고자 수행되었다. 라구나 호(Laguna Lake)의 NH3, BOD, Cl-, pH 및 TSS 등의 수질오염물질 농도는 필리핀 Department of Environment and Natural Resources (DENR)에서 제시하는 수질기준을 모두 초과하는 것으로 나타났다. 또한 호의 수질은 유역에서 발생하는 농업 및 도시 강우유출수로 인한 오염물질 부하량의 영향을 받고 있는 것으로 조사되었으며, 파시그 강(Pasig River)의 염분과 오염된 수질도 라구나 호(Laguna Lake)의 수질에 영향을 주는 것으로 분석되었다. 장기적인 수질 분석 결과는 라구나 호수(Laguna Lake)의 수질이 강우량과 관련되는 계절의 영향을 받고 있는 것으로 나타났다. 이러한 라구나 호(Laguna Lake)의 수질영향인자 연구결과는 필리핀의 환경관리 기법을 향후 호내관리에서 유역관리로의 전환이 필요하다는 것을 의미하며, 선진국형 유역관리대책의 연구 및 도입이 필요한 것으로 평가되었다.
핵심용어 : 설계,인자, 하이브리드 인공습지, 질소저감
1. Introduction
The Philippines is an archipelagic country endowed with vast water resources potential. The abundance of surface water bodies enabled economic growth and livelihood opportunities for the communities living near coastal, fluvial, and lacustrine areas. Aquaculture, hydropower, transportation, and water supply industries, among others have experienced a major breakthrough due to the abundance of water resources in the Philippines. In 2010, the Philippines ranked 8th among the countries in East Asia with the largest percentage of built-up areas. Urban areas experienced a 2.4 percent growth rate from 2000 to 2010 (World Bank Group, 2015). Being the capital and center of trade and commerce in the country, Metro Manila was among the earliest cities that encountered the impact of urbanization. Urban sprawl also led to an increase in the amount of domestic waste being disposed into local waterways. Deterioration of water quality in urban areas is more predominant compared to rural areas (Padilla, 1996).
Despite the abundance of water sources, the Philippines is currently facing challenges on water resources management and water quality degradation (Rubio, et al., 2008).
Laguna Lake is one of the major water bodies located near Metro Manila. It primarily serves as a site for aquaculture, hydropower, transportation, and water supply industries. Despite its prime importance, the lake struggles under the pressures of rapid population growth and urbanization, industrialization, and deforestation (Wealth Accounting and the Valuation of Ecosystem Services, 2016).
Major waterways traversing densely-populated urban zones drain into the lake resulted to increased pollutant loads from domestic, industrial, and commercial sources. Laguna Lake has also been a site of for aquaculture. Despite being an integral part of comprehensive lake utilization, increased pollutant loads due to aquaculture can eventually lead to eutrophication (Zhou, et al., 2011). The decline of Laguna Lake’s productivity has been a major concern over the past years. Impacts of rapid urbanization and industrialization greatly altered the natural landscape of lake’s basin. Reduced green spaces in urban areas cause high runoff volumes with increased pollutant concentrations (Kang, et al., 2011). In line with the current environmental challenges in Laguna Lake’s ecosystem, this study mainly focused on the assessment Laguna Lake’s water quality. Variations of water quality at the different bays of Laguna Lake were observed to track the changes and determine the factors that affect the lake’s water quality. Moreover, lake management
practices in the Philippines were compared to the policies of other countries to determine the environmental management schemes necessary to improve the lake’s water quality. Ultimately, the prevailing and impending threats to the sustainability of Laguna Lake were assessed in the inquiry.
2. Materials and Methods
2.1 Study Area
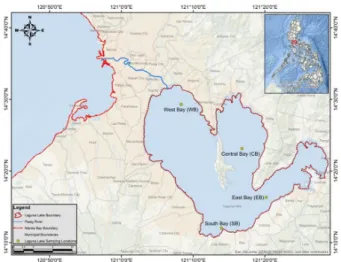
Laguna Lake is the largest inland fresh water body in the Philippines. Located just southeast of Manila, it is most important and dynamic lake in the Philippines owing to its vital economic, political, and socio-cultural significance (Iizuka et al., 2017). The lake has an approximate surface area of 900 km2. 24 hydrological sub-basins, covering some parts of Metro Manila and the provinces of Rizal, Cavite, Quezon, and Laguna from which over 100 rivers and streams drain, comprise the Laguna Lake watershed (Laguna Lake Development Authority, 2012). It mainly functions as a site for aquaculture, natural detention basin for flood control, and a source of water for domestic, commercial, and industrial water supply, among others.
Interconnected waterways form the Laguna Lake-Pasig River-Manila Bay watershed system. Laguna Lake is recharged by river inflows, rainfall, and ground water seepage. As shown in Fig. 1, the lake drains into the Manila Bay through the Pasig River. With a considerably large surface area and only a single outlet, hydraulic retention time can reach up to eight months (Santos-Borja &
Nepomuceno, 2004). The lake also serves as a detention basin for the flood waters coming from adjacent areas like Metro Manila. During rainy seasons, surface water level increases and may result to inundation of lakeshore areas.
Fig. 1. Laguna Lake-Pasig River-Manila Bay hydrologic system
On the contrary, the mean water level of the lake can drop up to a minimum 10.5 meters on dry seasons (University of the Philippines-Los Baños, 2005). Due to tidal fluctuations and the hydrodynamic contributions of wind velocities, salt water from Manila Bay backflows into the lake.
Laguna Lake can also be subdivided into four distinct bays: Central Bay (CB), East Bay (EB), South Bay (SB), and West Bay (WB). As presented in Table 1, each bay has distinct characteristics ranging from agricultural to urban land use, population distribution and demographics, and even climatic and hydrologic variations. Two climate types can be observed in the Laguna Lake watershed. Under the modified Corona climate classification system, Type I climate governs majority of the basin. Areas under Type I climate exhibit periods of low rainfall from November to April, and a maximum amount of precipitation during the months of June to September. On the other hand, areas in the basin categorized under Type IV climate demonstrate evenly-distributed rainfall throughout the year.
The Department of Environment and Natural Resources (DENR) classified Laguna Lake as Class C water. Generally,
Class C water bodies are suitable for fisheries, recreational activities, and industrial water supply. However, due to urbanization and extensive exploitation, Laguna Lake is stressed with competing water-users and continued environmental degradation (Herrera et al., 2014). Laguna Lake Development Authority (LLDA) was established on October 1, 1961 to protect the lake and prevent its further degradation. LLDA is a quasi-government agency that was given the mandate over the management and promotion of sustainable development within Laguna Lake and its surrounding areas. The agency formulates policies and conduct regular water quality monitoring activities. At present, continuous policy and management schemes are still being developed by LLDA and partner agencies to further improve the conditions of Laguna Lake.
2.2 Data Sources and Analyses
14 years of water quality data (1999-2012) were gathered from four sampling locations listed in Table 2. Water quality data obtained from LLDA include total suspended solids (TSS), total dissolved solids (TDS), biochemical oxygen demand (BOD), chloride (Cl-), dissolved oxygen (DO), Table 1. Basin characteristics of the four bays of Laguna Lake
Bay Sub-basins Basin population Drainage area, ha Built-up area, % Climate type Average rainfall, mm
Central Bay
Angono 333,986 8,691.05 38.30 Type I 1,777
Morong 72,234 9,926.53 19.99 Type I 2,224
Baras 44,183 2,270.63 5.78 Type I 2,188
Tanay 43,967 5,415.06 6.25 Type I 2,290
Pililla 45,275 4,118.75 8.61 Type I 2,189
Jalajala 51,154 7,311.87 14.94 Type I 1,820
East Bay
Sta. Maria 269,261 20,531.55 4.98 Type I 2,042
Siniloan 29,902 9,345.05 16.77 Type I 2,304
Pangil 63,652 5,585.66 14.89 Type I 3,978
Caliraya 46,300 13,521.86 10.87 Type I 3,232
Pagsanjan 155,705 31,899.03 6.91 Type I 2,791
Sta. Cruz 183,992 14,858.15 11.45 Type I 2,685
Pila 112,164 9,055.20 12.05 Type I 1,947
South Bay
Calauan 602,106 16,330.46 4.38 Type I 2,246
Los Baños 192,719 10,283.21 6.94 Type I 2,038
San Cristobal 292,141 14,065.93 13.01 Type IV 2,009
San Juan 376,555 20,421.39 4.33 Type I 1,896
Santa Rosa 934,879 12,030.36 33.59 Type I 1,873
West Bay
Marikina 1,579,647 54,325.62 17.35 Type I 2,657
Manggahan 1,198,176 8,760.90 91.55 Type I 2,140
Biñan 63,563 8,603.22 5.78 Type I 2,005
San Pedro 332,374 4,709.02 12.16 Type I 2,152
Muntinlupa 567,457 4,384.58 38.93 Type I 1,914
Taguig 822,562 4,537.59 87.16 Type I 2,016
Source: LLDA, 2012
Table 2. Coordinates of water quality sampling stations in Laguna Lake, Philippines
Sampling Station Location
Latitude Longitude
Central Bay 14°23'8.88"N 121°16'48.69"E East Bay 14°16'19.14"N 121°20'11.19"E South Bay 14°12'1.45"N 121°13'56.56"E West Bay 14°29'17.97"N 121° 8'20.18"E Source: LLDA, 2012
turbidity, pH, ammonia (NH3), nitrates (NO3-), and phosphates (PO43-). The sampling sites were specifically chosen to represent the water quality of Laguna Lake at four different bays. Relatively longer water quality data on the chosen sites were recorded compared to other monitoring stations. Furthermore, the four sampling sites effectively reflected variations in water quality in relation to each bay’s watershed characteristics, hydrologic patterns, and land use attributes. Statistical analyses were administered to compare the difference in water quality among CB, EB, SB, and WB. Long-term variations of water quality within the lake were also evaluated to note seasonal trends. A brief comparison among Laguna Lake and selected lakes from Germany, South Korea, and the United States of America was considered in the study. Water quality data and water quality standards of each country were obtained from related studies and concerned agencies.
3. Results and Discussion
3.1 Water quality analyses
3.1.1 Water quality analogy among CB, EB, SB, and WB
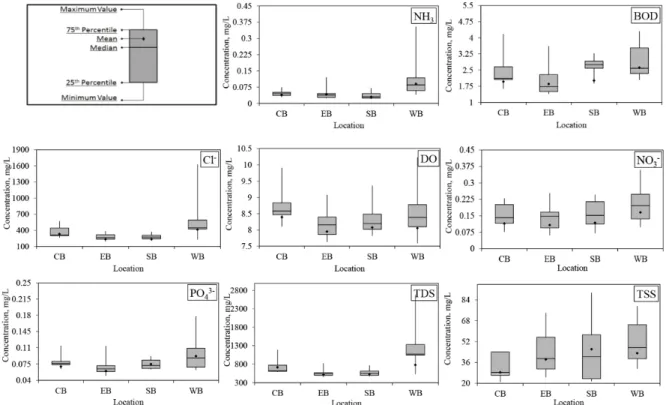
Rapid growth of population, deforestation, and land conversion caused substantial changes in the natural environment and water quality of Laguna Lake and its adjacent basins (Wealth Accounting and the Valuation of Ecosystem Services, 2016). Fig. 2 provides a graphical summary of the 14-year mean water quality in all four bays of Laguna Lake. Higher mean concentrations of TDS (8.8% to 51.89%), Cl- (25.72% to 79.18%), BOD (30.06%
to 41.27%), NH3 (117.38% to 202.7%), NO3- (40.28% to 54.39%), and PO43- (23.23% to 53.89%) were observed in WB compared to other bays. Pasig River is the sole outlet of Laguna Lake that connects WB to Manila Bay. Increased concentrations of Cl- and TDS resulted from the salt water influx from Manila Bay during periods of low lake water elevation. WB has the highest percentage of built-up areas among all four bays amounting to approximately 28.34%
of its basin area. High nitrogen and phosphorus loads from urban runoff and septic tank leaks are among the major issues of lakes near urban areas (Francis & Chadwick, 2013).
In 2015, only 11% of Metro Manila’s population was served
Fig. 2. Box plots of water quality parameters in CB, EB, SB. and WB
by a centralized sewerage system, 85% have septic tanks that are not well-maintained, and 4% have no toilet (Claudio, 2015).
Mean TSS concentration at SB is 7.16% to 62.5% higher compared to other bays due to the high erosion rate at San Cristobal sub-basin and some areas around Mt.
Makiling (Blanco & Nadaoka, 2006). Mean DO concentration of all bays were comparable at 8.11 mg/L.
Among the four sampling sites, EB exhibited lowest TDS, BOD, and PO43- with mean concentrations of 511.22 mg/L, 1.85 mg/L, and 0.06 mg/L, respectively. Significant reduction of pollutant loadings can be attributed to the relatively-low percentage built-up areas in CB (19.16%) and EB (9.44%). Lowest mean concentration of NO3- was recorded at EB and CB (0.11 mg/L). CB has also recorded the lowest mean TSS (28.39 mg/L), whereas SB registered the lowest detection for NH3 (0.03 mg/L). Generally, better water quality was observed on CB, EB, and SB, because the respective bays experience less human intervention as compared to WB.
3.1.2 Long-term variations in the water quality The 14-year plot of various water quality data in the four sampling sites of Laguna Lake were exhibited in Fig. 3.
Maximum values of Cl- and TDS were observed at WB on May 2004 with mean concentrations of 8,556 mg/L and 7,004 mg/L, respectively. Annual mean Cl- (264.96 mg/L) and TDS (549.70 mg/L) concentrations were also noted during the month of May at WB. During dry months, the functional minimum water level of Laguna Lake reaches the same elevation as the sea level (University of the Philippines-Los Baños, 2005). These unusually-high values resulted from the reversal of bay-lake potential gradient that led to a lake-ward flow from Manila Bay to Laguna Lake through the Pasig River (Hererra et al., 2014).
The lowest DO concentration, amounting to 4.1 mg/L, was recorded on May 2008. On the same month in the year 2012, NH3 concentration was recorded to be 3,676%
higher than the limit set by DENR for class C water bodies.
Excessive NH3 concentration in the lake can be attributed to the diffusion of sediments accumulated in the lake.
Alarming rates of algal blooms and phytoplanktons were generally observed in the lake during the months of May to September (Santos-Borja & Nepomuceno, 2004). Fecal deposits and dead algae that settled at the bottom of the lake produce NH3 during the process of decomposition (YSI, 2010). Moreover, the mean evaporation at Laguna Lake during the month of May was recorded to be 7.31 mm/day (Japan International Cooperation Agency, 2014). Reduced
water level caused by extensive evaporation made the lake sediments vulnerable to disturbances and thus, resulted to high NH3 and low DO values.
Climatic conditions also contribute to variations in water quality of Laguna Lake. Historical peaks in the concentrations of BOD, NO3-, and PO43- were observed during the months of July to October between 2009 and 2010 where maximum rain periods occur. Heavy downpours during this period produced surface runoff that washed-off urban storm water and agricultural inputs such as fertilizers (University of the Philippines-Los Baños, 2005). Aside from the increased nutrient loading, fertilized bodies of water harboring phytoplankton blooms are susceptible to increased pH levels (Tucker and D’Abramo, 2008). This is evident on WB where pH level reached 10 on June 2002. Relatively dry climate is experienced in Laguna Lake from November to April.
However, low temperature and high wind velocities characterize this period. The turbulence produced by the interaction of wind and water surface can be accounted for the high TSS concentration recorded at SB on February 2006, corresponding to 272.5% exceedance in the TSS limit set for Class C water bodies.
An increasing trend in the concentrations of BOD, DO, pH, NH3, NO3-, and PO43- were noted in the analysis of Laguna Lake’s water quality. Observations indicating high nutrient concentrations clearly denoted a decline in the lake’s watershed over the years. On the other hand, Cl-, TDS, and turbidity levels posted a decreasing trend from 1999 to 2012. In the year 1983, the Napindan hydraulic control structure was constructed to ease the flooding situation in Metro Manila, and prevent further entry of pollution and salt water from Pasig River. Decreasing trends in turbidity, Cl-, TSS, and TDS concentrations was induced by the government’s efforts to mitigate the effect of pollution and salt water and intrusion to the water quality of Laguna Lake.
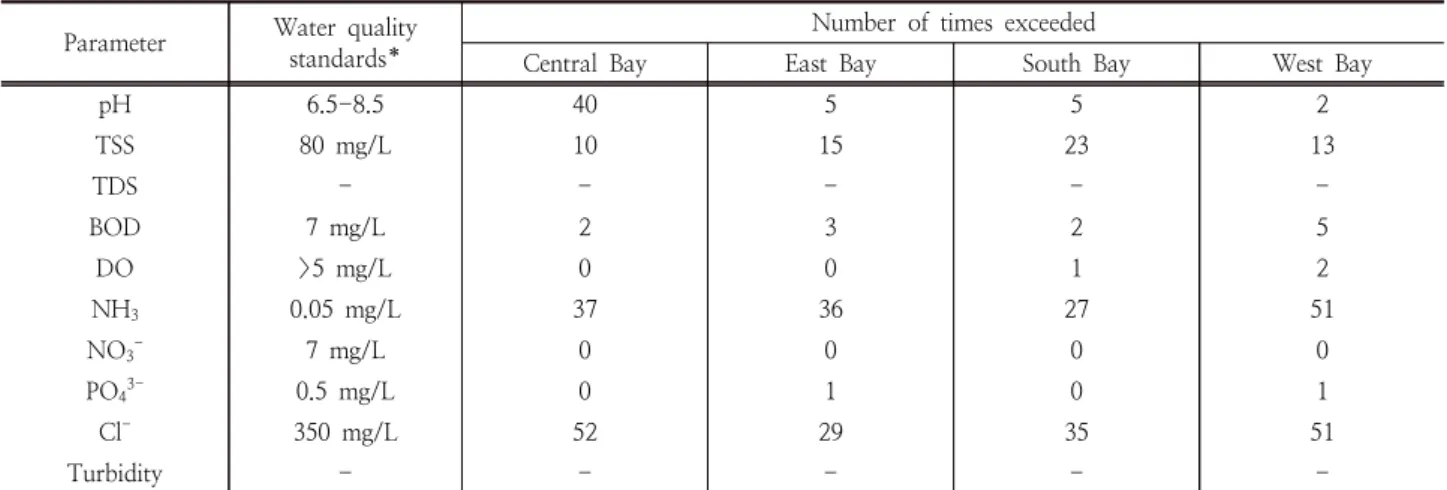
Fluctuations in water quality were very common among natural lakes. Aside from human intervention, environmental, hydrological, and biological processes directly contributed to the deviations in the ambient water quality of the lake. As shown in Table 3, exceedance in water quality standards occurred several times for a period of 14-years (1999-2012). Among the water quality parameters, Cl- concentration had the most exceedance (167 times) with respect to the water quality standard for class C water bodies. Frequent exceedance in BOD and NH3 concentrations were prominent on WB due to the combined effects of pollutant loading from Pasig River and improperly managed urban wastes. A detailed illustration
of the exceedance probabilities were presented in Fig. 4.
30% exceedance probability in the limit for Cl- and NH3
was recorded at WB. 10% of the time, there is a probability that TSS concentration at SB may exceed the limit for class
C surface water bodies. The likelihood of exceeding the BOD limit was only 1% for all bays. As for PO43- and NO3-, exceedance in the limit was unlikely to happen based on the historical record of Laguna Lake’s water quality.
Fig. 3. 14-year trend of water quality in Laguna Lake, Philippines
3.2 Comparison of policies and management strategies to other countries
Environmental management approaches and policies differ from one country to another. The comparison of Laguna Lake’s water quality and water quality standards from other countries was summarized in Table 4. The mean TSS concentration in Laguna Lake was 286.61% to 1,165.75%
higher than Paldang Lake and Onondaga Lake, respectively.
However, all three lakes passed the TSS standard of the respective countries. The mean TDS and Cl- concentrations of Onondaga Lake was 112.50% and 62.33%, respectively, higher than the TDS and Cl- concentrations in Laguna Lake.
Because Onondaga Lake, was previously utilized as a site
for salt-making industries, saline water was still prominent in the area. Mean BOD levels of Laguna Lake, Onondaga Lake, and Paldang Lake were comparable (2.56 mg/L), but since the the BOD standard of South Korea was more stringent compared to other countries, mean BOD concentration at Paldang Lake did not pass the standard set by the Ministry of Environment in South Korea. Among the four lakes, Lake Constance had the highest mean NH3
concentration (7.5 mg/L). Mean NH3 concentration at Laguna Lake complied to the 0.05 mg/L standard, but Paldang Lake exceeded MOE’s standard by 43%. A relatively-high NO3- concentration was recorded at Paldang Lake. While Laguna Lake and Lake Constance complied to the water quality standards, no limits were set for the Table 3. Frequency of exceedance in pollutant concentration from the water quality standards
Parameter Water quality standards*
Number of times exceeded
Central Bay East Bay South Bay West Bay
pH 6.5-8.5 40 5 5 2
TSS 80 mg/L 10 15 23 13
TDS - - - - -
BOD 7 mg/L 2 3 2 5
DO >5 mg/L 0 0 1 2
NH3 0.05 mg/L 37 36 27 51
NO3- 7 mg/L 0 0 0 0
PO43- 0.5 mg/L 0 1 0 1
Cl- 350 mg/L 52 29 35 51
Turbidity - - - - -
*DENR water quality standards for Class C water bodies
Fig. 4. Exceedance probabilities of water quality parameters
maximum NO3- levels in South Korea and the state of New York in the United States. As for mean DO and PO43-
concentrations, all four lakes complied to the standards set by the respective countries.
In Germany, phosphorus has been identified as the main cause of eutrophication in Lake Constance. Approximately six billion US dollars were invested for the construction of sewage canals and 220 water treatment plants in order to significantly reduce the excessive P levels in the lake (Hammerl & Gattenloehner, 2006). Significant achievements in reducing the pollutant concentration in Onondga Lake was achieved since 1990. Improvement on the wastewater treatment schemes, implementation of storm water runoff control, and reduction of combined sewer overflows became the main components for the restoration of Onondaga Lake (New York State Department of Environmental Conservation, 2010). The master plan for water environment in management in South Korea focused on the nationwide water quality conservation. The first phase of the project was fixated on the reduction of major pollutant incident on bodies of water by constructing sewage treatment plants and two centralized water supply systems.
Management of non-point sources (NPS) of pollution was also introduced to achieve the “good water” criteria on at least 85% of South Korea’s rivers (Ministry of Environment, 2016). By applying the low impact development (LID) and green infrastructure (GI) technologies, South Korea was able to manage the pollution from NPS efectively.
The environmental performance index presented a method of assessing a country’s environmental policies through numerical calculations of environmental management data functions. As of 2014, the Philippines ranked 114th, South Korea at 43rd, United States of America at 33rd, and Germany ranked 6th out of the 178 countries evaluated by the institutions (Yale University & Columbia University, 2014). This clearly indicated that the environmental performance of the Philippines can still be improved by ammending the existing environmental management practices and/or adopting other developed countries’
environmental conservation policies.
3.3 Challenges and future concerns
One of the longstanding dispute that remains unsettled was the use of Laguna Lake as a site for aquaculture. Salt water intrusion in Laguna Lake causes a brackish water consistency that is suitable for breeding fishes. Efforts of reducing salt water intrusion were strongly opposed by fishermen and fish pen operators, because this will reduce the lake’s productivity for aquaculture (Santos-Borja et al.,
1995). However, conflict of interest emerged with the other sectors depending on the lake’s water resources. Aside from incurring additional costs in treating water for domestic supply caused by the increased levels of salinity, aquaculture also contributes a notable amount of pollutant load in the lake.
The continuous population growth and urban sprawl in many parts of Laguna Lake watershed also served as stressors in the lake’s sustainability. Population growth in the cities adjacent to the lake amounted to 29% from 2003 to 2010 (World Bank Group, 2015). Increased number of household eventually led to aggravation of domestic waste production.
Another study of World Bank Group indicated that 81%
of BOD loads came from domestic wastes (World Bank Group 2016). Non-point sources of pollution were also unmanaged in the Philippine setting. In the year 1996, built-up and industrial areas only constitute 17% of Laguna Lake’s basin. However, the percentage of built-up and industrial areas increased to 29% in the year 2000 (University of the Philippines-Los Baños, 2005). Due to the conversion of land within the basin, augmented volume of surface runoff that carry sediments of high pollutant concentration were directly deposited into the lake.
Legislative control in promoting environmental measures remains a major challenge in most developing and transitional countries like the Philippines (Wingqvist et al., 2012). With the effort of minimizing the impact of effluent discharges in the lake, DENR issued the administrative order 2016-08 or the water quality guidelines and general effluent standards of 2016. However, a five-year grace period was given to the the industrial and water sectors before the policy takes full effect. Limited resources and manpower was also an important factor that led to inadequate management of the Philippine waters. Despite the 158 to 210 million US dollars allocation for water and sanitation projects, the budget for improving the water quality of aquatic ecosystems was deemed insufficient (Gorme et al., 2010).
4. Conclusion
Water resources are integral part of economic development and stability. It can be directly accessible as surface water or in more delicate cases, as ground water. Despite its abundance, water can also be considered as one of the most fragile resources. Laguna Lake is a clear example of a distressed ecosystem suffering from degraded water quality due to the increased trends of nutrient and pollutant concentrations. Several concerns including population growth, urbanization, funding, and government intervention remain the greatest challenges in resolving the continuous
degradation of Laguna Lake watershed. Widespread urbanization and industrialization on the western sub-basins accelerated the deterioration of the lake’s environment and water quality. Increased concentration of nutrients and BOD loading was prominent in WB as a result of improper wastewater management and enhanced urban storm water runoff. Salt water intrusion coming from the Pasig River also caused increased Cl- and TDS levels, especially on dry months when the lake’s surface water elevation is lower than that of Manila Bay’s.
Other developed countries such as Germany, South Korea, and the United States of America also experienced water quality issues. However, international cooperation and a systematized approach of eliminating primary sources of pollution already resulted to an improved water quality in these countries. In the Philippines, government efforts have been devised to restore the ecological balance in the lake. Adopting foreign policies can further improve the management strategies currently employed in Laguna Lake.
Germany’s phosphorus reduction policy can be adopted to improve the state of eutrophication in the lake. By constructing canals and sewage treatment facilities, significant progress has been achieved in Lake Constance.
New York State’s policy can be employed in Laguna Lake to reduce NH3 and other nutrient concentrations draining into the lake. Upgrading wastewater treatment facilities and separation of storm water and sanitary sewer lines effectively improved the water quality of receiving water bodies. Sources of pollution can be classified as point sources (PS) or non-point sources (NPS) (Gorme, et al., 2009). After addressing point sources of pollutions such as domestic wastewater discharges, the Philippines can adopt Korea’s efforts of reducing NPS by introducing LID and GI technologies. By employing other countries’ effective environmental management practices and policies, water quality and environmental degradation issues in the Philippines can be resolved.
Acknowledgements
This research was made possible by the data gathered from the Laguna Lake Development Authority, other concerned agencies in the Philippines. The authors are grateful for their cooperation.
References
Blanco, AA and Nadaoka, K (2006). A Comparative Assessment and Estimation of Potential Soil Erosion Rates and Patterns
in Laguna Lake Watershed Using Three Models: Towards Development of an Erosion Index System for Integrated Watershed-Lake Management, ASEAN Engineering Journal, 4(1), pp. 48-62.
Bodensee-Wasserversorgung (2016). http://www.bodens eewasserversorgung.de/fileadmin/PDF/Jahresmittelwert e_2016_V08.pdf
Claudio, L. (2015). Wastewater Management in the Philippines. Region 3, Philippines: Environmental Management Bureau.
College of Forestry and Natural Resources, University of the Philippines-Los Baños. (2005). Ecosystems and People:
The Philippine Millenium Ecosystem Assessment (MA) Sub-global Assessment, R Lasco, MV Espaldon, M Tapia (eds.), Laguna, Philippines: Environmental Forestry Programme, College of Forestry, University of the Philippines-Los Baños.
Department of Environment and Natural Resources (DENR).
(2016). Water Quality Guidelines and Effluent Standards of 2016, Quezon City.
Francis, RA and Chadwick, MA (2013). Urban Ecosystems:
Understanding the Human Environment, Routledge, New York.
Gorme, JB, Maniquiz, MC, and Kim, LH (2009). Status of Water Quality and Future Plans in the Philippines, J. of Korean Wetlands Society, 11(3), pp. 89-103.
Gorme, JB, Maniquiz, MC, Song, P, and Kim, LH (2010). The Water Quality of the Pasig River in the City of Manila, Philippines; Current Status, Management and Future Recovery, Environmental Engineering Research, 15(3), pp.
173-179. http://dx.doi.org/10.4491/eer.201015.3.173.
Hammerl, M, and Gattenloehner, U. (2006). Lake Constance:
Experience and Lessons Learned Brief. Germany.
Herrera, EC, Nadaoka, K, Blanco, AC, and Hernandez, EC (2014). Hydrodynamic Investigation of a Tropical Lake Environment (Laguna Lake, Philippines) and Associated Implications for Eutrophic Vulnerability, ASEAN Engineering Journal, 4(1), pp. 48-62.
Iizuka, K, Johnson, BA, Onishi, A, Magcale-Macandog, D, Endo, I, and Bragais, M (2017). Modeling Future Urban Sprawl and Landscape Change in the Laguna de Bay Area, Philippines, Land, 6(2), pp. 26. 10.3390/land6020026 Japan International Cooperation Agency (JICA). 2014. Data
Collection Survey on Flood Management Plan in Metro Manila. Philippines
Kang, CG, Maniquiz, MC, Son, YGC, and Kim, LH (2011).
Development of Small Constructed Wetland for Urban and Roadside Areas, J. of Korean Wetlands Society, 13(2), pp.
231-242.
Kong, D (1997). Limnological and Ecological Characteristics of a River-Reservoir (Paldang), Korea, Korean J. of
Limnology, 30, pp. 524-535.
Laguna Lake Development Authority (LLDA). (2012).
Hydrologic Atlas of the 24 Subbasins of Laguna de Bay 2012, Quezon City.
Ministry of Environment (MOE) (2016). http://eng.me.go.kr/
eng/web/index.do?menuId=262.
National Institute of Environmental Research (NIER) (2017).
http://www.nier.go.kr/NIER/egovEngIndex.jsp
New York State Department of Environmental Conservation (2010). http://www.dec.ny.gov/chemical/8668.html Onondaga County Department of Water Environment
Protection (2015). http://www.ongov.net/wep/we1507.html Padilla, JE (1996). Water Quality and Fisheries Issues
Accompanying Population Growth in the Philippines, J. of Philippine Development, 13(2), pp. 315-336.
Petri, M (2006). Water Quality of Lake Constance, The Handbook of Environmental Chemistry, Volume 5, Part L: The Rhine, TP Knepper (ed.), Springer-Verlag, Berlin, pp. 127-138.
Rubio, CJ (2008). Water Resources Evaluation in the Philippines, J. of Korean Wetlands Society, 10(3), pp.
47-56.
Santos-Borja, AC, Cataquiz, CR, and Lopez, C (1995). Building Alliances for Sustainable Management: The Laguna de Bay Experience, Fresh Water Management Series No. 3, United Nations Environment Programme Division of Technology, Industry, and Economics, Pasig City.
Santos-Borja, A and Nepomuceno, D (2004). http://www.
worldlakes.org/uploads/Laguna%20_1.13.04.pdf Tucker, CS and D'Abramo, LR (2008). Managing High pH in
Freshwater Ponds, SRAC Publication No. 4604, Southern Regional Aquaculture Center, Mississippi.
United States Environmental Protection Agency (USEPA) 2017.
https://www.epa.gov/dwstandardsregulations/seconda ry-drinking-water-standards-guidance-nuisance-che micals
Wealth Accounting and the Valuation of Ecosystem Services (WAVES). (2016). Laguna de Bay Basin Ecosystem Accounts, Laguna de Bay Basin Technical Report 2016, Wealth Accounting and the Valuation of Ecosystem Services, Quezon City.
Wingqvist, GO; Drakenberg, O, Slunge, D, Sjöstedt, M, and Ekbom, A. (2012). The Role of Governance for Improved Environmental Outcomes, Report 6514, Swedish Environmental Protection Agency, Stockholm.
World Bank Group. (2016). Ecosystem Accounts Inform Policies for Better Resource Management of Laguna de Bay, Policy Briefing, World Bank Group, Washington, DC.
World Bank Group (2015). http://www.worldbank.org/
en/news/press-release/2015/01/26/world-bank-repor t-provides-new-data-to-help-ensure-urban-growth
-benefits-the-poor
Yale University and Columbia University (2014).
http://archive.epi.yale.edu/epi/country-rankings YSI (2010). https://www.ysi.com/File%20Library/Documents/
Application%20Notes/A585-Understanding-Ammonia -in-Aquaculture-Ponds.pdf
Zhou, HD, Jaing, Cl, Zhu, LQ, Wang, XW, Hu, XQ, Cheng, JY, and Xie, MH (2011). Impact of pond and fence aquaculture on reservoir environment, Water Science and Engineering, 4(1), pp. 91-100. https://doi.org/10.3882/
j.issn.1674-2370.2011.01.009.