1)
†
To whom correspondence should be addressed.
Jeongwon Kang
E-mail: [email protected]
∙ Yunji Kim Korea Institute of Ocean Science & Technology / Student apparentice ([email protected])
∙ Jeongwon Kang Korea Institute of Ocean Science & Technology / Principal Research Scientist ([email protected])
∙ Seonyoung Park Korea Institute of Ocean Science & Technology / Post Master Scientist ([email protected])
Changes in sedimentary structure and elemental composition in the Nakdong Estuary, Korea
Yunji Kim・Jeongwon Kang † ・Seonyoung Park
Korea Institute of Ocean Science & Technology
낙동강 하구역 퇴적구조 및 원소조성 변화에 관한 연구
김윤지・강정원 † ・ 박선영
한국해양과학기술원
(Received : 08 December 2020, Revised : 11 May 2021, Accepted : 15 July 2021)
Abstract
To understand the sedimentary environment of Scirpus planiculmis habitat (Myeongji and Eulsuk tidal flats) in the Nakdong Estuary, this study analyzed the statistical parameters (sorting, skewness, and kurtosis) of grain size data and the major (Al, Fe, Mn, Mg, Ca, Na, K, Ti, and P), minor (Li, Sc, V, Cr, Co, Ni, Cu, Zn, Sr, Zr, Cs, Pb, Th, and U), and rare earth elements (REEs) in sediment cores. For Myeongji, the sediment structure of the upper part of the cores was poorly sorted, more finely skewed, and more leptokurtic due to construction of the West gate. By contrast, the Eulsuk cores all differed due to the contrasting floodgate operation patterns of the West and East gates. The linear discriminate function (LDF) results corresponded to the statistical parameters for grain size. At the Eulsuk tidal flat (sites ES05 and ES11), elemental distributions were representative of Al-, Fe- and Ca-associated profiles, in which the elements are largely controlled by the accumulation of their host minerals (such as Na- and K-aluminosilicate and ferromagnesium silicate) and heavy detrital minerals at the sites. Detrital minerals including the aluminosilicates are major factors in the elemental compositions at ES05, diluting the REE contents. However, clay minerals and Fe-oxyhydroxides, as well as REE-enriched heavy minerals, appeared to be controlling factors of the elemental composition at ES11. Therefore, the mineral fractionation process is important in determining the elemental composition during sedimentation, which reflects the depositional condition of riverine–saline water mixing at both sites.
Key words : Hydrodynamic, Nakdong Estuary, Sedimentary environment, Tidal flat
요 약
낙동강 하구 새섬매자기 식생지역의 수리역학적 퇴적환경을 알아보기 위하여 명지와 을숙도 조간대에서 6개의 퇴적물 코어 를 채취하여 퇴적물 입도와 원소분석 (주원소, 미량원소, 희토류 원소)을 수행하였다. 명지 조간대의 퇴적환경은 낙동강 하 구둑 좌측 수문의 영향 때문에 퇴적물 상부 (~ 15 cm)에서 분급도가 불량하고 왜도 및 첨도는 양의 값을 보였다. 반면에 을숙도 조간대는 주 수문뿐만 아니라 좌측 수문의 방류 영향으로 정점 별로 서로 다른 퇴적상을 보였다. 퇴적환경의 변화를 알아보기 위하여 분급도, 왜도 및 첨도 등을 이용하여 Linear Discriminate Function (LDF) 분석을 진행하였으며, 그 결과 퇴적물 상부에서 주로 에너지가 강한 퇴적환경이 나타났다. 을숙도 조간대의 ES05 (식생지역)와 ES11 (비 식생지역) 정점 의 원소분포는 크게 Al, Fe 및 Ca 주요원소들의 분포와 관련하는 광물구성의 영향을 받는다. 알루미노실리케이트 (Aluminosilicate)를 포함하는 쇄설성 광물들은 퇴적물의 희토류 함량을 희석시키며, 특히 ES05 정점 퇴적물의 원소조성을 결정하는 주요 요인으로 작용하였다. 반면에 ES11 정점의 원소조성은 점토광물과 철수산화물, 그리고 희토류 함량이 높은 중광물에 의해 조절되는 것으로 나타났다. 따라서 새섬매자기 조간대 퇴적물의 원소조성은 광물 분별 과정의 영향을 받으 며, 이는 담수-해수 혼합 지역의 퇴적환경을 반영한다.
핵심용어 : 수리역학, 낙동강 하구, 퇴적환경, 조간대
1. Introduction
The Nakdong River is the second longest river in Korea and barrier islands have formed in the Nakdong Estuary. The topography of the Nakdong Estuary changed significantly after construction of the Nakdong Estuary dam (Oh, 1999). In addition, the brackish zone of the estuary disappeared after dam construction, which altered the ecosystem (Kim et al., 2019). The intertidal mudflats located among the barrier islands in the estuary generate different habitats, which have high biodiversity. The Nakdong Estuary is the biggest wintering site for migratory birds in the east and it has been protected since 1966 (Kim et al., 2019). Cyperaceae, reeds, and
Scirpus planiculmis
are abundant inland, at the edges of sand bars, and in the intertidal mudflats, respectively (Kim et al., 2005, 2013; An et al., 2006; Kim, 2014).S. planiculmis
is the main halophyte in the Nakdong Estuary and is a major food plant for birds wintering there (An et al., 2006; Yi et al., 2011).However, the
S. planiculmis
population has decreased gradually over several decades (Kim et al., 2005) and various restoration campaigns have been conducted (Busan Metropolitan City, 2014; Kim et al., 2019).In general, the sedimentation rate in estuaries increases after estuarine dam construction (Barusseau et al., 1998; Gao et al., 2012; Williams et al., 2015). In Korea, the mean accumulation rate has increased approximately twofold after estuarine barrage constructions, and sedimentation rate increases have been reported in the Geum (from < 6 to ~20 cm yr
−1
) and Yeongsan estuaries (from <1.5 to 0.9-10 cm yr-1
) after the construction of estuarine dams (Kim et al., 2006;Williams et al., 2014, 2015). The Nakdong Estuary experienced a higher sedimentation rate and rapid topography change following construction of an estuarine dam (Oh, 1999; Williams et al., 2015; Kim and An, 2017). Each channel has a different discharge energy regime because of contrasting dam operation patterns (Williams et al., 2013): the West Nakdong River has no dam discharge and the lowest sedimentation rate at 2.19 cm yr
−1
, while the East Eulsuk Channel has a consistent dam discharge from the main gate and the highest sedimentation rate of 6.55 cm yr− 1
was observed at the West Eulsuk Channel (Williams et al., 2013). In addition, the geomorphological changes and higher sedimentation rate of the Nakdong Estuary decreased the tidal prism by at least 50%, which resulted in a shift from tide-dominated to wave-dominated systems (Williams et al., 2013, 2015).The sediment characteristics of the Nakdong Estuary, such as mud and organic carbon content, have been influenced by the discharge of the floodgates (Lee et al., 2019; Williams et al., 2013). Kim et al. (2019) reported that the subsurface
sediment at Myeongji has lower salinity with a higher mud content due to discharge of the West gate. The sediment near the East Eulsuk Channel contains more mud because the main gate discharges water and other materials (e.g., mud and organic matter) to this channel (Kim and Lee, 1980; Lee, 1993; Kim and Ha, 2001; Yoon and Lee, 2008; Kim and An, 2017; Williams et al., 2013, 2015). Although the overall sediment characteristics of the Nakdong Estuary have been studied, those of vegetation areas in the estuary have rarely been studied. Therefore, this study investigated the sedimentary environment of
S. planiculmis
vegetation areas in the Nakdong Estuary, including sediment grain size and elemental content.2. Materials and methods
2.1 Study area
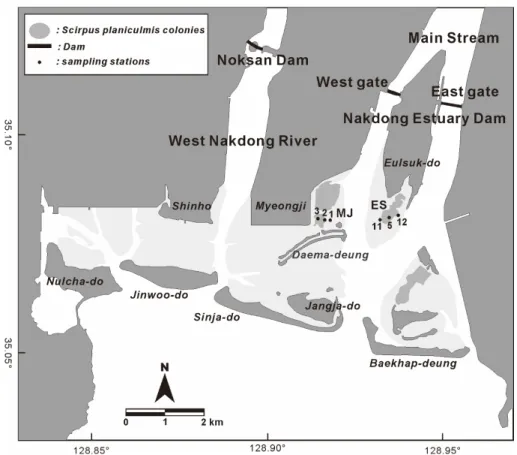
The Nakdong River is the second longest river in South Korea, with a length of ~520 km (Williams et al., 2015). The Nakdong Estuary is located in Busan, facing industrial, agricultural, and housing areas. The Nakdong Estuary consists of West Nakdong River and the main stream of Nakdong River, which is divided into the West and East Eulsuk Channels by Eulsuk-do (Fig. 1). There has been no river flow in West Nakdong River since 1934, when the Noksan dam and Daedong gate were constructed (Williams et al., 2013; MOE, 2015). The Nakdong Estuary dam was installed in 1987;
an additional floodgate, the West gate, was built in 2012 at the main stream of Nakdong River (MOE, 2015). The main gate is the East gate, which discharges consistently (daily to weekly), While the West gate discharges periodically (weekly to monthly) (Williams et al., 2013; Kim and An, 2017). The sedimentation rate in the Nakdong Estuary is approximately 4 cm yr
−1
(KIOST, 2017). After construction of the Nakdong Estuary dam, the topography of the estuary changed rapidly (Oh, 1999). A series of barrier islands have developed, which is related to modification of the grain size distribution (Williams et al., 2013).2.2 Sampling
Six sediment push cores were obtained in the Nakdong Estuary in June 2018 (Fig. 1). Three cores were collected in Myeongji tidal flat (MJ01, MJ02, and MJ03), and another three were collected in Eulsuk tidal flat (ES05, ES11, and ES12). Each core was ~30 cm in length; after collection, each core was sealed and immediately transferred to the laboratory. Cores were subsampled at 2-cm intervals for grain size and element analyses; samples were stored frozen in sterile plastic bags until further processing.
2.3 Grain size analysis
Grain size analysis was conducted primarily in accordance with the Korean Standard Methods for Marine Environment (MOF, 2014). Sediment samples were carried in washed 500-mL beakers. Organic matter and biogenic carbonate were removed by hydrogen peroxide solution and hydrochloric acid solution, respectively. Then, the sediment samples were washed several times with deionized water. When the samples became neutral, wet sieving was carried out using a four phi (62.5 µm) sieve to separate the mud and sand fractions. For the mud fraction, grain size was analyzed with a SediGraph III PLUS (Micromeritics). The sand fraction was separated using standard sieves. Both fractions were separated at 0.5-phi intervals. The statistical parameters of grain size, such as mean grain size (phi), sorting (phi), skewness, and kurtosis, were calculated using GRADISTAT (Folk and Ward, 1957; Blott and Pye, 2001).
2.4 Element contents
Powdered samples (~0.2 g) were digested with ultra-pure HNO
3
(3 mL) and HClO4
(1 mL) in a tightly sealed Teflon vessel on a hot plate at 170°C for 24 h. The contents evaporated to near dryness on the hot plate after removing the screw-type lid. After cooling the vessel, the sample was re-dissolved in a mixture of 1.5 mL HF and 0.5 mL HClO4
for 24 h (e.g., Kang et al., 2014). The solutions were evaporated to dryness,and the resulting white cake was dissolved with 1% HNO
3
. Minor elements and rare earth elements (REEs) were measured using inductively coupled plasma mass spectrometry (ICP-MS;Model X-2, Thermo Elemental), and major elements were measured with ICP atomic emission spectrometry (ICP-AES;
Optima 8300, PerkinElmer) at the Korea Basic Science Institute.
The sediment digestion method used in this study was an experimental method for sediment dissolution. The United States Geological Survey marine sediment reference material (MAG-1) was used together with sediment samples. Recoveries were in the range 90–110% (e.g., Song and Choi, 2009; Kang et al., 2016).
3. Results and discussion
3.1 Hydrological effects on grain size distribution
Grain size studies provide information on sediments and sedimentary environments (Rajganapathi et al., 2013). To study sediment transport, the mean grain size (phi), sorting (phi), skewness, and kurtosis must be analyzed (Folk and Ward, 1957) because these are determined by the energy environment (McLaren and Bowles, 1985). For example, river estuary and beach sediments are negatively skewed (coarse skewed) by a winnowing process and positively skewed (fine skewed) by sediment deposition, respectively (Duane, 1964; Dora et al., 2011).Fig. 2 shows the sorting, skewness, and kurtosis of the
Fig. 1. The location of the sampling stations. The light grey area is tidal flat and the dark grey area is
Scirpus planiculmisvegetation area.
Myeongji and Eulsuk tidal flat cores. As the sediment became sorted, the skewness and kurtosis of the samples became coarser and less leptokurtic. The upper 15 cm of the Myeongji tidal flat cores and subsurface sediment of ES05 were more poorly sorted, more finely skewed, and more leptokurtic, while the lower parts of the tidal flat cores were better sorted, more coarsely skewed, and less leptokurtic (Fig. 2). The sorting, skewness, and kurtosis of ES11 fluctuated, while ES12 was poorly sorted, very fine skewed, and very leptokurtic over the entire depth (Fig. 2c, d). Sediment that was more poorly sorted, more finely skewed, and more leptokurtic contained more mud.
Every sample with higher mud content was more poorly sorted. Mud and other materials flow into estuaries via river discharge and the discharge of the Nakdong Estuary is controlled by floodgates (Williams et al., 2013). ES12, which is located near the East Eulsuk Channel, would be supplied a large amount of mud and other materials through the East gate due to its consistent, regular discharge. By contrast, ES05 is located in the inner part of Eulsuk tidal flat, which might be at relatively
higher elevation. Therefore, ES05 might be influenced less by the dam discharge, but the entire depth of ES12 and subsurface of ES05 were poorly sorted due to mud supply.
The mud content at Myeongji tidal flat has recently increased, which may have resulted from construction of the West gate (Kim et al., 2019). The sedimentation rate in the Nakdong Estuary was ~2.5 cm yr
−1
(KIOST, 2017), and the depth of 15 cm is consistent with 2012 when the West gate was constructed (MOE, 2015). Before its construction, there was no direct influx of mud or other materials into the West Eulsuk Channel from the Nakdong River. Because the West gate discharges occasionally (Williams et al., 2013), the West Eulsuk Channel might receive mud supply irregularly, which could result in the sediment being more poorly sorted.The linear discriminate function (LDF; Sahu, 1964;
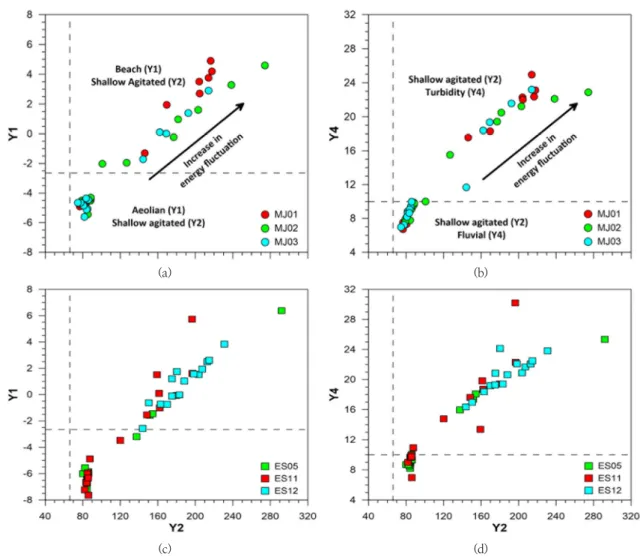
Rajganapathi et al., 2013) is a statistical method used to interpret variation in fluidity (viscosity) and energy factors in depositional environments, distinguishing aeolian, beach (littoral), shallow agitated marine, fluvial (deltaic), and turbidity current
(a) (b)
(c) (d)
Fig. 2. The plots of (a) sorting-skewness and (b) skewness-kurtosis of sediment cores. Circles are Myeonji samples and squares are
Eulsuk samples. When the sediment becomes better sorted, skewness and kurtosis decreased.
environments using Y1(Aeolian/beach), Y2(beach/shallow agitated marine), Y3(shallow agitated marine/fluvial), and Y4(fluvial/turbidity). The variation in the energy and fluidity factors is low under aeolian processes and high in a turbid current environment. Fig. 3 shows the LDF result for the samples.
Sediment cores collected at Myeongji tidal flat (MJ01, MJ02, and MJ03) showed increased variation of energy and fluidity in the upper part (beach/shallow marine/fluvial/turbidity) and decreased fluctuation of energy and fluidity in the lower part (aeolian/shallow marine/shallow marine/fluvial) (Fig. 3a, b), indicating that an energy regime shift occurred at a depth of 15 cm with a change from less energy fluctuation to more energy fluctuation. This might be the result of construction of the West gate, which is similar to the statistical parameters for grain size. This indicates that before installation of the West gate, there was no energy fluctuation and the predominant energy source to Myeongji tidal flat would be wave and tidal currents, because of the absence of direct river discharge to the West Eulsuk Channel (Williams et al., 2013; MOE, 2015).
Since construction of the West gate, however, Myeongji tidal flat has experienced energy and fluidity fluctuations due to
dam discharge from the West gate. In comparison, the sediment cores collected at the Eulsuk tidal flat all showed different patterns (Fig. 3c, d). ES12 showed greater energy fluctuation at every depth, while ES05 showed a similar pattern to cores collected in Myeongji tidal flat, more energy and fluidity fluctuations at the upper part and less fluctuation at the lower part. ES11 showed a mixed pattern. This might be because of floodgate operation patterns, which give results similar to the statistical parameters of grain size.
In this study, the mud content and dam discharge showed a good relationship. ES12, which is influenced by consistent discharge from the East gate, had high mud content. At Myeongji tidal flat, after installation of the West gate, the mud supply and deposition were increased due to direct discharge to the West Eulsuk Channel, corresponding to previous studies;
engineered estuaries such as the Nakdong Estuary are supplied materials, including mud, via dam discharge (Oyedotun, 2016) and the sediment flux of the Nakdong Estuary is mainly controlled by dam discharge (Williams et al., 2015). Greater water and mud discharges resulted in sediments that are more poorly sorted, finer skewed, and more leptokurtic in the Nakdong Estuary
(a) (b)
(c) (d)
Fig. 3. Plots showing the result of LDF for the samples. Circles are Myeonji samples and squares are Eulsuk samples.
(Fig. 2). In addition, Williams et al. (2013) reported that the energy regime of the Nakdong Estuary is determined by floodgate operations and is reflected in the LDF results (Fig. 3).
3.2. Elemental distributions in sediment cores (Eulsuk tidal flat)
As mentioned above, sites ES05 and ES11 had different sediment structures due to their geographical conditions (Fig. 1).
In both sediment cores, elemental distributions were identified
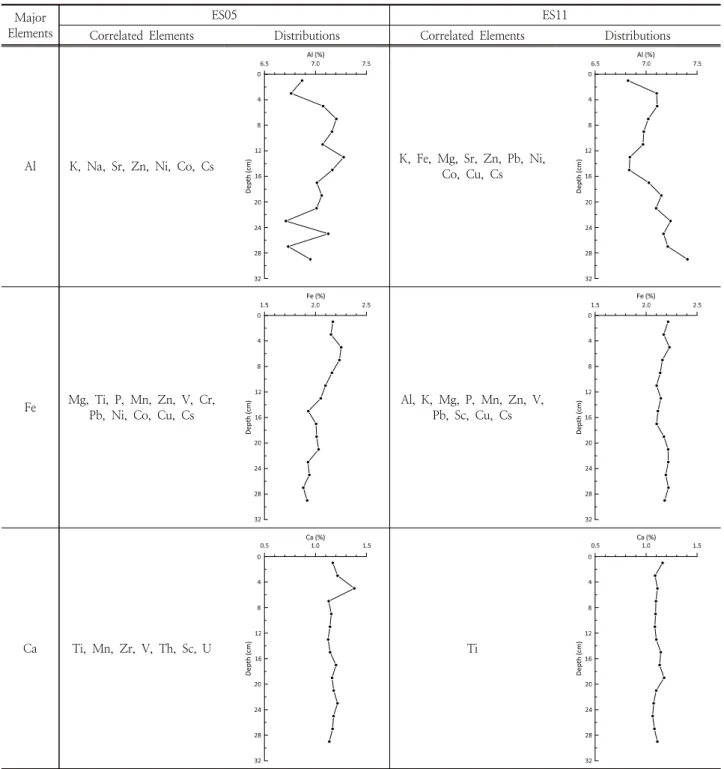
based on Pearson correlation analysis performed using SPSS (ver. 20.0; SPSS Inc., Chicago, IL, USA), which was based on standardized values (Z-scores); thus the results were not influenced by differences in elemental magnitude or measurement scales (Kang et al., 2016). In Table 1, the distribution patterns of Al, Fe, and Ca are shown together with correlated elements; the observed distribution of major elements in both sediment cores illustrates the grain size and mineral fractionation processes (Koukina et al., 2017). The
Table 1. Summary of positive correlated elements with Al, Fe, and Ca respectively in ES05 and ES11, together with the distribution patterns of Al, Fe, and Ca
Major Elements
ES05 ES11
Correlated Elements Distributions Correlated Elements Distributions
Al K, Na, Sr, Zn, Ni, Co, Cs
Depth (cm)
K, Fe, Mg, Sr, Zn, Pb, Ni,
Co, Cu, Cs
Depth (cm)
Fe Mg, Ti, P, Mn, Zn, V, Cr, Pb, Ni, Co, Cu, Cs
Depth (cm)
Al, K, Mg, P, Mn, Zn, V,
Pb, Sc, Cu, Cs
Depth (cm)
Ca Ti, Mn, Zr, V, Th, Sc, U
Depth (cm)
Ti
Depth (cm)
minerals) fluctuated around ~7.0% in both cores. The positive correlations of K and Na with Al imply the presence of Na- and K-aluminosilicates. Therefore, a terrigenous source is indicated by increased Al content, because Al and K mainly have a lithogenic origin, being derived from weathering and erosion of rock and soil parent materials (Zhao et al., 2017).
However, the distribution of Fe shows an upward increasing pattern, especially after construction of the West gate (depth of ~15 cm), which is more obvious in site ES05 than ES11.
The strong positive correlation of Fe and Mg (0.77 < r < 0.95, p ≤ 0.001), together with P, Mn, Zn, V, Co, and Cs, suggests an association with the ferromagnesium silicates and, possibly, clay minerals, which constitute the bulk of the fine-grained sediments (Koukina et al., 2017). Similarly, the mean grain size (Mz) also showed an upward-fining pattern due to the silt- and clay-sized materials in sediment cores (Kim et al., 2019). Therefore, the distributions of Al and Fe, and their associated element profiles (Table 1), represent the compositions of host minerals, such as Na- and K-aluminosilicate (e.g., albite, microcline, and orthoclase), and ferromagnesium silicates (e.g., hornblende), as well as the sedimentary environments of transitional waters where mixed-sized sediments (including silt and clay minerals) are formed (Koukina et al., 2017).
On the other hand, the distribution of Ca shows little variation in sediment cores and has a strong positive correlation with Ti (0.48 < r < 0.82, p < 0.1) (Table 1). In addition, positive correlations of Ca with Zr (r = 0.55, p < 0.05), V (r = 0.54,
core. In a previous study (Kim et al., 2019), sediment facies of ES05 and ES11 cores were sand-dominated, comprising over 80% sand. Thus, the coarsest river material enriched in detrital minerals could be deposited at sites ES05 and ES11. This indicates that sediment grain size cannot fully account for the abundance and distribution of elements in the studied sediments.
3.3. Factors controlling the elemental distribution in sediments (Eulsuk tidal flat)
The association between REEs in sediment has been attributed to sorption to major minerals, including Fe (oxyhydroxides and aluminosilicates), Al (aluminosilicates), Mn (oxyhydroxides), and P (feldspar and amphibole groups) (Dubinin and Strekopytov, 2001; Kang et al., 2014; Koukina et al., 2017). Thus fractionation of the REE group is used as index to illustrate the sedimentary environment (e.g., Xiaoyu et al., 2012; Kang et al., 2016).
The total REE content and fractionation indices (La/Yb)
UCC
(upper continental crust-normalized La/Yb ratio), (Gd/Yb)
UCC
(upper continental crust-normalized Gd/Yb ratio), (Ce/Ce*)
UCC
(Ce-anomaly, CeUCC
/[0.5 × (LaUCC
+ PrUCC
)]), and (Eu/Eu*)UCC
(Eu-anomaly, EuUCC
/0.5 × [SmUCC
+ GdUCC
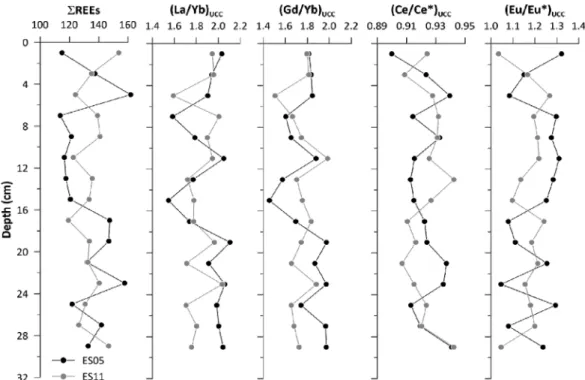
]) of ES05 and ES11 are shown in Fig. 4. Both stations had similar ranges of the total REE content (average 132 [range 114–162]mg/kg for ES05 and average 134 [range 119–154] mg/kg for ES11). This is likely associated with the dominant sandy
Fig. 4. The distribution of total REEs and REEs fractionation indices in the sediment cores. The black circles means ES05 and the grey
circles means ES11.
fractions in both sediment cores (Fig. 2 in Kim et al., 2019), although there are different distribution patterns between sediment cores. The (La/Yb)
UCC
and (Gd/Yb)UCC
fractionation ratios show a similar pattern in each sediment core. The sediments had ranges of 1.84–1.90 and 1.74–1.79, respectively, indicating relatively light REE enrichment and heavy REE depletion; this is consistent with those of other Korean river sediments (e.g., the Han, Geum, and Yeongsan rivers) (Song and Choi, 2009; Jung et al., 2012). The cerium fractionation ([Ce/Ce*]UCC
) in both cores ranged from 0.90 to 0.94, a slightly negative Ce-anomaly (< 1), in common with Korean river sediments (Song and Choi, 2009). However, the europium fractionation ([Eu/Eu*]UCC
) showed a positiveanomaly (range 1.03–1.32, > 1) in both sediment cores.
Therefore, the distributions of the total REEs and REE fractionation indices indicate that the sites have been influenced by different sedimentation mineralogies that could affect REE abundance and fractionation (Jung et al., 2012).
To investigate general aspects of the chemical associations, principal component analysis (PCA) was applied to the chemical compositions (major, minor, and total REEs), including the REEs fractionation indices ([La/Yb]
UCC
, [Gd/Yb]UCC
, [Ce/Ce*]UCC
, and [Eu/Eu*]UCC
). At site ES05, the first three principal components accounted for 70% of the variability in the data (Table 2). PC1 had positive loadings for Al, Fe, Mg, Mn, Ti, P, Co, Cr, Cu, Ni, V, Zn, Cs, Pb, Sc, and theTable 2. Mineralogy effect on chemical composition in ES05 and ES11, based on principal component analysis including sediment texture
and REE fractionation indices
ES05 ES11
PC1 PC2 PC3 PC1 PC2 PC3 PC4
Variance explained 30.7 24.0 15.0 28.0 20.9 13.7 8.1
Sand -0.031 0.108 -0.839 -0.002 -0.798 -0.192 -0.081
Silt -0.010 -0.106 0.816 0.001 0.773 0.248 0.048
Clay -0.100 -0.110 0.871 0.004 0.820 0.099 0.134
Al 0.490 -0.285 -0.751 0.727 0.118 0.577 0.118
Ca 0.129 0.863 0.102 -0.603 0.106 0.184 0.040
Fe 0.908 0.184 0.112 0.468 0.694 0.228 0.042
K 0.079 -0.279 -0.587 0.188 0.440 0.598 -0.477
Mg 0.916 -0.029 0.033 0.740 0.326 0.357 -0.229
Mn 0.516 0.287 0.637 -0.131 0.788 -0.257 0.012
Na -0.134 -0.171 -0.817 0.261 0.190 0.385 -0.166
Ti 0.342 0.855 0.273 -0.363 0.725 -0.289 0.217
P 0.465 0.168 0.610 -0.095 0.497 0.075 0.323
Sr -0.345 0.120 -0.773 0.137 0.145 0.760 0.303
Co 0.862 -0.306 -0.034 0.919 -0.108 -0.241 -0.065
Cr 0.804 0.366 0.273 0.382 -0.030 -0.704 0.166
Cu 0.737 0.030 0.263 0.907 0.134 -0.152 0.023
Li 0.080 -0.027 -0.336 0.743 -0.223 -0.131 -0.320
Ni 0.902 -0.192 -0.158 0.854 -0.184 -0.093 -0.058
V 0.685 0.598 0.228 0.209 0.899 0.032 0.204
Zn 0.915 -0.253 -0.038 0.712 0.375 0.380 0.011
Zr 0.290 0.529 0.308 0.003 0.118 -0.824 0.070
Cs 0.928 -0.190 -0.007 0.785 0.249 0.475 -0.098
Pb 0.614 0.223 0.050 0.776 0.328 0.219 0.002
Th -0.262 0.609 -0.157 0.147 0.167 -0.389 0.628
U -0.054 0.815 -0.122 0.301 0.134 -0.631 0.479
Sc 0.407 0.740 0.164 0.347 0.723 0.036 0.291
Total REEs -0.359 0.858 0.086 -0.182 0.338 0.039 0.825
Ce-anomaly -0.313 0.602 -0.291 -0.293 0.282 -0.211 0.280
Eu-anomaly 0.382 -0.754 -0.202 0.208 -0.285 0.177 -0.809
(La/Yb)
UCC-0.497 0.120 0.401 -0.126 -0.450 0.270 0.544
(Gd/Yb)
UCC-0.515 0.295 0.453 -0.166 -0.732 0.083 0.414
(La/Yb)
UCC
, (Gd/Yb)UCC
, and the Ce-anomaly. As these are analyses of estuarine sediments influenced by river discharge flows, this likely reflects riverine transport of detrital minerals, as mentioned in Section 3.2. Some minor elements could be derived from lithogenic sources bound in aluminosilicates (e.g., Zhao et al., 2017). In addition, the positive Eu-anomalies could be explained by the adsorption chemistry of Eu; Eu has a higher hydroxide binding constant than those of Gd and Sm (Hannigan et al., 2010). PC2 had positive loadings for Ca, Ti, Cr, V, Zr, Th, U, Sc, total REEs, and the Ce-anomaly, indicating that heavy mineral components such as Th-bearing monazite ([Ce, La, Nd, Th]PO4
) and Ti-bearing sphene (CaTiSiO5
) likely affect the REE contents in the sandy sediments of the study area (Jung et al., 2012). PC3 was dominated by large positive loadings for silt and clay and negative loading for sand, indicating the sedimentary grain-size component.In addition, Mn and P content increases at positive loading scores, together with Na- and K-aluminosilicate at negative loading scores; this indicates that they are associated with fine-grained marine sediments (e.g., in the form of easily soluble amorphous Mn) (Koukina et al., 2017).
At site ES11, 70% of the total variance was in the first four principal components (Table 2). PC1 had positive loadings for Al, Fe, Mg, Cr, Cu, Li, Ni, Zn, Cs, Pb, and Sc as at site ES05, indicating riverine discharge flow. PC2 indicated the sedimentary grain-size component based on positive loadings for silt and clay, together with Fe, K, Mg, Mn, Ti, P, V, Zn, Pb, Sc, and total REEs, and negative loading for sand. In this component, fine-grained sediments are an important carrier of various elements due to the deposition of material with different grain sizes determined by the hydrodynamic conditions of the water mixing zone. PC3 had positive loadings for Al, K, Mg, Na, Sr, Zn, and Cs, and negative loadings for Cr, Zr, Th, and U. The distribution of Na and K is controlled by the Na- and K-aluminosilicate content. The Zr content is most likely associated with Zr-rich minerals, such as zircon.
Therefore, this component could be explained by mineral fractionation processes. PC4 was dominated by large positive loadings for total REEs and Th, which reflects heavy minerals, such as monazite enriched in REEs (Jung et al., 2006).
Consequently, detrital minerals including aluminosilicates mainly influenced the elemental compositions at ES05, which likely diluted the REE contents. However, clay minerals and Fe-oxyhydroxides, as well as REE-enriched heavy minerals, appear to be controlling factors of the elemental composition at ES11. Therefore, the PCA indicates that the mineral fractionation process is important for determining the elemental composition during sedimentation, which fluctuates and reflects
both sites.
4. Conclusions
The sediment structure of tidal flats, including
S. planiculmis
habitat in the Nakdong Estuary, reflects hydrodynamic changes.In sediment cores mainly composed of coarse particles, the LDF suggests that the depositional environments have undergone an energy regime shift and upward increase in show energy fluctuation, which results in more poorly sorted, finer skewed, and more leptokurtic environments due to floodgate operation. This depositional condition of riverine–saline water could affect the abundance and distribution of elements. Based on the PCA of sites ES05 and ES11, a more dynamic sedimentary environment likely occurred at ES11, judging from the complicated chemical composition due to mineralogical and grain-size effects, which probably constrain the formation of
S. planiculmis
habitat compared to site ES05.Acknowledgments
This study was supported by Korea Institute of Ocean Science and Technology (KIOST) under the research program entitled
‘A Study on the Integrated Management of Marine Space’.
The authors would like to thank the anonymous reviewers for their constructive comments.
References
An, S, Lee, J and Jeong, S (2006). Seasonal biomass and carbon, nitrogen contents change of
Schoenoplectus trigueter
in Nakdong river estuary,Journal of Wetlands Research
, 8(3), pp. 39-49. [Korean literature]Barusseau, JP, Bǎ, M, Descamps, C, Diop, ES, Diouf, B, Kane, A, Saos, JL and Soumare, A (1998). Morphological and sedimentological changes in the Senegal River estuary after the construction of the Diama dam,
Journal of African Earth Sciences
, 26(2), pp. 317-326. [DOI:https://doi.org/10.1016/S0899-5362(98)00014-1]
Blott, SJ and Pye, K (2001). GRADISTAT: a grain size distribution and statistics package for the analysis of unconsolidated sediments,
Earth surface processes and Landforms
, 26(11), pp. 1237-1248. [DOI:https://doi.org/10.1002/esp.261]
Busan Metropolitan City (2014).
Monitoring of Bolboschoenus planiculmis at restored sites on Eulsuk Island
. [Korean literature]Dora, GU, Kumar, VS, Philip, CS, Johnson, G, Vinayaraj, P
and Gowthaman, R (2011). Textural characteristics of foreshore sediments along Karnataka shoreline, west coast of India,
International Journal of Sediment Research
, 26(3), pp. 364-377. [DOI: https://doi.org/10.1016/S1001- 6279(11)60100-5]Duane, DB (1964). Significance of skewness in recent sediments, western Pamlico Sound, North Carolina,
Journal of Sedimentary Research
, 34(4), pp. 864-874. [DOI:https://doi.org/10.1306/74D711B8-2B21-11D7-86480 00102C1865D]
Dubinin, AV and Strekopytov, SV (2001). Behavior of rare earth elements during leaching of the oceanic sediments,
Geochemistry International
, 39, pp. 692-701.Folk, RL and Ward, WC (1957). Brazos River bar [Texas];
a study in the significance of grain size parameters,
Journal of Sedimentary Research
, 27(1), pp. 3-26. [DOI:https://doi.org/10.1306/74d70646-2b21-11d7-864800 0102c1865d]
Gao, JH, Li, J, Wang, H, Bai, FL, Cheng, Y and Wang, YP (2012). Rapid changes of sediment dynamic processes in Yalu River Estuary under anthropogenic impacts,
International Journal of Sediment Research
, 27(1), pp.37-49. [DOI: https://doi.org/10.1016/s1001-6279(12) 60014-6]
Hannigan, R, Dorval, E and Jones, C (2010). The rare earth element chemistry of estuarine surface sediments in the Chesapeake Bay,
Chemical Geology
, 272, pp. 20-30. [DOI:https://doi.org/10.1016/j.chemgeo.2010.01.009]
Irudhayanathan, A, Thirunavukkarasu, R and Senapathi, V (2011). Grain size characteristics of the Coleroon estuary sediments, Tamilnadu, East coast of India,
Carpathian Journal of Earth and Environmental sciences
, 6(2), pp.151-157.
Jung, HS, Lim, DI, Yang, SY and Yoo, HS (2006). Constraints of REE distribution patterns in core sediments and their provenance, Northern East China Sea,
Economic and Environmental Geology
, 39, pp. 39-51. [Korean literature]Jung, HS, Lim, D, Choi, JY, Yoo, HS, Rho, KC and Lee, HB (2012). Rare earth element compositions of core sediments from the shelf of the South Sea, Korea: their controls and origins,
Continental Shelf Research
, 48, pp.75-86. [DOI: https://doi.org/10.1016/j.csr.2012.08.008]
Kang, J, Jeong, KS, Cho, JH, Lee, JH, Jang, S and Kim, SR (2014). Post-depositional redistribution processes and their effects on middle rare earth element precipitation and the cerium anomaly in sediments in the South Korea Plateau, East Sea,
Journal of Asian Earth Sciences
, 82, pp. 66-79. [DOI: https://doi.org/10.1016/j.jseaes.2013.11.019]
Kang, J, Woo, HJ, Jang, S, Jeong, KS, Jung, HS, Hwang, HG, Lee, JH and Cho, JH (2016). Rare earth element fingerprints
in Korean coastal bay sediments: association with provenance discrimination,
Ocean Science Journal
, 51, pp.305-316. [DOI: https://doi.org/10.1007/s12601-016- 0027-7]
Kim, GY, Lee, CW, Yoon, HS and Joo, GJ (2005). Changes of Distribution of Vascular Hydrophytes in the Nakdong River Estuary and Growth Dynamics of
Schenoplectus triqueter
, Waterfowl Food Plant,The Korean Journal of Ecology
, 28(5), pp. 335-345. [Korean literature, DOI:https://doi.org/10.5141/JEFB.2005.28.5.335]
Kim, GY, Kim, JY, Ganf, GG, Lee, CW and Joo, GJ (2013).
Impact of over-wintering waterfowl on tuberous bulrush (
Bolboschoenus planiculmis
) in tidal flats,Aquatic Botany
, 107, pp. 17-22. [DOI: https://doi.org/10.1016/j.aquabot.2013.01.004]
Kim, SY and Ha, JS (2001). Sedimentary facies and environmental changes of the Nakdong river estuary and adjacent coastal area,
Korean Journal of Fisheries and Aquatic Sciences
, 34(3), pp. 268-278. [Korean literature]Kim, TI, Choi, BH and Lee, SW (2006). Hydrodynamics and sedimentation induced by large-scale coastal developments in the Keum River Estuary, Korea, Estuarine,
Coastal and Shelf Science
, 68(3-4), pp. 515-528. [DOI:https://doi.org/10.1016/j.ecss.2006.03.003]
Kim, WH and Lee, HH (1980). Sediment transport and deposition in the Nakdong Estuary. Korea.
Journal of the Geological Society of Korea
, 16(3), pp. 180-188. [Korean literature]Kim, Y and An, S (2017). The Impact of Nakdong Estuarine Barrage on Distribution of Biogenic Silica (BSi) in Surface Sediment,
The Sea
, 22(4), pp. 172-186. [Korean literature, DOI: https://doi.org/10.7850/jkso.2017.22.4.172]Kim, Y, Kang, J, Choi, JU, Park, CM and Woo, HJ (2019).
Geochemical Characteristics of
Scirpus planiculmis
Habitats in Nakdong Estuary, Korea,Journal of Wetlands Research
, 21(2), pp. 125-131. [Korean literature, DOI:https://doi.org/10.17663/JWR.2019.21.2.125]
Koukina, SE, Lobus, NV, Peresypkin, VI, Dara, OM, Smurov, AV (2017). Abundance, distribution and bioavailability of major and trace elements in surface sediments from the Cai River estuary and Nha Trang Bay (South China Sea, Vietnam),
Estuarine
,Coastal and Shelf Science
, 198, pp. 450-460. [DOI: https://dx.doi.org/10.1016/j.ecss.2016.03.005]
Lee, J, Kwon, BO, Kim, B, Noh, J, Hwang, K, Ryu, J, Park, J, Hong, S and Khim JS (2019) Natural and anthropogenic signatures on sedimentary organic matters across varying intertidal habitats in the Korean waters,
Environment International
, 133, pp. 105166. [DOI: https://doi.org/10.1016/j.envint.2019.105166]
Lee, YD (1993). A study on the characteristics of submarine
Nakdong River Estuary, Korea,
Journal of the Korean earth science society
, 14(1), pp. 67-67. [Korean literature]McLaren, P and Bowles, D (1985). The effects of sediment transport on grain-size distributions,
Journal of Sedimentary Research
, 55(4), pp. 457-470. [DOI:https://doi.org/10.1306/212f86fc-2b24-11d7-8648000 102c1865d]
Ministry of Environment (2015).
Brackish area survey in the Nakdong estuary (‘13~‘15)
. [Korean literature]Ministry of Oceans and Fisheries (2014).
The Korean Standard Methods for Marine Environment
. [Korean literature]Oh, GH (1999). Landform changes of terminal area of the Nagdong river delta, Korea,
The Korean Journal of Quaternary Research
, 13(1), pp. 67-78. [Korean literature]Oyedotun, TDT (2016). Sediment characterisation in an Estuary-beach system,
Journal of Coastal Zone Management
, 19(3), pp. 1-7. [DOI: https://doi.org/10.4172/2473-3350.1000433]
Rajganapathi, VC, Jitheshkumar, N, Sundararajan, M, Bhat, KH and Velusamy, S (2013). Grain size analysis and characterization of sedimentary environment along Thiruchendur coast, Tamilnadu, India,
Arabian Journal of Geosciences
, 6(12), pp. 4717-4728. [DOI:https://doi.org/10.1007/s12517-012-0709-0]
Sahu, BK (1964). Depositional mechanisms from the size analysis of clastic sediments,
Journal of Sedimentary Research
, 34(1), pp. 73-83. [DOI: https://doi.org/10.1306/74d70fce-2b21-11d7-8648000102c1865d]
Song, YH and Choi, MS (2009). REE geochemistry of fine-grained sediments from major rivers around the Yellow Sea,
Chemical Geology
, 266, pp. 328-342. [DOI:https://doi.org/10.1016/j.chemgeo.2009.06.019]
Wiilams, JR, Dellapenna, TM and Lee GH (2013). Shifts in
anthropogenic alterations Nakdong Estuary, South Korea,
Marine Geology
, 343, pp. 47-61. [DOI: https://doi.org/10.1016/j.margeo.2013.05.010]
Williams, J, Dellapenna, T, Lee, GH and Louchouarn, P (2014).
Sedimentary impacts of anthropogenic alterations on the Yeongsan Estuary, South Korea,
Marine Geology
, 357, pp. 256-271. [DOI: https://doi.org/10.1016/j.margeo.2014.08.004]
Williams, J, Lee, GH, Shin, HJ and Dellapenna, T (2015).
Mechanism for sediment convergence in the anthropogenically altered microtidal Nakdong Estuary, South Korea,
Marine Geology
, 369, pp. 79-90. [DOI:https://doi.org/10.1016/j.margeo.2015.08.004]
Yi, YM, Yeo, US, Oh, DH and Sung, K (2011). Annual Changes in
Scirpus planiculmis
and Environmental Characteristics of the Nakdong River Estuary,Journal of Wetlands Research
, 13(3), pp. 567-579. [Korean literature, DOI:https://doi.org/10.17663/JWR.2011.13.3.567]
Yoon, EC and Lee, JS (2008). Characteristics of seasonal variation to sedimentary environment at the estuary area of the Nakdong,
Journal of Korean Society of Coastal and Ocean Engineers
, 20(4), pp. 372-389. [Korean literature]Zhang, X, Zhang, F, Chen, X, Zhang, W and Deng, H (2012).
REEs fractionation and sedimentary implication in surface sediments from eastern South China Sea,
Journal of Rare Earth
, 30, pp. 614-620. [DOI: https://doi.org/10.1016/S1002-0721(12)60100-8]
Zhao, G, Ye, S, Yuan, H, Ding, X and Wang, J (2017). Surface sediment properties and heavy metal pollution assessment in the Pearl River Estuary, China,
Environmental Science and Pollution Research
, 24, pp. 2966-2979. [DOI:https://doi.org/10.1007/s11356-016-8003-4]