Vol. 17, No. 11 pp. 682-690, 2016
품목별 주요 브랜드를 활용한 농산물 브랜드자산의 구성요인에 관한 연구
최돈우1, 김태균2, 임청룡3*
1경상북도 농업기술원, 2경북대학교 농업경제학과, 3연변대학교 농림경제관리학과
Study on Structural Factors of Agricultural Product Brand Equity Utilizing Major Brand by Item
Don-Woo Choi
1, Tae-Kyun Kim
2, Qing-Long Lin
3*1
Gyeongsangbuk-do Agricultural Research & Extension Services
2
Dept. of Agricultural Economics, Kyungpook National Univ.
3
Dept. of Agricultural and Forestry Economic Management, Yanbian Univ.
요 약 농산물 브랜드는 양적인 성장은 이루었지만 질적인 성장이 미미한 현실에 대안을 제시하기 위해 본 논문에서는 농산 물 브랜드자산의 구성요인을 발굴하고, 구성요인들이 브랜드자산에 미치는 영향을 계량적으로 분석하였다. 분석을 위해 소비 자들에 대한 구조화된 설문지를 활용하여 통계분석에 사용하였으며, 주요 분석결과를 요약하면 다음과 같다. 첫째, 브랜드 및 브랜드자산 관련 다양한 선행연구들을 중심으로 농산물 브랜드자산 구성요인에 대한 이론적 검토를 진행하였으며, 농산 물 브랜드자산의 구성요인을 인지도, 품질력, 충성도로 설정하였다. 둘째, 농산물 브랜드자산의 세부 구성요인에 대해 요인분 석 결과 인지도는 친숙도, 최초상기도, 일반적 인지도, 보조인지도, 회자정도, 로고기억정도, 품질력은 품질 지속성, 품질 신뢰 성, 품질 안전성, 전반적 품질정도, 가격대비 품질 우수성, 충성도는 주위권유, 구매의도 가격프리미엄, 재구매의향이 선정되 었다. 셋째, 농산물 브랜드자산에 미치는 요인에 대한 영향력을 분석한 결과 인지도, 품질력, 충성도 수준 모두 1% 유의수준 에서 통계적으로 유의하게 나타나 해당 수준이 높아질수록 브랜드자산이 증가하는 것으로 분석되었다. 넷째, 표준화계수를 활용한 브랜드자산에 가장 큰 영향을 주는 구성요인은 쌀과 조미채소는 품질력의 표준화계수가 각각 0.486와 0.581로 제일 높에 나타났고, 과수와 과채는 충성도가 각각 0.536과 0.490으로 가장 높게 분석되었다. 최종적으로 작목에 따른 브랜드 육성 정책에 있어서 인지도, 품질력 및 충성도 측면으로부터 접근한 다양한 정책을 개발하는 것이 효과적인 결과를 유발할 수 있으며, 쌀과 조미채소는 정책적 주안점을 품질력제고 관련 정책에 집중하고, 과수와 과채는 충성도제고 관련 정책에 보다 집중하는 것이 제한된 자원을 효율적으로 활용할 수 있는 방향이라고 할 수 있다.
Abstract In order to present a realistic alternative to agricultural product brands which achieve quantitative growth but minimal qualitative growth, this study attempted to identify the structural factors that affect the agricultural product brand equity and quantitatively analyze the effects of the structural factors on the brand equity. For the quantitative analysis, a survey was conducted among customers with a structured questionnaire. The major results of the analysis are as follows. First, the structural factors of the agriculture product brand equity were theoretically reviewed through many preceding studies in regard to the brand and brand equity. Awareness, quality and loyalty were selected as the structural factors of the agriculture brand equity. Second, when the sub-structural factors of the agriculture product brand equity were analyzed, it was found that awareness includes familiarity, first reminding level, general awareness, sub-awareness, frequency of reference and level of people's logo recollection. Quality includes quality consistence, quality reliability, quality stability, general quality and quality for price. Loyalty includes recommendation, purchase intention, cost premium and repurchase intention. Third, in the analysis of the factors of awareness, quality and loyalty were found to be statistically significant at the 1% level of significance, and it turned out that the higher the awareness, quality and loyalty, the higher the brand equity. Fourth, the factors most influencing the brand equity differed from those obtained using the standardized coefficients. The highest standardized coefficients of the factors on rice and condiment vegetables were those for quality with values of 0.486 and 0.581, respectively, and the highest standardized coefficients of the factors on fruits and fruit vegetables were those for loyalty with values of 0.536 and 0.490, respectively. Finally, it was found to be more effective to develop brand policies using an approach based on awareness, quality and loyalty by item. Also, focusing on enhancing the quality when developing brand policies for rice and vegetables, or focusing on enhancing loyalty when developing brand policies for fruit and vegetables was found to be more efficient using the limited resources.
Keywords : Agricultural Brand, Awareness, Brand Equity, Quality, Loyalty
본 논문은 농촌진흥청 연구사업(세부과제번호: PJ01141008)의 지원에 의해 이루어진 것임.*Corresponding Author : Qing-Long Lin(Yanbian Univ.) Tel: +82-53-950-5771 email: [email protected] Received August 8, 2016
Accepted November 10, 2016
Revised (1st September 28, 2016, 2nd October 12, 2016) Published November 30, 2016
1. 서론
국제 유가의 불안과 수입원자재 가격의 지속적인 상 승 및 국내 노동비용의 증가 등 원인으로 국내 농산물 생산비는 갈수록 증가하고 있는 반면, 한·미 FTA 발효에 이어 한·중 FTA 실질적인 체결 등으로 농산물 수입 장 벽은 갈수록 낮아지고 있다.
이런 대내외적인 경영 불안 요인을 해소하기 위해 기 초자치단체 등에서는 지역 특산물 육성을 통해 시장 확 보, 부가가치 창출 등을 위해 노력하고 있다. 이와 같은 지역 특산물 육성에는 브랜드가 매우 중요하며, 적합한 브랜드 개발에 노력하고 있다. 예를 들어 복분자를 무주 지역 특산물을 개발하기 위해 소비자 인지도 조사를 통 해 브랜드 개발[1], 부산 건어물의 부가가치를 제고하기 위해 부산의 시각적 이미지 개발[2], 농촌체험마을 방문 자 만족도에 농특산물 포장디자인의 영향 분석[3], 민박 농가의 농특산물 판매 제고를 위한 포장디자인 개선[4]
등이 있다.
국내 농축수산물 브랜드는 총 5,291개로 양적인 성장 은 이루었다[5]. 그러나 [6]에 따르면 소비자의 제품 구 매 시 브랜드의 중요도는 쌀 2.7%, 우유 12.3%, 구두 67.0%로 농산물의 브랜드 중요도가 상대적으로 낮다는 것을 알 수 있다. 이런 결과는 소비자의 농산물 브랜드에 대한 인지도가 낮다는 것을 반영한다.
브랜드 인지도를 높일 수 있는 방안을 마련한다면 지 역 특산물 육성에 기여할 것이다. 브랜드 인지도는 브랜 드자산의 한 구성요소이다[7]. 따라서 농산물 브랜드자 산의 구성요인을 분석하는 연구가 필요하다.
브랜드자산에 대한 개념은 여러 학자들에 의해 정의 되었다. [8]은 고객이 어떤 브랜드에 대하여 호감을 갖게 됨으로써 그 브랜드를 붙이고 있는 상품의 가치가 증가 된 부분이라고 하였고, [9]는 기능이 비슷한 대체 브랜드 를 비교하였을 때 소비자가 특정 브랜드의 구입을 위해 추가적으로 지불하고자 하는 화폐가치라고 정의하였다.
[10]은 소비자 측면에서 브랜드자산 가치는 브랜드의 마 케팅 활동에 대한 소비자의 반응에 대한 브랜드 지식이 미치는 차별화된 효과라고 하였다. 여러 선행연구의 결 과를 종합하여 보면, 브랜드자산이란 동일한 마케팅 노 력을 투입하더라도 그 브랜드의 존재로 인해 차별적 마 케팅효과(differential effect)를 유발함으로써 높은 경제 적 이익을 거둘 것으로 기대되는 자산이라고 정의될 수 있다.
브랜드자산 관련 국내연구는 [11-14]등과 같이 공산 품 관련 연구들은 다양한 측면으로 진행되고 있으나, 농 산물 관련 연구는 [15-17]등으로 제한적이다. 또한 이 들 농산물 관련 연구는 브랜드자산 가치를 추정하고 있 으나, 그 구성요인의 영향을 제시하지는 못하고 있다.
따라서 본 연구는 지역 특산물 육성을 위해 선행연구 에서 제시한 이론모형을 참고로 하여 농산물의 브랜드자 산에 영향을 미치는 구성요인을 설정하고, 이러한 구성 요인이 브랜드자산에 영향을 미치는 정도에 대해 계량적 으로 분석하고 한다.
2. 브랜드자산 구성요인 설정
2.1 브랜드자산의 구성요인
브랜드자산의 효과는 고객측면과 기업측면으로 나누 어 생각해 볼 수 있다. 먼저 고객측면에서는 우수한 품질 을 보증하고 사회적 자기표현의 수단이 됨으로 고객 구 매를 유도한다. 기업측면에서는 브랜드에 대한 고객의 우호적인 태도를 형성하고 기업성과로 연결되어 시장에 서 기업 가치를 극대화할 수 있다.
Author Structural Factors Features Broniardzyk and
Alba(1994) Brand extensibility Based on the market level according to the response of customers, it is a type easy to digitize and quantify Neslin and
Shoemaker(1983)
Price elasticity, price premium, sales, market share
Aaker(1991)
Brand loyalty, brand awareness, brand association, recognized
quality, proprietary assets Based on the awareness level of customers, it is difficult to quantify compared to market level Keller(1993) Brand awareness, brand
association Srivastava and
Shocker(1995) Brand intensity, brand value
* This table is reshaped using Shin(2006).
Table 1. Structural Factors of Brand Equity*
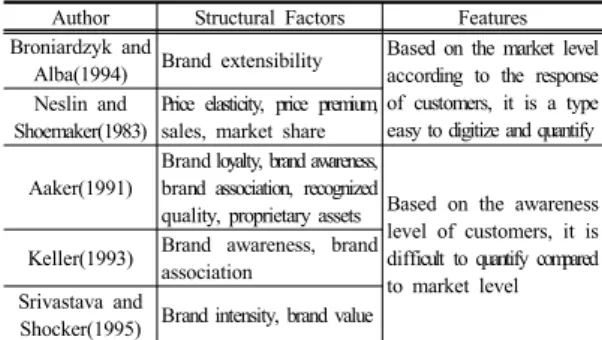
브랜드자산의 구성요인은 학자마다 다르게 해석하고 있다. [18]은 가격탄력성, 가격프리미엄, 매출액, 시장점 유율이라고 하였다. [7]은 브랜드 충성도, 브랜드 인지 도, 브랜드 연상, 지각된 품질, 기타 독점적 자산이라고 하였고, [19]는 브랜드 충성도, 브랜드 인지, 브랜드 연 상/이미지, 지각된 가치, 유통범위라고 하였으며, [20]은 지각적 측면-인지, 연상, 지각된 품질을 브랜드자산의 구 성요인이라고 하였다.
Companies Diagnosis Model Structural Factors of Brand Diagnosis Young & Rubicam Brand Asset Valuator awareness, relevance, evaluation level, differentiation,
Total Research EquiTrend specificity, quality, satisfaction Dentsu Brand Diagnosis, Cultivation
Program(D-BREED) brand management index, brand equity structure analysis, brand equity analysis The Landor
Associates Image Power Index awareness(subsidiary awareness), preference
Daiko ARENA BEARING relevance to customers, extensibility of customer base, appropriate activity for customer value change
KMA K-BPI awareness, loyalty(image, purchase likelihood, preference(satisfaction) Cheil Brand Value-Up Master awareness, quality, individual image, social image
Kumkang Diamond Brand Power
Index(DBPI) loyalty, quality, organization, character, price, leadership, recognized value LG Ad LG-BREMS brand equity(quality, appropriacy), brand, activity(product, advertisement)
Jungang Research CRC Model-BPI product and service image, price and A/S, shop image, company image, brand image, awareness
Korea Productivity
Center NBCI marketing activity, brand awareness, brand image, brand loyalty, relation construction, purchase intention
Interbrand Interbrand’s Brand Value Evaluation Model
leadership,brand stability, marketability, internationality, market trend, support activity(promotion costs, etc.), legal protection activity
The Institute of Industrial Policy
Studies
IPS Brand Asset Evaluator Awareness, recognized quality, brand association, other proprietary assets Table 2. Evaluation Model of Domestic and Foreign Brand Equity
[11]에서는 선행연구에서 많이 제시된 브랜드자산 구 성요인을 다음 Table 1과 같이 정리하였다[7, 10, 18, 19, 21].
브랜드자산의 구성요인에 대한 학문적 연구를 기초로 국내외 브랜드 자산가치 평가모델과 브랜드진단 구성요 소를 살펴보면 다음 Table 2와 같이 요약할 수 있다[11, 22].
2.2 농산물 브랜드자산의 구성요인 설정 농산물 브랜드자산의 구성요인이 브랜드자산에 미치 는 영향을 분석하기 위해서는 브랜드자산 평가방법에 대 한 우선적인 고찰이 필요하다. 브랜드자산의 평가는 다 양한 방법이 있지만 크게 장부기록을 활용한 재무적 접 근방법과 소비자를 대상으로 측정하는 마케팅적 접근법 으로 나눌 수 있다.
Evaluation
Index Operant Definition Source
Awareness Intensity of behavior that customers have in mind to a specific brand
Aaker(1991) Keller(1993)
Quality Subjective judgment that customers have on overall excellence of products
Zeithaml(1988) Aaker(1991)
Loyalty Level of satisfaction that customers have when using a certain brand
Aaker(1991) Oliver(1997) Table 3. Operant Definition of Evaluation Index of
Brand Equity Evaluation Model
재무적 접근법은 재무제표 등의 분석을 통한 브랜드 자산의 절대가치를 산출할 수 있는 장점이 있지만, 시장 과 소비자 특성 반영이 어려운 단점이 있으며, 마케팅적 접근법은 소비자/시장 특성이 반영된 상대적인 브랜드 가치를 창출할 수 있는 장점이 있는 반면 상대적 가치 산출에만 중점을 두어 절대 가치는 평가하기 어려운 단 점이 있다[11].
본 연구에서는 농산물 브랜드자산에 대한 재무적인 자료수집이 공산품 브랜드에 비해 어려움이 많고 측정이 어려우므로 구조화된 설문지를 통한 자료 수집을 통한 마케팅적 접근이 가능한 분석모형을 구축하고자 한다.
선행연구와 국내외 브랜드자산 평가모형을 참고하여 농 산물 브랜드자산의 구성요인을 Table 3과 같이 인지도 (Awareness), 품질력(Quality), 충성도(Loyalty)로 구성 하고자 한다. 인지도는 고객들의 마음속에 존재하는 특 정 브랜드에 대한 태도의 강도이며[7, 10], 품질력은 제 품의 전반적인 우수성에 대한 소비자의 주관적인 판단을 의미한다[23, 7]. 충성도는 이 브랜드를 사용함으로써 얼 마나 좋아하고 만족하고 있는지를 측정하는 정도이다[7, 24]
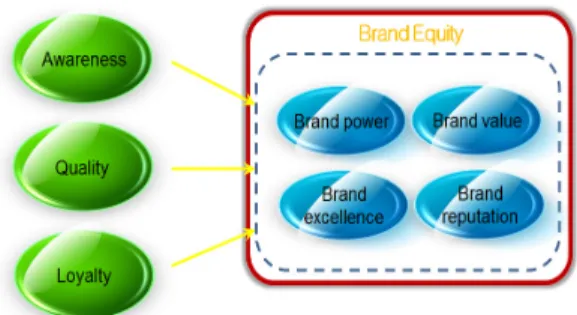
브랜드자산 가치는 브랜드 파워와 브랜드 가치를 내 포하므로[19]본 연구에서는 Figure 1과 같이 브랜드자산 측정에 브랜드 파워, 브랜드 가치, 브랜드 우수성, 브랜 드 정평성을 활용하였다.
Structural Factor Specific Factors Contents
Awareness
Level of first recall OO comes up in mind first.
Level of subsidiary awareness I am well aware of OO.
Level of remembering logo I will be able to remember LOGO or Symbol of OO.
Familiarity I am familiar with OO.
Level of general awareness OO is a well-known brand to others in general.
Level of talking among people OO is often mentioned in conversion among friends and family.
Quality
Level of overall quality OO has good quality in general.
Quality sustainability Quality of OO is sustainable.
Level of quality reliability OO has sustained its quality.
Level of quality stability Quality of OO is stable and hygienic.
Quality to price OO has good quality to price.
Loyalty
Repurchase intention I am willing to repurchase OO.
Price premium I am willing to purchase OO despite the higher price.
Purchase intention I am willing to purchase OO if purchasing.
Recommendation to others I would recommend OO to others.
Brand Equity
Brand value OO is a valuable brand.
Brand power OO has brand power.
Brand excellence OO is an excellent brand.
Brand reputation OO is a well-known brand.
Table 4. Specific Index of Brand Equity Evaluation Model by Structural Factor Fig. 1. Agricultural Brand Equity Evaluation Model
2.3 농산물 브랜드자산의 세부 구성요인 농산물 브랜드자산의 세부 구성요인은 선행연구를 참 고하여 Table 4와 같이 설정하였다. 인지도는 최초상기 도, 보조인지도, 로고기억정도, 친숙도, 일반적 인지도, 회자정도 등이고, 품질력은 전반적 품질정도, 품질 지속 성, 품질 신뢰성, 품질 안전성, 가격대비 품질우수성 등 이며, 충성도는 재구매의향, 가격프리미엄, 구매의도, 주 위권유 등이다. 그리고 브랜드자산을 평가를 위한 대리 변수로는 브랜드 파워, 브랜드 가치, 브랜드 우수성, 브 랜드 정평성를 사용하여 자료를 수집하였다.
3. 분석방법 및 자료
3.1 요인분석요인분석(factor analysis)은 변수들에 내재되어 있는 상관관계를 이용하여 요인을 구하고, 구한 요인들을 활 용하여 기존 변수들을 몇 개의 그룹으로 구분하여 그룹 별 적절한 의미를 부여하는 방법이며, 아래 식 (1)과 같 이 나타낼 수 있다.
× × × × (1) ×
식 (1)에서 ×은 관측 변수벡터를 나타내며,
×은 변수들의 평균을 나타내는 벡터를 나타낸다.
또한 ×은 요인 부하 행렬(factor loading matrix)이 며, ×는 공통인자(common factor) 벡터이며, ×
은 특정 인자(specific factor) 벡터로서 한정된 오차 변 동을 나타낸다(Richard and Wichern, 2007).
직접적인 관측이 불가능한 ×와 ×은 아래 와 같은 가정 하에서 추정하게 된다.
1) ×와 ×은 서로 독립이며, 2) , ,
3) , , 는 대각선 행렬
요인분석 모수추정에는 다양한 추정방식이 있으나, 이 연구에서는 최대우도방식을 사용하여 추정하고자 하 며, 좌표축 회전은 베리맥스(varimax)방식을 사용하고자 한다.
Variable N percentage Variable N percentage
Age
20-29 12 2.0
Sex male 279 46.5
female 321 53.5
30-39 138 23.0
Monthly Household
Income (KRW)
less than 2 million 48 8.0
40-49 180 30.0
2~3.99 million 232 38.7
50-59 165 27.5
4~5.99 million 245 40.8
60-69 105 17.5
Education
lower than high school 58 9.7 6~7.99 million 52 8.7
high school 270 45.0 8~9.99 million 14 2.3
university 249 41.5 10 million and higher 9 1.5
graduate 23 3.8 Total 600 100.0
Table 5. Basic Statistics of Socio-demographic Characteristics
3.2 브랜드자산 분석모형
브랜드 자산 는 잠재변수 성격을 띠고 있어 직접 적인 측정이 어려우므로 브랜드 자산을 대변할 수 있는 여러 문항들을 통해 간접적으로 측정하고자 하며, 다음 식 (2)와 같이 나타낼 수 있다. 여기에서 는 브랜드자 산 측정 세부문항행렬이며, 는 요인분석을 통해 도출 한 인자점수계수행렬(factor scoring coefficient matrix) 이다.
(2)
마찬가지 방법으로 브랜드자산의 세부 구성요인을 이 용하여 브랜드자산 구성요인의 잠재변수()들은 다음 식 (3)과 같이 구성할 수 있다. 여기에서 는 브랜드자 산 구성요인을 측정하기 위한 세부문항행렬이며, 는 인자점수계수행렬이다.
(3)
이 연구에서는 마케팅적 접근을 통해 브랜드자산을 측정함에 있어서 그 크기는 브랜드자산 구성요인과 응답 자 특성의 영향을 받으므로 다음 식 (4)와 같은 함수식 을 설정하였다.
(4)
식 (4)에서 는 응답자 특성변수행렬이고, 는 상호 독립되고 동일한 분포를 따르는 오차항 벡터이 다. 식 (4)의 함수형태를 선형으로 가정하면, 다음 식 (5) 와 같이 표현될 수 있다.
(5)
식 (5)에서
는 각각 브랜드자산 구성요인과 응답자 특성변수들에 대한 추정계수 벡터이며, 최소자승법을 활용하여 식 (5)를 추정한다.
3.3 자료
농산물 브랜드자산에 미치는 구성요인에 대한 영향력 을 분석하기 위해 서울지역 20대 이상 70대 이하 기혼 남녀를 대상으로 2013년 9월 2일부터 9월 13일까지 일 대일 면접방식으로 600명을 조사하였다.
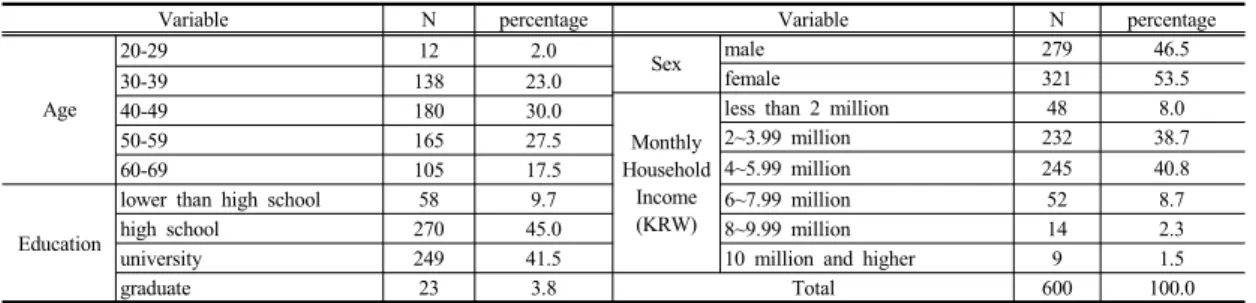
소비자 조사 표본의 특성은 Table 5와 같다. 연령은
“40대”가 180명으로 전체의 30.0%로 가장 많았으며, 다 음으로 “50대”(27.5%)로 조사되었으며, 성별 분포는
“여성”이 321명으로 전체의 53.5%로 “남성” 279명 보 다 높게 나타났다. 학력은 “고졸”이 270명으로 전체의 45.0%로 가장 높게 나타났으며, “대졸”이 249명으로 전 체의 41.5%로 두 번째로 높은 것으로 분석되었다. 월평 균 가구소득은 “400∼599만원”이 245명으로 전체의 40.8%로 가장 많았고 다음으로 “200∼399만원” 순으로 분석되었다.
농산물 브랜드자산 세부 구성요인 조사는 쌀, 과수, 과채, 조미채소 등의 부문별로 이루어졌으며, 세부 구성 요인은 1=“전혀 그렇지 않다”, 2=“그렇지 않다”, 3=“보 통이다”, 4=“그렇다”, 5=“아주 그렇다”와 같이 리커트 5 점 척도로 수집되었다.
4. 분석결과
4.1 브랜드자산 구성요인에 대한 요인분석 농산물 브랜드자산의 구성요인인 인지도, 품질력, 충 성도는 잠재변수 성격을 띠고 있으므로 직접적인 관측이 어렵다. 따라서 이런 구성요인들이 브랜드자산에 미치는 영향을 분석하기 위해 세부 구성요인에 대한 요인분석을
통해 각각의 점수를 구한 다음 브랜드자산에 미치는 영 향을 분석하고자 한다.
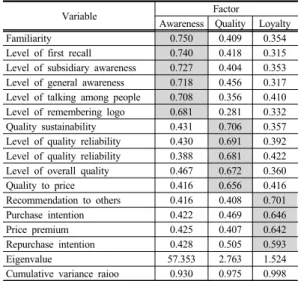
브랜드자산의 세부 구성요인 15개 항목에 대하여 베 리맥스 회전을 통한 최우추정 요인분석을 실행하였으며, 고유값을 기준으로 고유값이 1보다 큰 요인들을 추출하 였다. 분석결과 Table 6과 같이 KMO측도가 0.977로 나 타났고, Bartlett의 구형성 검정 카이제곱 값이 43,310으 로 1% 유의수준에서 통계적으로 유의하여 요인분석이 의미가 있음을 알 수 있다. 또한 자료의 내적일관성을 나 타내는 신뢰도분석 결과 크롬바하 알파 값이 0.976으로 아주 높게 나타났다.
인지도는 친숙도, 최초상기도, 보조인지도, 일반적 인 지도, 회자정도, 로고기억정도로 구성되었고, 품질력은 품질 지속성, 품질 신뢰성, 품질 안전성, 전반적 품질정 도, 가격대비 품질 우수성 등으로 구성되었으며, 충성도 는 주위권유, 구매의도 가격프리미엄 및 재구매의향 등 으로 구성되었다.
Variable Factor
Awareness Quality Loyalty
Familiarity 0.750 0.409 0.354
Level of first recall 0.740 0.418 0.315
Level of subsidiary awareness 0.727 0.404 0.353 Level of general awareness 0.718 0.456 0.317 Level of talking among people 0.708 0.356 0.410 Level of remembering logo 0.681 0.281 0.332
Quality sustainability 0.431 0.706 0.357
Level of quality reliability 0.430 0.691 0.392 Level of quality reliability 0.388 0.681 0.422 Level of overall quality 0.467 0.672 0.360
Quality to price 0.416 0.656 0.416
Recommendation to others 0.416 0.408 0.701
Purchase intention 0.422 0.469 0.646
Price premium 0.425 0.407 0.642
Repurchase intention 0.428 0.505 0.593
Eigenvalue 57.353 2.763 1.524
Cumulative variance raioo 0.930 0.975 0.998 Cronbach’s α: 0.976
KMO: 0.977
Bartlett test : 43,310 (P<0.01)
Table 6. Factor Analysis on the Specific Factors of
Brand Equity Evaluation
브랜드자산의 측정요인인 브랜드 우수성, 브랜드 정 평성, 브랜드 파워, 브랜드 가치 등 4개 항목에 대해 베 리맥스 회전을 통한 최우추정 요인분석 실행결과 Table 7과 같이 KMO측도가 0.874로 나타났고, Bartlett의 구 형성 검정 카이제곱 값이 11,751.8으로 1% 유의수준에
서 통계적으로 유의하며, 신뢰도분석 결과 크롬바하 알 파 값이 0.963으로 높게 나타났다. 브랜드 자산은 브랜 드 우수성, 브랜드 정평성, 브랜드 파워, 브랜드 가치로 표현될 수 있음을 알 수 있다.
Variable Factor
Brand Equity
Brand excellence 0.950
Brand reputation 0.949
Brand power 0.924
Brand value 0.906
Eigenvalue 28.673
Cumulative variance raioo 1.000
Cronbach’s α: 0.963 KMO: 0.874
Bartlett test : 11,751.8 (P<0.01)
Table 7.
Factor Analysis on the Brand Equity Measurement
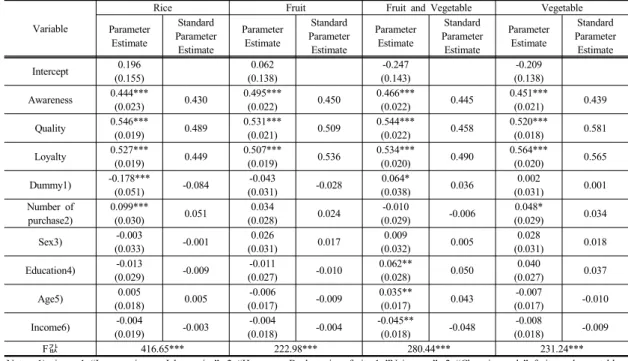
4.2 브랜드자산에 미치는 요인 영향력 분석 쌀, 과수, 과채류, 조미채소 등 부문별 브랜드자산에 미치는 요인에 대한 영향력을 분석한 결과는 Table 8과 같이 나타났다. 농산물 부문별 회귀모형 추정결과 F값이 모두 1% 유의수준에서 통계적으로 유의하게 나타나 모 든 모형이 통계적 의미를 가지고 있었으며, 4개의 추정 모형에서 인지도, 품질력, 충성도의 추정계수가 1% 유의 수준에서 통계적으로 유의한 것으로 나타났다. 이것은 농산물 부문을 막론하고 인지도, 품질력, 충성도에 대한 추정계수가 모두 양(+)으로 나타나므로 인지도, 품질력, 충성도가 증가하면 브랜드자산이 증가하게 됨을 알 수 있다.
부문에 따라 브랜드자산에 미치는 영향을 살펴보기 위해 더미변수를 도입하여 분석하였으며, 분석결과는 Table 9와 같이 나타났다. 쌀은 품목더미가 (-)로 1% 유 의수준에서 통계적으로 유의하게 나타났고, “임금님 표 이천쌀”이 “한눈에 반한쌀”보다 브랜드자산이 더 높음 을 알 수 있다. 과채류는 품목더미가 (+)로 10% 유의수 준에서 통계적으로 유의하게 나타났고, “성주참외”가
“논산딸기”보다 브랜드자산이 더 높은 것을 확인할 수 있었다.
브랜드 구입회수가 증가할수록 쌀과 조미채소의 브랜 드자산이 높아짐을 확인할 수 있다. 과채류는 교육수준 이 높을수록, 연령이 높을수록 브랜드자산을 높게 평가 하는 반면, 소득수준이 높을수록 브랜드자산을 낮게 평 가하는 것을 알 수 있다.
Variable
Rice Fruit Fruit and Vegetable Vegetable
Parameter Estimate
Standard Parameter Estimate
Parameter Estimate
Standard Parameter Estimate
Parameter Estimate
Standard Parameter Estimate
Parameter Estimate
Standard Parameter Estimate Intercept 0.196
(0.155)
0.062 (0.138)
-0.247 (0.143)
-0.209 (0.138) Awareness 0.444***
(0.023) 0.430 0.495***
(0.022) 0.450 0.466***
(0.022) 0.445 0.451***
(0.021) 0.439 Quality 0.546***
(0.019) 0.489 0.531***
(0.021) 0.509 0.544***
(0.022) 0.458 0.520***
(0.018) 0.581 Loyalty 0.527***
(0.019) 0.449 0.507***
(0.019) 0.536 0.534***
(0.020) 0.490 0.564***
(0.020) 0.565 Dummy1) -0.178***
(0.051) -0.084 -0.043
(0.031) -0.028 0.064*
(0.038) 0.036 0.002
(0.031) 0.001 Number of
purchase2)
0.099***
(0.030) 0.051 0.034
(0.028) 0.024 -0.010
(0.029) -0.006 0.048*
(0.029) 0.034
Sex3) -0.003
(0.033) -0.001 0.026
(0.031) 0.017 0.009
(0.032) 0.005 0.028
(0.031) 0.018 Education4) -0.013
(0.029) -0.009 -0.011
(0.027) -0.010 0.062**
(0.028) 0.050 0.040
(0.027) 0.037
Age5) 0.005
(0.018) 0.005 -0.006
(0.017) -0.009 0.035**
(0.017) 0.043 -0.007
(0.017) -0.010
Income6) -0.004
(0.019) -0.003 -0.004
(0.018) -0.004 -0.045**
(0.018) -0.048 -0.008
(0.018) -0.009
F값 416.65*** 222.98*** 280.44*** 231.24***
Note: 1) rice : 1=“Imgeumnimpyo Icheon rice”, 2=“Hannunae Banhan rice, fruit: 1=”Naju pear”, 2=“Chungju apple” fruits and vegetables:
1=“Nonsan strawberry”, 2 =“Seongju oriental melon, condiment vegetable: 1=“Changnyeong onion”, 2=“Miryang green chilli”
2) 1=“no purchase”, 2=“1~5 times per year”, 3=“6~10times per year”, 4=“11~20 times per years”, 5=“ over 20 times per year”
3) 1=“male”, 2=“female”
4) 1=“lower than high school”, 2=“high school”, 3=“university”, 4=“graduate”
5) 1=“20-29”, 2=“30-39”, 3=“40-49”, 4=“50-59”, 5=“60-69”
6) 1=“less 2 million”, 2=“2~3.99million”, 3=“4~5.99million”, 4=“6~7.99million”. 5=“8~9.99million”, 6=“10 million and higher”
( ) was standard error
***: p<0.01 ** : p<0.05 * : p<0.1
Table 8. Influence Analysis on the Factor of Brand Equity
또한 표준화계수로부터 품목에 따라 브랜드자산에 영 향을 미치는 요인이 상이한 것을 확인할 수 있었다. 쌀과 조미채소는 브랜드자산에 품질력이 가장 큰 영향을 미치 는 반면, 과수와 과채류는 충성도가 가장 큰 영향을 미치 는 것으로 분석되었다.
5. 요약 및 정책적 함의
본 논문은 농산물 브랜드자산의 구성요인을 발굴하 고, 이런 구성요인들이 브랜드자산에 미치는 영향을 계 량적으로 분석하였다. 계량분석을 위해 소비자들에 대한 구조화된 설문지를 활용하여 통계분석에 사용하였으며, 주요 분석결과를 요약하면 다음과 같다.
첫째, 브랜드 및 브랜드자산 관련 다양한 선행연구들 을 중심으로 농산물 브랜드자산 구성요인에 대한 이론적 검토를 진행하였으며, 농산물 브랜드자산의 구성요인을
인지도, 품질력, 충성도로 설정하였다.
둘째, 농산물 브랜드자산의 세부 구성요인에 대해 요 인분석 결과 인지도는 친숙도, 최초상기도, 일반적 인지 도, 보조인지도, 회자정도, 로고기억정도, 품질력은 품질 지속성, 품질 신뢰성, 품질 안전성, 전반적 품질정도, 가 격대비 품질 우수성, 충성도는 주위권유, 구매의도 가격 프리미엄, 재구매의향이 선정되었다.
셋째, 농산물 브랜드자산에 미치는 요인에 대한 영향 력을 분석한 결과 인지도, 품질력, 충성도 수준이 높아질 수록 브랜드자산이 증가하는 것으로 분석되었다.
넷째, 브랜드자산에 가장 큰 영향을 주는 구성요인은 쌀과 조미채소는 품질력이나, 과수와 과채는 충성도로 분석되었다.
인지도, 품질력 및 충성도 모두 브랜드 자산에 긍정적 인 역향을 미치므로 작목에 따른 브랜드 육성정책에 있 어서 인지도, 품질력 및 충성도 측면으로부터 접근한 다 양한 정책을 개발하는 것이 효과적인 결과를 유발할 수
있다. 또한 부문별 농산물 브랜드자산에 영향을 주는 구 성요인이 달라지므로 쌀과 조미채소는 정책적 주안점을 품질력제고 관련 정책에 집중하고, 과수와 과채는 충성 도제고 관련 정책에 보다 집중하는 것이 제한된 자원을 효율적으로 활용할 수 있는 방향이라고 할 수 있다.
본 연구에서는 부문별 대표 두 개 브랜드만 조사하여 대표성 논란이 있을 수 있으며, 농산물 품목별 고유 특징 을 반영한 분류기준 관련 추가적인 연구 및 보다 실효성 이 있는 브랜드자산 구성요소 선별 등과 같은 다양한 연 구가 필요하다.
References
[1] Y.M. Jun, Y.S. Ahn, O.S. An, M.H. Kim, “Brand Development for Rural Specialty Products - A Case Study of Bokbunja Drink in MuJu”, The Korean Journal of Community Living Science, vol. 18, no. 4, pp.
655-670, 2007.
[2] I.S. Shin, “A Study on the Package Design as Special Products of a Region
–
Focused on Dried Seafoods”, Journal of Korean Society of Design Science, vol. 20, pp. 219-229, 1997.[3] D.J. Park, H.H. Shin, S.G. Woo, “A Study on Improving Packaging Design for Farm · Specialty Purchase Satisfaction”, Journal of the Korean Society of Rural Planning, vol. 20, no. 4, pp. 157-164, 2014.
DOI: http://dx.doi.org/10.7851/ksrp.2014.20.4.157 [4] H.S. Chae, H.R. Jin, O.S. Ahn, 2012, “Improvement by
Survey Analysis on the Package Design for Agricultural Products of Farm Stay” Journal of the Korean Society of Rural Planning, vol. 18, no. 4, pp. 141-152, 2012.
DOI: http://dx.doi.org/10.7851/ksrp.2012.18.4.141 [5] Korea Agro-Fisheries Trade Corporation(aT) and
Ministry of Agriculture, Food and Rural Affairs, Brand Present Condition of Agricultural and Marine Products, 2011.
[6] Korea Small Business Institute, The Co-branding Project Activating for the SME Market Reclamation Products, 2004.
[7] D. Aaker, 1991, Managing Brand Equity: Capitalizing on the Value of a Brand Name, The Free Press, New York, 1991
[8] P.H. Farquhar, “Managing Brand Equity”, Marketing Research, vol. 1, no. 3, pp. 24-33, 1989.
[9] C.J. Simon, M.W. Sullivan, “The Measurement and Determinants of Brand Equity: A Financial Approach”, Marketing Science, vol. 12, no. 1, pp. 28-52, 1993.
DOI: http://dx.doi.org/10.1287/mksc.12.1.28
[10] K.L. Keller, “Conceptualizing, Measuring, and Managing Customer
-
Based Brand Equity”, Journal of Marketing, vol. 57, no. 1, pp. 1-22, 1993.DOI: http://dx.doi.org/10.2307/1252054
[11] C.H. Shin, “An Empirical Study on Evaluating Corporate Brand Asset Value: Applications of the Brand Asset Evaluator”, Journal of Product Research, vol. 24, no. 1, pp. 1-21, 2006.
[12] D.S. Park, M.S. Hwang, “A Study on the Determinants of Local Brand Assets and Local Competitiveness”, Journal of Business Research, vol. 22, no. 1, pp.
331-362, 2007.
[13] S.J. Yun, J. Woo, H.S. Park, “Relationship among Marketing Activities, Customer Equity and Brand Equity”, Korean Journal of Business Administration, vol.
19, no. 1, pp. 1-24, 2006.
[14] T.W., Chung, “An Analysis on Brand Power Index of Incheon International Airport”, The Journal of Shipping and Logistics, vol. 76, pp. 105-121, 2013
[15] Y.D. Kwon, “The Value of National and Local Brand Equity Assets and Brand Management of Rice, Apple and Beef”, Journal of Industrial Economics and Business, vol. 22, no. 4, pp. 1891-1909, 2009.
[16] S.H. Park, W.B. Kim,, “Measurement of Brand Equity for Agricultural Products: Cases of Rice, Beef and Peach in Korea”, Korean Journal of Agricultural Economics, vol. 50, no. 4, pp. 1-29, 2009.
[17] D.W. Choi, W.H. An, Q.L. Lin, 2015, “A Study on the Developement of Evaluation Indicator for Brand Self-diagnosis of Agricultural Management Organizations”, Journal of Agricultural Extension & Community Development, vol. 22, no. 4, pp. 385-393, 2015.
DOI: http://dx.doi.org/10.12653/jecd.2015.22.4.0385 [18] S.A. Neslin, R.W. Shoemaker, “Using a Natural
Experiment to Estimate Price Elasticity: the 1974 Sugar Shortage and the Ready-to-Eat Cereal Market”, Journal of Marketing, vol. 47, no. 1, pp. 44-57, 1983.
DOI: http://dx.doi.org/10.2307/3203426
[19] R.K. Srivastava, A.D. Shocker, Brand Equity: A Perspective on Its Meaning and Measurement, Marketing Science Institute, 1991.
[20] C.J. Cobb-Walgren, C.A. Ruble, N. Donthu, “Brand Equity, Brand Preference, and Purchase Intention”, Journal of Advertising, vol. 24, no. 3, pp. 25-40, 1995.
DOI: http://dx.doi.org/10.1080/00913367.1995.10673481 [21] S.M. Broniardzyk, J.W. Alba, “The Importance of the
Brand in Brand Extension, Journal of Marketing Research, vol. 31, no. 2, pp. 214-228, 1994.
DOI: http://dx.doi.org/10.2307/3152195
[22] D.J. Mun, “A Study of Brand Equity & Performance Diagnosis Model”, Journal of Global Scholars of Marketing Science, vol. 9, pp. 77-99, 2002.
DOI: http://dx.doi.org/10.1080/12297119.2002.9707310 [23] V.A. Zeithaml, “Consumer Perceptions of Price, Quality,
and Value: A Mean-End Model and Synthesis of the Evidence”, Journal of Marketing, vol. 52, no. 3, pp.
2-22, 1988.
DOI: http://dx.doi.org/10.2307/1251446
[24] R.L. Oliver, Satisfaction: A Behavioral Perspective on the Consumer, New York:McGraw-Hill, 1997.
최 돈 우(Don-Woo Choi) [정회원]
•1996년 2월 ~ 현재 : 경상북도농 업기술원
•1998년 8월 : 경북대학교 대학원 농업경제학과(경제학석사)
•2014년 2월 : 경북대학교 대학원 농업경제학과(경제학박사)
<관심분야>
농업경영, 농업회계, 스마트팜(ICT)
김 태 균(Tae-Kyun Kim) [정회원]
•1989년 12월 : 미국 아이오와주립 대학교 대학원 경제학과 (경제학박 사)
•1990년 3월 ~ 현재 : 경북대학교 농업경제학과 교수
<관심분야>
생산경제, 식품수요, 농업경영
임 청 룡(Qing-Long Lin) [정회원]
•2006년 2월 : 경북대학교 대학원 농업경제학과 (경제학석사)
•2008년 2월 : 경북대학교 대학원 농업경제학과 (경제학박사)
•2014년 9월 ~ 현재 : 연변대학교 농림경제학학과 전임강사
<관심분야>
농업경영, 환경경제, 농산물마케팅