D I A B E T E S & M E T A B O L I S M J O U R N A L
This is an Open Access article distributed under the terms of the Creative Commons Attribution Non-Commercial License (http://creativecommons.org/licenses/by-nc/4.0/) which permits unrestricted non-commercial use, distribution, and reproduction in any medium, provided the original work is properly cited.
Improvement of Glycosylated Hemoglobin in Patients with Type 2 Diabetes Mellitus under Insulin Treatment by Reimbursement for Self-Monitoring of Blood
Glucose
Young Shin Song1,*, Bo Kyung Koo1,2,3,*, Sang Wan Kim1,2, Ka Hee Yi1,2, Kichul Shin2,3, Min Kyong Moon1,2
1Department of Internal Medicine, Seoul National University College of Medicine, Seoul,
2Department of Internal Medicine, Seoul Metropolitan Government Boramae Medical Center, Seoul,
3Center for Medical Informatics, Seoul Metropolitan Government Boramae Medical Center, Seoul, Korea
Background: In Korea, the costs associated with self-monitoring of blood glucose (SMBG) for patients with type 2 diabetes mel- litus (T2DM) under insulin treatment have been reimbursed since November 2015. We investigated whether this new reimburse- ment program for SMBG has improved the glycemic control in the beneficiaries of this policy.
Methods: Among all adult T2DM patients with ≥3 months of reimbursement (n=854), subjects without any changes in anti-hy- perglycemic agents during the study period were selected. The improvement of glycosylated hemoglobin (HbA1c) was defined as an absolute reduction in HbA1c ≥0.6% or an HbA1c level at follow-up <7%.
Results: HbA1c levels significantly decreased from 8.5%±1.3% to 8.2%±1.2% during the follow-up (P<0.001) in all the study subjects (n=409). Among them, 35.5% (n=145) showed a significant improvement in HbA1c. Subjects covered under the Medi- cal Aid system showed a higher prevalence of improvement in HbA1c than those with medical insurance (52.2% vs. 33.3%, re- spectively, P=0.012). In the improvement group, the baseline HbA1c (P<0.001), fasting C-peptide (P=0.016), and daily dose of insulin/body weight (P=0.024) showed significant negative correlations with the degree of HbA1c change. Multivariate analysis showed that subjects in the Medical Aid system were about 2.5-fold more likely to improve in HbA1c compared to those with medical insurance (odds ratio, 2.459; 95% confidence interval, 1.138 to 5.314; P=0.022).
Conclusion: The reimbursement for SMBG resulted in a significant improvement in HbA1c in T2DM subjects using insulin, which was more prominent in subjects with poor glucose control at baseline or covered under the Medical Aid system.
Keywords: Blood glucose self-monitoring; Diabetes mellitus, type 2; Hemoglobin A, glycosylated; Insurance, health, reimburse- ment
Corresponding author: Min Kyong Moon https://orcid.org//0000-0002-5460-2846
Department of Internal Medicine, Seoul Metropolitan Government Seoul National University Boramae Medical Center, Seoul National University College of Medicine, 20 Boramae-ro 5-gil, Dongjak-gu, Seoul 07061, Korea
E-mail: [email protected]
INTRODUCTION
Self-monitoring of blood glucose (SMBG) is an essential tool to ensure optimal blood glucose control. Major clinical trials have shown that SMBG can improve glycemic control among
patients with both type 2 diabetes mellitus (T2DM) [1,2] and type 1 diabetes mellitus (T1DM) [3,4]. In particular, SMBG is important for all insulin-treated patients to minimize the risks of both hyper- and hypoglycemic episodes and to reach their glycemic goals [5]. The American Diabetes Association first https://doi.org/10.4093/dmj.2018.42.1.28
pISSN 2233-6079 · eISSN 2233-6087
29 published guidelines for SMBG in 1987 [6] and the current
recommendations suggest regular SMBG based on the situa- tion of each patient [7]. Considering the importance of SMBG for diabetes care, the American Diabetes Association recom- mends that the government should make the process accessible and affordable for all patients who require it. Moreover, it sug- gests that insurers and third-party payers reimburse the medi- cation and supplies related to the daily care of diabetes [8].
In Korea, restricted reimbursement for SMBG was started in July 2011 by the National Health Insurance Corporation of Korea (NHI). As the NHI has covered the entire population since 1989, it covered almost all reimbursements for candi- dates in Korea. However, at that time, the reimbursement for SMBG was limited to glucose test strips prescribed for patients with T1DM. In November 2015, a new nationwide reimburse- ment program of SMBG for T2DM patients was introduced.
The range of subjects was expanded to all diabetic patients un- der insulin treatment, and the covered supplies were expanded to include blood glucose test strips, lancets, insulin syringes, and pen needles. This extended reimbursement program of SMBG was applied to both beneficiaries of the Medical Insur- ance service and those under the Medical Aid Program of the NHI; the Medical Aid Program is provided for low-income in- dividuals as a part of social welfare programs. The proportions of beneficiaries of the Medical Insurance service and Medical Aid system in the NHI are 97% and 3%, respectively [9].
The current study aimed to investigate whether the intro- duction of this new reimbursement program for SMBG has improved the glycemic control in T2DM patients under insu- lin treatment.
METHODS
Patients
T2DM patients who had visited the Seoul Metropolitan Gov- ernment Seoul National University Boramae Medical Center and started SMBG reimbursement between November 16, 2015, and January 29, 2016, were eligible for study inclusion.
The index date was defined as the day of the first reimburse- ment for SMBG. The inclusion criteria were (1) T2DM pa- tients over 20 years old receiving treatment with insulin, (2) no changes in the type of insulin or oral anti-diabetic drugs from 3 months before the index date to the end of the study period, (3) available glycosylated hemoglobin (HbA1c) data from be- fore and after ≥3 months from the index date, and (4) a
HbA1c level at the index date ≥7.0%. We excluded subjects with a duration of insulin treatment of less than 12 months be- fore the index date or with a history of malignancy or systemic steroid treatment. Patients with any changes in the type of in- sulin or oral anti-diabetic drugs from 3 months prior to the in- dex date and during the study period were excluded, although those with only changes in dose were allowed. For each patient, the baseline and follow-up data until 6 months after the first reimbursement for SMBG were collected retrospectively from electronic medical records. This study was conducted in accor- dance with the provisions of the Declaration of Helsinki for the participation of human subjects in research and was approved by the Institutional Review Board of Seoul Metropolitan Gov- ernment Seoul National University Boramae Medical Center, and informed consent was waived for this retrospective study (No. 20160902/26-2016-118/092).
Clinical and biochemical measurements
The plasma glucose and lipid concentrations were measured enzymatically using a Hitachi Automatic Analyzer B2400 (Hi- tachi, Tokyo, Japan), and HbA1c was measured using a 200FR system (Toshiba, Tokyo, Japan). Improvement in HbA1c was defined as an absolute reduction in HbA1c ≥0.6% from the baseline or an HbA1c level <7.0% at follow-up. Patients who met this definition were classified as the improvement group;
otherwise, they were classified as the no improvement group.
A mean improvement in HbA1c of 0.6% (6.6 mmol/mol) is in keeping with other studies of T2DM patients under insulin treatment [10,11].
Statistical analysis
Continuous variables are described as mean±standard devia- tion (SD) or median values with interquartile range (IQR). Di- chotomous variables are described as counts and percentages (%). To determine the differences in baseline clinical charac- teristics according to the improvement in HbA1c, Pearson’s chi-square test for categorical variables and the independent t-test or the Wilcoxon-Mann-Whitney test for continuous vari- ables were used. The HbA1c and fasting serum glucose levels and the mean insulin dose at baseline and at the 3- and 6-month follow-up were examined, and the last-observation- carried-forward method was used to handle data missing be- cause of data censoring. The glycemic profile before and after reimbursement for SMBG was compared using paired t-tests.
Variables that were significantly associated with improvement
in HbA1c in the univariate analysis (P<0.05) were subsequent- ly entered into logistic regression models to determine the ad- justed odds ratios for independent predictors of the improve- ment in HbA1c. Relationships between the reduction in the HbA1c level and other parameters were evaluated using Spear- man’s correlation coefficient. All statistical analyses were per- formed using SPSS version 20.0 (IBM Co., Armonk, NY, USA).
Missing values were handled using the last-observation-car- ried-forward method, and statistical significance was defined as two-sided P values <0.05.
RESULTS
Baseline clinical characteristics of the study subjects Among the total number of T2DM patients with reimburse- ment for SMBG (n=854), 409 patients with T2DM were in- cluded in the analysis (Supplementary Fig. 1). The median fol- low-up duration was 6.1 months (IQR, 5.6 to 6.5 months). The median age of the study participants was 67 years (IQR, 60 to 73 years), the mean duration of diabetes was 19.1±8.0 years, and the median HbA1c was 8.2% (IQR, 7.5% to 9.2%). Among all study participants, 77.0% had taken insulin for >5 years.
Those under the Medical Insurance and Medical Aid systems accounted for 88.8% (363/409) and 11.2% (46/409) of the sub- jects, respectively (Table 1). Patients under the Medical Aid system were younger and had higher body mass index, higher HbA1c and fasting serum glucose levels, higher frequency of diabetic retinopathy, and higher daily doses of insulin than those with Medical Insurance (Supplementary Table 1). The most prevalent concomitant oral anti-diabetic medication was metformin, which was taken by 74.8% of the study subjects.
Sulfonylurea and dipeptidyl peptidase-4 inhibitors were pre- scribed for 43.5% and 23.5% of the subjects, respectively (Sup- plementary Table 2).
Changes in glycemic control after reimbursement for SMBG
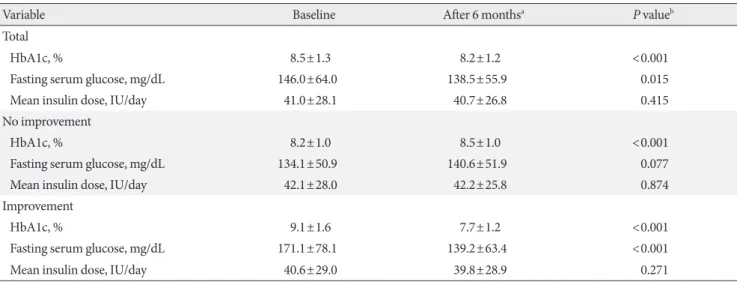
After 6 months of reimbursement for SMBG, HbA1c levels significantly decreased from a baseline value of 8.5%±1.3% to 8.2%±1.2% (P<0.001), and fasting serum glucose levels also decreased from a baseline of 146.0±64.0 to 138.5±55.9 mg/dL (P=0.015) (Table 2). Sensitivity analyses according to the insu- lin regimen confirmed that HbA1c levels significantly decreased regardless of the type of regimen (Supplementary Table 3).
Of the 409 patients, 145 (35.5%) showed significant im-
provements in HbA1c: 136 achieved an absolute reduction in HbA1c ≥0.6%, 47 had HbA1c levels at follow-up <7%, and 38 were satisfied with both conditions. In subjects with improve- ment, the mean HbA1c and fasting serum glucose levels at baseline were 9.1% and 171.1 mg/dL, and the mean changes in those levels during the follow-up were –1.4% and –31.9 mg/dL, respectively (P<0.001 for both) (Table 2). In contrast, HbA1c in the no improvement group significantly increased, from 8.2%±1.0% to 8.5%±1.0% (P<0.001). The mean daily dose of insulin was unchanged both in subjects with and without im- provement. Regarding dosage changes in oral anti-diabetic drugs, most patients maintained the same dosage during the study period (93.2% of the improvement group and 96.6% of the no improvement group) (Supplementary Table 4). More- over, there were no significant differences in the proportion of patients with increased or decreased dosages of oral anti-dia- betic drugs between the two groups.
Compared to the subjects without improvement, those with improvement had significantly higher baseline HbA1c (9.1±
1.6 mg/dL vs. 8.2±1.0 mg/dL, P<0.001). They also showed a higher diastolic blood pressure at baseline (Table 1); however, the statistical significance was lost when the subgroup analysis was performed in patients who were not taking anti-hyperten- sive drugs (P=0.417). Furthermore, 52.2% (24/46) of the sub- jects under the Medical Aid system showed improvement in their HbA1c levels, which was a higher proportion than in those with Medical Insurance (33.3%, 121/363; P=0.012).
We compared the trends of the change in HbA1c levels dur- ing the study period between both groups and found that sub- jects in the improvement group showed a significant gradual reduction in HbA1c levels (P<0.001 from the paired t-test be- tween baseline vs. 3 months and 3 months vs. 6 months) (Fig.
1). Considering that significantly higher baseline HbA1c levels in the improvement group might affect the change in HbA1c levels during the follow-up period, we also compared the change in HbA1c levels from –3 months. HbA1c levels at –3 months were not different between the two groups (Supple- mentary Table 5). HbA1c levels at 6 months were significantly lower than HbA1c levels at –3 months in the improvement group; in contrast, the no improvement group showed signifi- cantly increased levels of HbA1c during the same period (Supplementary Table 5). Furthermore, the amount of changes in HbA1c levels during that period was significantly lower in the improvement group (–0.67%±1.21% vs. 0.12%±1.03%, P<0.001).
31 Table 1. Baseline characteristics according to improvement of HbA1c
Characteristic Total Improvementa P value
– +
Number 409 264 145
Age, yr 67 (60–73) 67 (59–72) 67 (60–75) 0.234
Male sex 194 (47.4) 121 (45.8) 73 (50.3) 0.382
Body mass index, kg/m2 24.7 (22.8–27.4) 24.5 (22.6–27.1) 25.5 (23.2–27.8) 0.078
Duration of diabetes, yr 19.1±8.0 19.0±8.3 19.7±7.7 0.430
Systolic blood pressure, mm Hg 128.6±14.9 128.0±14.9 129.8±14.8 0.246
Diastolic blood pressure, mm Hg 72.4±10.6 71.6±10.8 73.8±10.2 0.046
HbA1c, % 8.5±1.3 8.2±1.0 9.1±1.6 <0.001
Fasting serum glucose, mg/dL 137 (105–175) 126 (101–160) 154 (122–202) <0.001
Fasting C-peptide, ng/mL 1.6 (0.9–2.4) 1.6 (0.9–2.3) 1.6 (0.9–2.5) 0.649
Urine albumin to creatinine ratio 37.5 (12.3–203.8) 36.7(11.8–173.6) 38.7(12.8–329.0) 0.317
BUN, mg/dL 16 (13–22) 16 (13–21) 17 (14–24) 0.058
Creatinine, mg/dL 0.9 (0.7–1.2) 0.9 (0.7–1.2) 0.9 (0.7–1.2) 0.226
Estimated GFR, mL/min/1.73 m2 71.4±27.8 72.6±25.9 69.2±31.0 0.263
AST, IU/L 23 (19–31) 23 (20–30) 22 (17–31) 0.256
ALT, IU/L 22 (16–32) 22 (17–33) 21 (15–29) 0.172
Total cholesterol, mg/dL 146 (129–167) 145 (129–163) 151 (127–171) 0.449
Triglyceride, mg/dL 123 (91–168) 123 (93–162) 120 (86–192) 0.984
HDL-C, mg/dL 43 (37–51) 45 (37–52) 43 (36–51) 0.607
LDL-C, mg/dL 79 (65–97) 77 (64–94) 84 (65–97) 0.194
Hypertension 324 (79.2) 212 (80.3) 112 (77.2) 0.465
History of CAD 45 (11.0) 29 (11.0) 16 (11.0) 0.988
History of CVA 25 (6.1) 16 (6.10) 9 (6.2) 0.953
Diabetic retinopathy 204/311 (65.6) 133/197 (67.5) 71/114 (62.3) 0.349
Non-proliferative 131/311 (42.1) 88/197 (44.7) 43/114 (37.7)
Proliferative 73/311 (23.5) 45/197 (22.8) 28/114 (24.6)
Diabetic nephropathy 236/408 (57.8) 151/264 (57.2) 85/144 (59.0) 0.720
Microalbuminuria 123/393 (31.3) 85/254 (33.5) 38/139 (27.3)
Overt proteinuria 84/393 (21.4) 49/254 (19.3) 35/139 (25.2)
CKD stage 3 98/408 (24.0) 65/264 (24.6) 33/144 (22.9)
CKD stage 4–5 38/408 (9.3) 18/264 (6.8) 20/144 (13.9)
Duration of insulin treatment, yr 0.936
1–5 94 (23.0) 61 (23.1) 33 (22.8)
>5 315 (77.0) 203 (76.9) 112 (77.2)
Daily dose of insulin, IU 34 (22–52) 34 (22–52) 32 (22–52) 0.791
National Health Insurance service 0.012
Medical Aid 46 (11.2) 22 (8.3) 24 (16.6)
Medical Insurance 363 (88.8) 242 (91.7) 121 (83.4)
Duration of diabetes ≥20 yr 204/403 (50.6) 128/259 (49.4) 76/144 (52.8) 0.518
Baseline HbA1c >8.2% 199 (48.7) 107 (40.5) 92 (63.4) <0.001
Presence of hypoglycemia 46/406 (11.3) 33/261 (12.6) 13/145 (9.0) 0.263
<1/mo 13/406 (3.2) 9/261 (3.4) 4/145 (2.8)
1–3/mo 31/406 (7.6) 23/261 (8.8) 8/145 (5.5)
>3/mo 2/406 (0.5) 1/261 (0.4) 1/145 (0.7)
Use of antihypertensive drug 308 (75.3) 198 (75.0) 110 (75.9) 0.847
Use of statin 331 (80.9) 223 (84.5) 108 (74.5) 0.014
Values are presented as median (interquartile range), number (%), or mean±standard deviation.
HbA1c, glycosylated hemoglobin; BUN, blood urea nitrogen; GFR, glomerular filtration rate; AST, aspartate transferase; ALT, alanine transferase; HDL- C, high density lipoprotein cholesterol; LDL-C, low density lipoprotein cholesterol; CAD, coronary artery disease; CVA, cerebrovascular accident; CKD, chronic kidney disease.
aDefined as absolute reduction of HbA1c ≥0.6% or HbA1c level at follow-up <7%.
Correlations between changes in HbA1c levels and clinical variables
Subsequently, we investigated whether any clinical parameters determined changes in HbA1c levels in the improvement group. Baseline HbA1c, baseline fasting serum glucose level, body mass index, fasting C-peptide, daily dose of insulin, and body weight-adjusted daily dose of insulin showed significant
negative correlations with the degree of HbA1c change (Table 3). That is, increase in these variables was associated with de- Table 2. Comparison of glycemic profile between before and after reimbursement for self-monitoring of blood glucose
Variable Baseline After 6 monthsa P valueb
Total
HbA1c, % 8.5±1.3 8.2±1.2 <0.001
Fasting serum glucose, mg/dL 146.0±64.0 138.5±55.9 0.015
Mean insulin dose, IU/day 41.0±28.1 40.7±26.8 0.415
No improvement
HbA1c, % 8.2±1.0 8.5±1.0 <0.001
Fasting serum glucose, mg/dL 134.1±50.9 140.6±51.9 0.077
Mean insulin dose, IU/day 42.1±28.0 42.2±25.8 0.874
Improvement
HbA1c, % 9.1±1.6 7.7±1.2 <0.001
Fasting serum glucose, mg/dL 171.1±78.1 139.2±63.4 <0.001
Mean insulin dose, IU/day 40.6±29.0 39.8±28.9 0.271
Values are presented as mean±standard deviation.
HbA1c, glycosylated hemoglobin.
aValue at 6 months from the index date (last observation carried forward), bP value calculated by paired t-test.
Fig. 1. The change in HbA1c during the follow-up periods.
Comparisons of the glycosylated hemoglobin (HbA1c) levels at baseline and 3 and 6 months after the first reimbursement for self-monitoring of blood glucose as determined by the paired t-test. All data are expressed as mean±SEM. aP<0.05 vs.
baseline, bP<0.05 vs. 3 months.
9.5 9 8.5 8 7.5 7 0
HbA1c (%)
Baseline 3 Months 6 Months
a aa
Total Improvement No improvement
a, a, b b
Table 3. Correlation of change in HbA1c levels with clinical factors in the improvement group
Variable ra P value
Age 0.086 0.302
Duration of diabetes 0.020 0.810
Body mass index –0.239 0.008
HbA1c –0.694 <0.001
Fasting serum glucose –0.349 <0.001
C-peptide –0.226 0.016
Urine albumin to creatinine ratio –0.025 0.773
BUN –0.099 0.241
Creatinine –0.021 0.807
AST 0.044 0.597
ALT –0.014 0.871
Total cholesterol –0.041 0.628
Triglyceride –0.166 0.054
HDL-C 0.106 0.221
LDL-C –0.090 0.308
Total daily dose of insulin –0.222 0.007 Total daily dose of insulin/body
weight –0.204 0.024
HbA1c, glycosylated hemoglobin; BUN, blood urea nitrogen; AST, aspartate transferase; ALT, alanine transferase; HDL-C, high density lipoprotein cholesterol; LDL-C, low density lipoprotein cholesterol.
aSpearman’s correlation coefficient.
33 crease in HbA1c levels. Especially, baseline HbA1c and fasting
serum glucose levels showed moderate-to-strong inverse cor- relations with changes in HbA1c (r=–0.694, P<0.001; r=
–0.349, P<0.001, respectively).
Determinants for improvement of the HbA1c level
To evaluate the predictors of improvement in HbA1c, multi- variate analysis was performed using the baseline clinical fac- tors that significantly differed between those with and without improvement, namely the type of NHI service benefit, baseline HbA1c, fasting serum glucose, and use of statins. The baseline HbA1c level was categorized as ≤8.2% and >8.2% according to the median level. All the above variables remained statisti- cally significant determinants for the improvement in HbA1c even after adjustment for age, sex, and potential confounders (Model 3, Table 4). In addition, to confirm the effects of the Medical Aid system, variables with significant differences be- tween the groups of Medical Aid and Medical Insurance, in- cluding body mass index, presence of diabetic retinopathy, and daily insulin dose, were additionally adjusted (Model 4).
T2DM patients supported by the Medical Aid system were about 2.5-fold more likely to show an improvement in HbA1c levels compared to patients with Medical Insurance (odds ratio, 2.459; 95% confidence interval, 1.138 to 5.314; P=0.022).
DISCUSSION
Korea’s newly introduced reimbursement program of SMBG significantly improved glycemic control in T2DM patients treated with insulin. In particular, patients with high baseline
HbA1c levels had a greater reduction in HbA1c, and those re- imbursed under the Medical Aid system were more likely to achieve improvement in glycemic control. Furthermore, HbA1c reduction was maintained for 6 months after the initia- tion of the reimbursement program.
SMBG is crucial for evaluating drug response, adjusting in- sulin doses, and preventing hypoglycemia. It helps control dia- betes in a number of ways, including providing information regarding the appropriate food choices and quantities, assisting in insulin dosing, and identifying dynamic blood glucose pro- files that can lead to improvements in glycemic control [12,13], lower risks of long-term diabetic complications [4,14], and re- duce health care costs [8]. A negative association between the frequency of SMBG and the blood glucose levels was also re- ported among insulin-treated T2DM patients [15] as well as T1DM [3,16], although current evidence regarding the useful- ness of SMBG in those with T2DM who do not take insulin is insufficient [16-19].
Despite the clinical importance of SMBG in insulin-treated diabetic patients, reimbursement policies vary between coun- tries [20]. In China, glucometers and test strips for SMBG are currently not covered by government-provided medical insur- ance [21]. In contrast, many European and North American countries largely cover the cost for SMBG, even for those with- out insulin treatment. The United States and Canada offer 75%
to 80% reimbursement for SMBG equipment and supplies, al- though the amount of supplies that are covered differs between insulin-dependent and non-insulin-dependent beneficiaries [22,23]. Similarly, in Australia, patients with diabetes are eligi- ble for reimbursement; however, those with T2DM who do not Table 4. Determinants for improvement in HbA1c levels
Variable Model 1a Model 2b Model 3c Model 4d
OR (95% CI) P value OR (95% CI) P value OR (95% CI) P value OR (95% CI) P value Medical Aid vs.
Insurance 2.182
(1.176–4.049) 0.013 2.319
(1.240–4.336) 0.008 2.316
(1.213–4.419) 0.011 2.459
(1.138–5.314) 0.022
HbA1c 2.547
(1.677–3.868) <0.001 2.710
(1.771–4.148) <0.001 2.676
(1.737–4.123) <0.001 2.766
(1.576–4.857) <0.001 Fasting serum
glucose 1.010
(1.006–1.014) <0.001 1.010
(1.006–1.014) <0.001 1.007
(1.003–1.011) 0.001 1.009
(1.004–1.015) 0.001 Use of statin 0.537
(0.325–0.885) 0.015 0.540
(0.325–0.896) 0.017 0.565
(0.334–0.955) 0.033 0.531
(0.265–1.066) 0.075 HbA1c, glycosylated hemoglobin; OR, odds ratio; CI, confidence interval.
aModel 1: unadjusted, bModel 2: adjusted for age and sex, cModel 3: adjusted for age, sex, benefit type of National Health Insurance service, base- line HbA1c, and use of statin, dModel 4: adjusted for age, sex, benefit type of National Health Insurance service, baseline HbA1c, and use of statin, body mass index, presence of diabetic retinopathy, and daily insulin dose.
use insulin are reimbursed only for the initial 6 months due to limited evidence of the benefits of SMBG in this population [24]. France and Italy provide reimbursement for all T2DM patients under insulin treatment without any restrictions, with the exception of the number of tests for T2DM patients with- out insulin treatment [25].
A limited number of studies have investigated the cost-effec- tiveness of the reimbursement of SMBG. Our data provide evi- dence that each country’s reimbursement policies should be refined considering the population distribution of the socio- economic status and burden of diabetes, as well as the merits of improving glycemic control. Interestingly, the patients covered by the Medical Aid system were more likely to achieve im- provement in glycemic control in our study, suggesting that the cost of SMBG is an important barrier for poorer patients and that the amount of reimbursement or the refinement of the beneficiaries of this health policy should be adjusted after anal- ysis of the long-term cost-effectiveness.
In this study, glucose control in T2DM patients under insu- lin treatment was improved by reimbursement for SMBG, al- though there was no difference in the dose of insulin or oral anti-diabetic drugs after the reimbursement, even in the im- provement group. This suggests that the observed improve- ment might be caused by modified behavior, including food intake, exercise, and taking medication regularly, rather than increasing doses of medication. In particular, subjects with high HbA1c levels showed greater improvement in HbA1c af- ter reimbursement. This significant correlation remained when we analyzed the data according to the relative proportions of the improvement of HbA1c.These results suggest that the new reimbursement program may provide motivation to improve diabetic care, especially in uncontrolled diabetic patients with previously poor compliance.
Some possible limitations of our study need to be discussed.
First, we did not analyze the actual frequency of SMBG in our study subjects before and after the reimbursement, which re- sulted in the inability to confirm that reimbursement for SMBG increased the frequency of SMBG. Second, as all T2DM patients under insulin treatment are eligible for the reimburse- ment, our study could not have control subjects, that is, sub- jects without reimbursement. Instead, we compared the glu- cose level before and after the reimbursement for SMBG in each subject and analyzed the factors affecting the amount of change in glucose levels. Assessment of the improvement glu- cose levels in each patient might also be important, as the ben-
efit from the reimbursement for SMBG in each individual can be assessed and there is a lower risk of confounders. Further- more, analysis of the change in glucose levels after the reim- bursement for SMBG without considering the actual frequen- cy of SMBG in each patient might be more suitable to appraise the benefits of reimbursement for SMBG policy in the real- world setting. Third, there was a difference in baseline HbA1c levels between the groups of Medical Aid and Medical Insur- ance, and it can be a confounder. However, we could overcome this factor by adjusting the HbA1c level in the multivariate analysis. In addition, considering a higher baseline HbA1c in the improvement group compared to the no improvement group, we compared the change in HbA1c levels not only from the baseline but also from the –3 months; there was no differ- ence between the two groups, confirming that the current defi- nition of improvement of HbA1c could successfully differenti- ate individuals with HbA1c improvement among the study subjects. Finally, this study analyzed glucose levels for only 6 months after the initiation of reimbursement for SMBG. The long-term benefits should be assessed in future studies, as the health policy associated with the reimbursement for SMBG might need to be adjusted accordingly.
In conclusion, the new reimbursement program for SMBG in Korea improved the glycemic control in T2DM patients un- der insulin treatment; this improvement was especially promi- nent in subjects with poor glycemic control at the baseline or covered under the Medical Aid system.
CONFLICTS OF INTEREST
No potential conflict of interest relevant to this article was re- ported.
ACKNOWLEDGMENTS
This study was supported by the Creative Industrial Technolo- gy Development Program (No. 10053249) and the Korea Me- teorological Administration Research and Development Pro- gram (No. KMIPA 2015-5120).
REFERENCES
1. Polonsky WH, Fisher L, Schikman CH, Hinnen DA, Parkin CG, Jelsovsky Z, Petersen B, Schweitzer M, Wagner RS. Struc- tured self-monitoring of blood glucose significantly reduces
35 A1C levels in poorly controlled, noninsulin-treated type 2 dia-
betes: results from the Structured Testing Program study. Dia- betes Care 2011;34:262-7.
2. Franciosi M, Pellegrini F, De Berardis G, Belfiglio M, Cavaliere D, Di Nardo B, Greenfield S, Kaplan SH, Sacco M, Tognoni G, Valentini M, Nicolucci A; QuED Study Group. The impact of blood glucose self-monitoring on metabolic control and quali- ty of life in type 2 diabetic patients: an urgent need for better educational strategies. Diabetes Care 2001;24:1870-7.
3. Miller KM, Beck RW, Bergenstal RM, Goland RS, Haller MJ, McGill JB, Rodriguez H, Simmons JH, Hirsch IB; T1D Ex- change Clinic Network. Evidence of a strong association be- tween frequency of self-monitoring of blood glucose and he- moglobin A1c levels in T1D exchange clinic registry partici- pants. Diabetes Care 2013;36:2009-14.
4. Diabetes Control and Complications Trial Research Group, Nathan DM, Genuth S, Lachin J, Cleary P, Crofford O, Davis M, Rand L, Siebert C. The effect of intensive treatment of dia- betes on the development and progression of long-term com- plications in insulin-dependent diabetes mellitus. N Engl J Med 1993;329:977-86.
5. Goldstein DE, Little RR, Lorenz RA, Malone JI, Nathan DM, Peterson CM; American Diabetes Association. Tests of glyce- mia in diabetes. Diabetes Care 2004;27 Suppl 1:S91-3.
6. Consensus statement on self-monitoring of blood glucose. Di- abetes Care 1987;10:95-9.
7. American Diabetes Association. Standards of medical care in diabetes: 2010. Diabetes Care 2010;33 Suppl 1:S11-61.
8. American Diabetes Association. Third-party reimbursement for diabetes care, self-management education, and supplies.
Diabetes Care 2014;37 Suppl 1:S118-9.
9. Seong SC, Son MS. 2015 National Health Insurance Statistical Yearbook. Wonju: Health Insurance Review and Assessment Service of Korea; 2016.
10. Yki-Jarvinen H, Rosenstock J, Duran-Garcia S, Pinnetti S, Bhattacharya S, Thiemann S, Patel S, Woerle HJ. Effects of add- ing linagliptin to basal insulin regimen for inadequately con- trolled type 2 diabetes: a ≥52-week randomized, double-blind study. Diabetes Care 2013;36:3875-81.
11. Hong ES, Khang AR, Yoon JW, Kang SM, Choi SH, Park KS, Jang HC, Shin H, Walford GA, Lim S. Comparison between si- tagliptin as add-on therapy to insulin and insulin dose-increase therapy in uncontrolled Korean type 2 diabetes: CSI study. Dia- betes Obes Metab 2012;14:795-802.
12. Poolsup N, Suksomboon N, Rattanasookchit S. Meta-analysis
of the benefits of self-monitoring of blood glucose on glycemic control in type 2 diabetes patients: an update. Diabetes Technol Ther 2009;11:775-84.
13. Welschen LM, Bloemendal E, Nijpels G, Dekker JM, Heine RJ, Stalman WA, Bouter LM. Self-monitoring of blood glucose in patients with type 2 diabetes who are not using insulin: a sys- tematic review. Diabetes Care 2005;28:1510-7.
14. Burge MR. Lack of compliance with home blood glucose mon- itoring predicts hospitalization in diabetes. Diabetes Care 2001;
24:1502-3.
15. Rosenstock J, Davies M, Home PD, Larsen J, Koenen C, Schernthaner G. A randomised, 52-week, treat-to-target trial comparing insulin detemir with insulin glargine when admin- istered as add-on to glucose-lowering drugs in insulin-naive people with type 2 diabetes. Diabetologia 2008;51:408-16.
16. Karter AJ, Ackerson LM, Darbinian JA, D’Agostino RB Jr, Ferr- ara A, Liu J, Selby JV. Self-monitoring of blood glucose levels and glycemic control: the Northern California Kaiser Perman- ente Diabetes registry. Am J Med 2001;111:1-9.
17. Simon J, Gray A, Clarke P, Wade A, Neil A, Farmer A; Diabetes Glycaemic Education and Monitoring Trial Group. Cost effec- tiveness of self monitoring of blood glucose in patients with non-insulin treated type 2 diabetes: economic evaluation of data from the DiGEM trial. BMJ 2008;336:1177-80.
18. O’Kane MJ, Bunting B, Copeland M, Coates VE; ESMON study group. Efficacy of self monitoring of blood glucose in pa- tients with newly diagnosed type 2 diabetes (ESMON study):
randomised controlled trial. BMJ 2008;336:1174-7.
19. Farmer A, Wade A, Goyder E, Yudkin P, French D, Craven A, Holman R, Kinmonth AL, Neil A. Impact of self monitoring of blood glucose in the management of patients with non-insulin treated diabetes: open parallel group randomised trial. BMJ 2007;335:132.
20. Czupryniak L, Barkai L, Bolgarska S, Bronisz A, Broz J, Cypryk K, Honka M, Janez A, Krnic M, Lalic N, Martinka E, Rahelic D, Roman G, Tankova T, Varkonyi T, Wolnik B, Zherdova N. Self- monitoring of blood glucose in diabetes: from evidence to clin- ical reality in Central and Eastern Europe: recommendations from the international Central-Eastern European expert group. Diabetes Technol Ther 2014;16:460-75.
21. Ji L, Su Q, Feng B, Shan Z, Hu R, Xing X, Xue Y. Glycemic con- trol and self-monitoring of blood glucose in Chinese patients with type 2 diabetes on insulin: baseline results from the COMPASS study. Diabetes Res Clin Pract 2016;112:82-7.
22. Centers for Medicare & Medicaid Services: Medicare coverage
of blood glucose monitors and testing supplies, 2015. Avail- able from: https://www.cms.gov/Outreach-and-Education/
Medicare-Learning-Network-MLN/MLNMattersArticles/
downloads/SE1008.pdf (cited 2017 Sep 8).
23. Ontario Ministry of Health And Long-Term Care: Blood glu- cose test strips. Available from: http://www.health.gov.on.ca.
(cited 2017 Sep 8).
24. The Department of Health, Australian Government: National Diabetes Services Scheme (NDSS) 2016. Available from: http://
www.health.gov.au/internet/main/publishing.nsf/Content/
health-pbs-healthpro-supply-ndss.htm (cited 2017 Sep 8).
25. Schaefer E, Schnell G, Sonsalla J. Obtaining reimbursement in France and Italy for new diabetes products. J Diabetes Sci Technol 2015;9:156-61.
37 Supplementary Table 1. Baseline characteristics according to the type of National Health Insurance service
Characteristic Medical Aid Medical Insurance P value
Number 46 363
Age, yr 64.5 (54.8–71.3) 67.0 (60.0–73.0) 0.037
Male sex 20 (43.5) 174 (47.9) 0.569
Body mass index, kg/m2 26.7 (24.2–29.2) 24.4 (22.7–27.1) 0.002
Duration of diabetes, yr 17.9±7.5 19.4±8.2 0.245
Systolic blood pressure, mm Hg 128.2±15.2 128.6±14.8 0.862
Diastolic blood pressure, mm Hg 74.4±12.9 72.1±10.3 0.255
HbA1c, % 9.2±1.9 8.4±1.2 0.014
Fasting serum glucose, mg/dL 161 (126–194) 134 (103–168) 0.003
Fasting C-peptide, ng/mL 1.2 (0.8–2.5) 1.6 (0.9–2.4) 0.775
Urine albumin to creatinine ratio 35.8 (15.2–135.7) 38.1 (12.2–213.1) 0.878
BUN, mg/dL 16 (12–24) 17 (14–22) 0.910
Creatinine, mg/dL 0.9 (0.7–1.2) 0.9 (0.7–1.2) 0.623
Estimated GFR, mL/min/1.73 m2 71.0±30.3 71.5±27.5 0.913
AST, IU/L 21 (16–31) 23 (19–30) 0.105
ALT, IU/L 19 (14–28) 22 (16–32) 0.093
Total cholesterol, mg/dL 153 (137–171) 145 (127–165) 0.089
Triglyceride, mg/dL 130 (94–189) 122 (90–167) 0.374
HDL-C, mg/dL 46 (35–51) 43 (37–52) 0.717
LDL-C, mg/dL 85 (70–101) 78 (64–93) 0.076
Hypertension 40 (87.0) 284 (78.2) 0.170
History of CAD 5 (10.9) 40 (11.0) 0.976
History of CVA 3 (6.5) 22 (6.1) 0.752
Diabetic retinopathy 33/41 (80.5) 171/270 (63.3) 0.031
Non-proliferative 20/41 (48.8) 111/270 (41.1) 0.086
Proliferative 13/41 (31.7) 60/270 (22.2)
Diabetic nephropathy 31/46 (67.4) 205/362 (56.6) 0.164
Microalbuminuria 16/43 (37.2) 107/350 (30.6)
Overt proteinuria 9/43 (20.9) 75/350 (21.4)
CKD stage 3 16/46 (34.8) 82/362 (22.7)
CKD stage 4–5 4/46 (8.7) 34/362 (9.4)
Duration of insulin treatment, yr 0.595
1–5 12 (26.1) 82 (22.6)
>5 34 (73.9) 281 (77.4)
Daily dose of insulin, IU 43 (30–64) 32 (22–50) 0.009
Duration of diabetes ≥20 yr 21/45 (46.7) 183/358 (51.1) 0.574
Baseline HbA1c >8.2% 25 (54.3) 174 (47.9) 0.412
Presence of hypoglycemia 3/46 (6.5) 43/360 (11.9) 0.275
<1/mo 0/46 (0.0) 13/360 (3.6)
1–3/mo 3/46 (6.5) 28/360 (7.8)
>3/mo 0/46 (0.0) 2/360 (0.6)
Use of antihypertensive drug 40 (87.0) 268 (73.8) 0.052
Use of statin 36 (78.3) 295 (81.3) 0.625
Values are presented as median (interquartile range), number (%), or mean±standard deviation.
HbA1c, glycosylated hemoglobin; BUN, blood urea nitrogen; GFR, glomerular filtration rate; AST, aspartate transferase; ALT, alanine transferase;
HDL-C, high density lipoprotein cholesterol; LDL-C, low density lipoprotein cholesterol; CAD, coronary artery disease; CVA, cerebrovascular acci- dent; CKD, chronic kidney disease.
Supplementary Table 2. Baseline characteristics of types of prescription drugs according to improvement of glycosylated hemo- globin
Characteristic Total Improvementa
P value
– +
Type of insulin 0.262
Insulin glargine 171 (41.8) 118 (44.7) 53 (36.6)
NPH 75 (18.3) 48 (18.2) 27 (18.6)
Mixed insulin 180 (44.0) 109 (41.9) 715 (49.0)
Rapid/short-acting insulin 52 (12.7) 37 (14.0) 15 (10.3)
Type of oral antidiabetic drug 0.126
Metformin 306 (74.8) 204 (77.3) 102 (70.3)
Sulfonylurea 178 (43.5) 126 (47.7) 52 (35.9)
DPP4 inhibitor 96 (23.5) 60 (22.7) 36 (24.8)
GLP-1 agonist 1 (0.2) 1 (0.4) 0
SGLT2 inhibitor 15 (3.7) 5 (1.9) 10 (6.9)
Thiazolidinedione 12 (2.9) 11 (4.2) 1 (0.7)
α-Glucosidase inhibitor 11 (2.7) 6 (2.3) 5 (3.4)
Use of antihypertensive drug 308 (75.3) 198 (75.0) 110 (75.9) 0.847
ACE inhibitor 256 (62.6) 167 (63.3) 89 (61.4) 0.707
β-Blocker 95 (23.2) 62 (23.5) 33 (22.8) 0.868
Use of statin 331 (80.9) 223 (84.5) 108 (74.5) 0.014
Values are presented as number (%).
NPH, neutral protamine Hagedorn; DPP4, dipeptidyl peptidase-4; GLP-1, glucagon-like peptide-1; SGLT2, sodium/glucose cotransporter 2;
ACE, angiotensin-converting enzyme.
aDefined as absolute reduction of HbA1c ≥0.6% or HbA1c level at follow-up <7%.
39 Supplementary Table 3. Comparison of glycemic profile between at baseline and 6 months after reimbursement for self-moni- toring of blood glucose according to the type of insulin regimen
Variable Baseline After 6 monthsa P valueb
Basal-only insulin (n=178)
HbA1c, % 8.4±1.2 8.1±1.1 <0.001
Fasting serum glucose, mg/dL 135.7±47.1 135.1±49.8 0.874
Mean insulin dose, IU/day 28.0±13.3 28.6±13.8 0.148
Premixed insulin (n=180)
HbA1c, % 8.7±1.4 8.2±1.2 <0.001
Fasting serum glucose, mg/dL 159.0±76.1 141.7±61.7 0.005
Mean insulin dose, IU/day 47.0±27.4 46.8±27.7 0.737
Basal-bolus (MDI) (n=51)
HbA1c, % 8.7±1.3 8.4±1.2 0.037
Fasting serum glucose, mg/dL 143.5±62.0 139.4±54.9 0.654
Mean insulin dose, IU/day 65.2±42.6 61.4±36.9 0.104
Values are presented as mean±standard deviation.
HbA1c, glycosylated hemoglobin; MDI, multiple daily injection.
aValue at 6 months from the index date (last observation carried forward), bP value calculated by paired t-test.
Supplementary Table 4. Dosage changes in insulin and oral anti-diabetic drugs during the study period according to improve- ment in glycosylated hemoglobin
Dosage change Improvement
P value
– (n=264) + (n=145)
Oral anti-diabetic drugs
Maintenance 246 (93.2) 140 (96.6) 0.157
Increase 5 (1.9) 3 (2.1) 1.000
Metformin/SU/metformin+SU 2/3/0 1/1/1
Decrease 11 (4.2) 2 (1.4) 0.150
Metformin/SU/metformin+SU/AGI 0/7/4/0 1/0/0/1
Increase (SU) and decrease (metformin) 2 (0.8) 0 0.541
Values are presented as number (%).
SU, sulfornylurea; AGI, α-glucosidase inhibitor.
41 Supplementary Table 5. The trends of the change in HbA1c during the study period in subjects with and without improvement in HbA1c
Variable HbA1c
P valuea
No improvement Improvement
–3 Months 8.3±1.1 8.3±1.4 0.626
0 Month 8.2±1.0 9.1±1.6b <0.001
+3 Months 8.5±1.2b,c 8.1±1.3c 0.002
+6 Months 8.4±1.1c 7.7±1.2b,c <0.001
Change from –3 months 0.12±1.03 –0.67±1.21 <0.001
Change from the baseline 0.17±0.61 –1.36±1.04 <0.001
Values are presented as mean±standard deviation.
HbA1c, glycosylated hemoglobin.
aCompared subjects with and without improvement using independent t-test, bP<0.05 compared to the HbA1c levels at –3 months using paired t-test, cP<0.05 compared to the HbA1c levels from the baseline using paired t-test.
Supplementary Fig. 1. Flow chart of patients included in the study. T2DM, type 2 diabetes mellitus; SMBG, self-monitoring of blood glucose; OAD, oral antidiabetic drug; HbA1c, glycosylated hemoglobin.
854 T2DM patients with insulin treatment who started to be reimbursed for SMBG between 16 November 2015 and 29 January 2016
409 Patients included in the present analysis
278 Changes in the type of insulin or OAD 63 Duration of insulin treatment <12 months 34 History of malignancy of systemic steroid 3 Insufficient data of HbA1c
67 HbA1c <0.7%