This is an Open Access article distributed under the terms of the Creative Commons At- tribution Non-Commercial License (http://creativecommons.org/licenses/by-nc/3.0/) which permits unrestricted non-commercial use, distribution, and reproduction in any medium, provided the original work is properly cited.
A Retrospective Study on the Efficacy of a Ten-
Milligram Dosage of Atorvastatin for Treatment of Hypercholesterolemia in Type 2 Diabetes Mellitus Patients
Dong Kyun Kim1, Sa Rah Lee1, Min Sik Kim1, Suk Hyang Bae1, Jin Yeon Hwang1, Jung-Min Kim1, Sung Hwan Suh3, Hye-Jeong Lee2, Mi Kyoung Park1, Duk Kyu Kim1
Departments of 1Internal Medicine and 2Pharmacology, Dong-A University Medical Center, Dong-A University College of Medicine, Busan,
3Department of Internal Medicine, Samsung Medical Center, Sungkyunkwan University School of Medicine, Seoul, Korea
Background: There have been few clinical studies on 10 mg atorvastatin as a starting dosage for treatment of hypercholesterol- emia in type 2 diabetes mellitus (T2DM) patients. This retrospective study aims to evaluate the efficacy of 10 mg dosage of atorv- astatin in clinical setting.
Methods: One hundred five enrolled patients with high levels of low density lipoprotein cholesterol (LDL-C, > 100 mg/dL) took 10 mg atorvastatin. After 6 months, they were divided into ‘Responder group’ (LDL-C < 100 mg/dL) and ‘Non-responder group’
(LDL-C ≥ 100 mg/dL), and the response rate was calculated. Thereafter, we subdivided the ‘Responder group’ into Maintenance (10 mg), Reduced dosage (5 mg), and Discontinuance group (0 mg). The ‘Non-Responder group’ was subdivided into Mainte- nance (10 mg) and Double dosage group (20 mg). After consecutive 6 months, the response rates of each 10 mg Maintenance groups were compared to those of the other groups, respectively.
Results: Following the first 6 months, the response rate of 10 mg fixed dosage was 74.3%. In the ‘Responder group’, response rates of 10 mg, 5 mg and Discontinuance groups following 6 months were 52.6%, 53.1%, and 12.5%, respectively. In the ‘Non-re- sponder group’, response rates of 10 mg and 20 mg groups were 28.6% and 50.0%. Baseline LDL-C levels and body mass index (BMI) of ‘Responder group’ were significantly lower than those of ‘Non-responder group’ (P = 0.004, respectively).
Conclusion: Hypercholesterolemia treatment with 10 mg, fixed dosage of atorvastatin was effective in three quarters of the sub- jects during the first 6-month treatment; however, a significant number of patients with high LDL-C levels and/or BMI require higher starting and maintenance dosage.
Keywords: Atorvastatin; Diabetes mellitus, type 2; Hypercholesterolemia
Corresponding author: Duk Kyu Kim
Department of Internal Medicine, Dong-A University College of Medicine, Dongdaesin-dong, Seo-gu, Busan 602-714, Korea
E-mail: [email protected]
INTRODUCTION
Cardiovascular disease is the leading cause of death in type 2 diabetes mellitus (T2DM) patients [1,2], and the primary cause of cardiovascular disease is atherosclerosis. Hypercholesterol-
emia, in turn, is a major risk factor for atherosclerosis [3].
Hypercholesterolemia is also an important risk factor of di- abetic retinopathy and nephropathy. Therefore, management of hypercholesterolemia is important in the treatment and pre- vention of vascular complications in diabetic patients [4-6].
pISSN 1976-9180 · eISSN 2093-2650
According to the National Cholesterol Education Program Adult Treatment Panel (NECP ATP) III guidelines proposed in 2001, control of low density lipoprotein cholesterol (LDL- C) levels is considered to be the most important aim for pre- vention of diabetic complications such as cardiovascular dis- ease. Because T2DM is considered a cardiovascular disease (CVD) risk equivalent, it is recommended that LDL-C levels remain below 100 mg/dL in diabetic patients with hypercho- lesterolemia [7].
The guidelines were revised in 2004 to propose maintaining LDL-C levels below 70 mg/dL in patients at very high risk for diabetic complications [8]. Updated therapeutic guidelines from the Korean Society of Lipidology and Atherosclerosis (KSLA) proposed similar recommendations. In addition, ther- apeutic recommendations are similar between the Korean Di- abetes Association (KDA) and American Diabetes Association (ADA) [4,5,9].
Although previous studies and guidelines from NCEP, ADA, and KDA have suggested overall recommendation for prescrib- ing lipid lowering agents, or therapeutic goals, there is a lack of information on the practical use of lipid lowering agents, such as recommendations for starting dosage and dosage adjustment.
In practice, a typical statin therapy starting and maintenance dosage of atorvastatin is 10 mg per day [10,11]. It is generally accepted that the therapeutic dosage for statins in the Asian population is lower than in Caucasians for control of hyper- cholesterolemia [12,13]. Thus, we hypothesized that 10 mg atorvastatin dosage may be adequate as a starting and mainte- nance dosage for control of hypercholesterolemia in T2DM patients.
To verify our hypothesis, we evaluated the response rate of a 10 mg atorvastatin fixed dosage after 6 months of treatment.
Additionally, we wanted to know how to adjust the dosage when the target LDL-C levels were achieved, or not, by statin therapy. Thus, we compared the response rate of 10 mg atorv- astatin treatment to the response rates for differently adjusted dosages, all following 6 months of treatment.
METHODS
Subjects
We evaluated the medical records of 415 T2DM patients who were registered at the Diabetic Center of Dong-A University Medical Center (DCDAMC) and had been prescribed atorvas- tatin for treatment of hypercholesterolemia from January 2001
to June 2008.
Inclusion criteria for the subjects were: 1) T2DM patients with hypercholesterolemia (LDL-C > 100 mg/dL) who were managed following the lipid-lowering protocol proposed by the DCDAMC, and 2) patients should not have used any lipid- lowering agents during the 2 months prior to enrollment in the study.
Patients with type 1 diabetes mellitus (T1DM), baseline LDL-C levels above 250 mg/dL, primary hyperlipoprotein- emia, thyroid disease, chronic liver disease such as liver cirrho- sis, malignancy, chronic kidney disease and secondary DM with potential effects on their glucose and lipid metabolism, were excluded. T2DM patients who had developed coronary artery disease after 2004 also were excluded.
Among the original 415 T2DM patients, 105 (49 males and 56 females) met the inclusion and exclusion criteria and were enrolled in the study.
Methods
This is a retrospective study to evaluate the efficacy of a 10 mg fixed dosage of atorvastatin for treatment of hypercholesterol- emia in T2DM patients.
All of the enrolled patients were managed according to the lipid-lowering protocol of the DCDAMC.
Atorvastatin protocol set forth by the DCDAMC for treat- ment of hypercholesterolemia with T2DM is as follows:
1) Use atorvastatin 10 mg as a starting dosage and maintain same dosage for a maximum of 6 months.
2) Check fasting lipid profiles every 2 or 3 months during the 6-month therapy period.
3) Responders with LDL-C levels below 100 mg/dL have three options for further management, at the discretion of their physician: A) stop taking atorvastatin, B) reduce dos- age to 5 mg, or C) maintain the 10 mg dosage.
4) Non-responders with LDL-C levels above 100 mg/dL have two options for further management, also at the discretion of the physician: A) maintain a 10 mg dosage, or B) increase dosage to 20 mg.
All the subjects were divided into ‘Responder’ and ‘Non-re- sponder’ after initial 6 months of therapy as the protocol.
To evaluate the efficacy of the 6-month 10 mg atorvastatin treatment, we calculated the response rate, which was defined as the number of responders divided by the number of enrolled patients.
Subjects were divided into Responder and Non-responder
groups following the initial 6-month therapy period, and un- derwent an additional 6 months of treatment per the options set forth in the protocol. Following the second 6 month thera- py period, the ‘Responder group’ was divided into two sub- groups, a Remission maintenance group and a Remission maintenance failure group, according to plasma levels of LDL- C (Fig. 1). Remission was defined as final LDL-C levels main- tained below 100 mg/dL. We then examined the response rates for each subgroup.
The ‘Non-responder group’ was also further divided into two subgroups: a Delayed remission group and Remission failure group (Fig. 1). We then calculated the response rate for each subgroup.
To evaluate the long-term efficacy of the 10 mg atorvastatin dosage, we examined response rates in a 5 year follow-up.
We hypothesized that the response rate would be different according to baseline LDL-C levels and body mass index (BMI).
Thus, we stratified the patients by baseline LDL-C levels and BMI and compared the response rate for each group following the initial 6-month therapy period.
We collected clinical and laboratory data (DM duration, baseline LDL-C, HbA1c, and C-peptide levels, smoking history, hypertension, gender, body weight, height and baseline BMI) from the medical records and compared the data between Re- sponder and Non-responder groups. We compared the clini- cal characteristics between the Remission maintenance group and the Remission maintenance failure group. We also com-
pared the clinical characteristics between the Remission main- tenance group of ‘Responder group’ and Remission failure group of ‘Non-responder group’.
We selected plasma LDL-C levels as a parameter to assess the efficacy of atorvastatin treatment. Data on baseline and follow-up LDL-C levels were collected from medical records.
LDL-C levels were checked every 2 to 3 months according to DCDAMC protocol.
Statistical analysis
Results of our statistical analyses are expressed as the mean and standard deviation, or as percentage, and were calculated using the statistical software package SPSS version 17.0 for Windows (SPSS Inc., Chicago, IL, USA). Baseline demograph- ics and clinical characteristics were analyzed using mean by frequency analysis, compare means with independent samples t-test. Cross tabulation analysis was used to evaluate patients response to atorvastatin and progression profiles. We exam- ined the relationship between LDL-C levels and BMI by corre- lation analysis. Statistical significance was established as a P value less than 0.05.
RESULTS
Baseline demographics and clinical characteristics of the study subjects
Among the 105 enrolled patients, there were 49 men (46.7%)
Fig. 1. Schematic flow diagram of study setting: 105 patients with type 2 diabetes mellitus (T2DM) underwent atorvastatin 10 mg therapy as starting dose for reducing high low density lipoprotein cholesterol (LDL-C) levels (> 100 mg/dL) were enrolled for the study. After 6 months of treatment, the subjects were divided into a responder group (LDL-C < 100 mg/dL) or Non-Respond- er group (LDL-C ≥ 100 mg/dL). Thereafter, the Responder group was subdivided into a Remission maintenance group and Re- mission maintenance failure group. The Non-responder group was subdivided into a Delayed remission group and Remission failure group. Dosage modifications were made following a response to each dosage of atorvastatin.
Responder group (n = 78) LDL-C < 100 mg/dL
(6 mo after)
LDL-C ≥ 100 mg/dL (6 mo after)
LDL-C < 100 mg/dL (6 mo after)
LDL-C ≥ 100 mg/dL (6 mo after) LDL-C < 100 mg/dL
(6 mo after)
LDL-C ≥ 100 mg/dL (6 mo after) Non-responder
group (n = 27)
Remission maintenance group (n = 38)
Remission maintenance failure group (n = 40)
Delayed remission group (n = 9)
Remission failure group (n = 18) Total (n = 105)
and 56 women (53.3%).
The mean subject age was 54 ± 8 years, mean DM duration was 6 ± 5 years, mean baseline LDL-C level was 151 ± 21 mg/
dL, mean HbA1c level was 8.0 ± 1.4%, and mean BMI was 24.9 ± 2.8 (Table 1).
Forty-three patients (41.0%) had hypertension and 20 pa- tients (19.0%) had a history of smoking (data not shown).
Response rate following initial 6-month therapy period with 10 mg atorvastatin
Among the 105 patients, 78 patients had plasma LDL-C levels below 100 mg/dL following 6 months of therapy and were placed in the ‘Responder group’. Thus, the response rate was 74.3%. Twenty-seven patients were placed in the ‘Non-re- sponder group’.
Comparison of baseline demographics and clinical characteristics of the Responder and Non-responder group following the initial 6-month therapy period
Among several parameters that were evaluated, only baseline LDL-C levels and BMI were significantly lower in the ‘Respond- er group’ than in the ‘Non-responder group’ (P = 0.004, respec- tively). Unexpectedly, age, DM duration, and baseline HbA1c levels were not statistically significant factors (Table 2).
Although, the proportion of hypertensive patients was low- er in the ‘Responder group’ (n = 29, 37.2%) than in the ‘Non- responder group’ (n = 14, 59.9%), there was no statistical sig- nificance between them. The proportion of patients with a smoking history was similar in the ‘Responder group’ (n = 15,
19.2%) and ‘Non-responder group’ (n = 5, 18.5%); however, this was also shown to be statistically insignificant.
Response rates in the ‘Responder group’ for the 3 dosage adjustment regimens following the additional 6-month therapy period
Dosages were adjusted according to the response measured following the initial 6 months of therapy, and LDL-C levels were again measured following an additional 6 months of therapy.
In the second 6-month therapy period, the ‘Responder group’
was either administered a 10 mg maintenance dosage (10 mg group), a half dosage atorvastatin (5 mg group), or medication was discontinued (Discontinuance group), as per DCDAMC protocol. The response rates, based on the reference LDL-C level of 100 mg/dL, were 52.6% in the 10 mg group (n = 20 of 38), 53.1% in the 5 mg group (n = 17 of 32), and 12.5% in the Discontinuance group (n = 1 of 8) (Table 3).
Response rates in the ‘Non-responder group’ for the 2 dosage adjustment regimens following the additional 6 months of therapy
The ‘Non-responder group’ received either a 10 mg mainte- nance dosage (10 mg group) or double dosage (20 mg group) for 6 months following the initial 6-month therapy period, per DCDAMC protocol. The response rates were 28.6% in the Table 2. Demographics and clinical characteristics of re- sponder and non-responder groups following 6 months of therapy
Characteristic
Total (n = 105) Responder
(n = 78, 74.3%)
Non- responder
(n = 27, 25.7%) P value
Age, yr 54 ± 9 54 ± 7 0.947
DM duration, yr 6 ± 5 7 ± 5 0.302
Baseline LDL-C, mg/dL 146 ± 17 163 ± 27 0.004
HbA1c, % 8.2 ± 1.5 7.7 ± 1.2 0.151
Insulin, μIU/mL 6.77 ± 6.07 7.58 ± 6.10 0.553 C-peptide, ng/mL 2.17 ± 1.15 1.91 ± 1.01 0.263
Weight, kg 65 ± 10 67 ± 9 0.231
Height, m 1.62 ± 0.07 1.60 ± 0.08 0.148
Body mass index, kg/m2 24.5 ± 2.7 26.2 ± 2.5 0.004 Values are presented as mean ± standard deviation.
DM, diabetes mellitus; LDL-C, low density lipoprotein cholesterol.
Table 1. Demographics and clinical characteristics of the study subjects
Characteristic Total (n = 105)
Mean ± SD Range
Age, yr 54 ± 8 20-70
DM duration, yr 6 ± 5 0-21
Baseline LDL-C, mg/dL 151 ± 21 111-224
HbA1c, % 8.0 ± 1.4 5.9-12.3
Insulin, μIU/mL 6.98 ± 6.06 0.04-35.40
C-peptide, ng/mL 2.11 ± 1.12 0.05-5.42
Weight, kg 65 ± 10 47-103
Height, m 1.62 ± 0.07 1.46-1.81
Body mass index, kg/m2 24.9 ± 2.8 19.5-36.5 SD, standard deviation; DM, diabetes mellitus; LDL-C, low density li- poprotein cholesterol.
Maintenance dosage (n = 6 of 21) and 50.0% in the Double dosage group (n = 3 of 6) (Table 3).
Comparison of baseline demographics and clinical characteristics of each subgroup following the additional 6 months of therapy
We compared clinical characteristics between the Remission maintenance group and Remission maintenance failure group and found no significant differences between the two groups (Table 4).
We also compared clinical characteristics between the Re- mission maintenance group and Remission failure group. We found that in the Remission maintenance group, LDL-C levels and BMI were lower than those of the Remission failure group, with significance (Table 5).
Response rates in the long-term follow-up: 5 years after initial therapy period
Among all enrolled patients, the 5-year long term follow-up was conducted on 28 patients. Some changes in dosage had Table 3. Responses following 12 months of therapy
Responder (n = 78)
Dosage after 6 mo
Response after 12 mo
P value Remission
maintenance group Remission maintenance
failure group Remission maintenance rate (%)
Stop (n = 8) 1 7 12.5
5 mg (n = 32) 17 15 53.1 0.096
10 mg (n = 38) 20 18 52.6
Total 38 40 48.7
Non-responder (n = 27)
Dosage after 6 mo Response after 12 mo
P value Delayed remission group Remission failure group Delayed remission rate (%)
10 mg (n = 21) 6 15 28.6
20 mg (n = 6) 3 3 50 0.326
Total 9 18 33.3
SD, standard deviation; DM, diabetes mellitus; LDL-C, low density lipoprotein cholesterol.
Table 4. Clinical characteristics of remission maintenance group and remission maintenance failure group in responder group following 12 months of therapy
Characteristic
Total (n = 78) Remission
maintenance group (n = 38)
Remission maintenance failure group
(n = 40)
P value
Age, yr 55 ± 8 53 ± 9 0.274
DM duration, yr 6 ± 5 6 ± 5 0.851
Baseline LDL-C, mg/dL 143 ± 17 150 ± 17 0.087
HbA1c, % 8.3 ± 1.6 8.0 ± 1.4 0.313
Insulin, μIU/mL 6.20 ± 6.62 7.32 ± 5.52 0.421 C-peptide, ng/mL 2.21 ± 1.25 2.13 ± 1.07 0.779
Weight, kg 63 ± 8 66 ± 11 0.214
Height, m 1.62 ± 0.07 1.62 ± 0.07 0.867
Body mass index, kg/m2 23.9 ± 2.2 25.0 ± 3.2 0.098 Values are presented as mean ± standard deviation.
DM, diabetes mellitus; LDL-C, low density lipoprotein cholesterol.
Table 5. Clinical characteristics of Remission maintenance group in Responder group and Remission failure group in Non-responder following 12 months of therapy
Characteristic
Total (n = 56) Remission
maintenance group (n = 38)
Remission failure group
(n = 18) P value
Age, yr 55 ± 8 54 ± 7 0.698
DM duration, yr 6 ± 5 6 ± 4 0.723
Baseline LDL-C, mg/dL 143 ± 17 161 ± 27 0.016
HbA1c, % 8.3 ± 1.6 7.8 ± 1.3 0.227
Insulin, μIU/mL 6.20 ± 6.62 8.23 ± 6.50 0.287 C-peptide, ng/mL 2.21 ± 1.25 2.11 ± 1.13 0.765
Weight, kg 63 ± 8 68 ± 9 0.059
Height, m 1.62 ± 0.07 1.61 ± 0.08 0.440
Body mass index, kg/m2 23.9 ± 2.2 26.1 ± 2.6 0.001 Values are presented as mean ± standard deviation.
DM, diabetes mellitus; LDL-C, low density lipoprotein cholesterol.
occurred in 20 of the patients; however, all 28 patients were administered 10 mg atorvastatin during the 3 months imme- diately preceding the 5-year follow-up evaluation.
Of the 28 patients, 20 patients had LDL-C levels below 100 mg/dL, yielding an overall response rate of 71.4%.
In addition, among these 28 patients, 8 patients had been administered 10 mg atorvastatin as a starting and mainte- nance dosage without any change in dosage for the entire 5 years. Seven of those patients had final LDL-C levels below 100 mg/dL; therefore, the 5-year response rate in that group was 87.5% (Fig. 2).
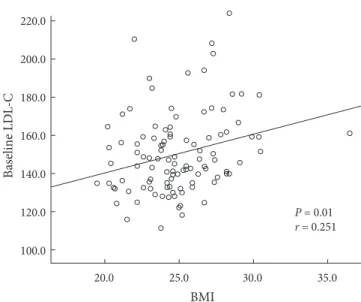
Correlation between statistically significant risk factors Baseline LDL-C levels and baseline BMI were the risk factors which influenced the response rate following 6 months of therapy. There was significant correlation between these two risk factors, and the correlation coefficient was 0.251 (P = 0.01) (Fig. 3).
Six-month therapy response by baseline LDL-C levels and BMI
As the significant risk factors among the baseline clinical char- acteristics were baseline LDL-C levels and BMI, we classified the subjects into 3 subgroups according to baseline LDL-C level (< 130 mg/dL, 130-160 mg/dL, and ≥ 160 mg/dL). Re-
sponse rates following the initial 6-month therapy period were 100%, 72.7%, and 66.7%, respectively (Table 6).
In addition, we also classified the enrolled patients by their WHO BMI classification category. They were divided into 4 categories: baseline BMI (kg/m2) < 18.5 (underweight), 18.5 ≤ baseline BMI (kg/m2) < 25 (normal), 25 ≤ baseline BMI (kg/
m2) < 30 (overweight), and baseline BMI (kg/m2) ≥ 30 (obese).
None of the patients had a baseline BMI below 18.5. Following the initial 6-month therapy period, the responses rates for these groups were 86.4%, 59.5%, and 50% for the normal, overweight, and obese groups, respectively (Table 7).
DISCUSSION
In this study, we found that the response rate to an initial Table 6. Response rate according to stratification by baseline LDL-C level following 6 months of therapy
Baseline LDL-C level, mg/dL
Responder group (n = 78)
Non- responder
group (n = 27)
Response rate (%)
< 130 (n = 12) 12 0 100
130 to 160 (n = 66) 48 18 72.7
≥ 160 (n = 27) 18 9 66.7
LDL-C, low density lipoprotein cholesterol.
Fig. 3. Correlation between baseline low density lipoprotein cholesterol (LDL-C) levels and body mass index (BMI) (two significant risk factors for short-term non-response).There was significant correlation between these two risk factors. The correlation coefficient was 0.251 (P = 0.01).
Baseline LDL-C
BMI
P = 0.01 r = 0.251
20.0 25.0 30.0 35.0
220.0 200.0 180.0 160.0 140.0 120.0
100.0
Fig. 2. Low density lipoprotein cholesterol (LDL-C) profiles during the 5 years following initial therapy with atorvastatin 10 mg. Among 28 patients, 8 patients (A-H) used atorvastatin 10 mg as a starting and maintenance dosage without any change in dosage for the entire 5 year period. Of those 8 pa- tients, 7 had final LDL-C levels below 100 mg/dL. Therefore, for this group, the 5-year response rate to an atorvastatin 10 mg fixed dosage was 87.5%.
LDL-C level (mg/dL)
250
200
150
100
50
0 0 1 2 3 4 5
Follow-up duration (yr) A
B C
D E F
G H
6-month therapy period with atorvastatin 10 mg was 74.3%.
This result is very similar to the 75.5% response rate report by Pola et al. [14], but higher than the 59% reported by Aguilar- Salinas et al. [11]. Aguilar-Salinas’ study, inclusion criteria of enrolled patients was an LDL-C level above 130 mg/dL, which was higher than that of our study (above 100 mg/dL).
We found that baseline LDL-C levels and BMI were signifi- cantly lower in the ‘Responder group’ than in the ‘Non-re- sponder group’, following the initial 6-month therapy period.
This result on LDL-C levels is supported by other reports [15].
Patients with high BMI showed a poor response to the usual dosage of atorvastatin. We demonstrated a significant correla- tion between baseline LDL-C level and baseline BMI; however, the correlation was not strong. If a poor response in patients with high BMI is independent of LDL-C level, the explanation might be simple: a greater fat mass may require a greater amount of statin. However, this explanation need to be further studied and clarified.
The clinical implication of our result is clear: patients with high LDL-C levels and/or high BMI should start treatment with a higher initial dosage of atorvastatin.
Among our subjects were patients with moderate to severe hypercholesterolemia. From the view point of current consen- sus for statin treatment, this group of patients was not indicat- ed for 10 mg atorvastatin treatment. If this group of patients had been excluded from this study, nearly all patients would have shown good response rate.
Nevertheless, the wide range of subjects and results of this study are meaningful, as this group of patients represents the typical range of patients who we meet every day in our clinic.
Our results suggest that three quarters of the patients whom we care for will be responsive to 10 mg fixed atorvastatin dos- age and will reach target LDL-C goals. The quarter of patients with high baseline LDL-C levels and/or high BMI need a high-
er dosage of atorvastatin. If we had excluded the group of pa- tients with moderate to severe hypercholesterolemia from our study, we would not have found the results nearly as useful for our practice.
Guidelines for conditioning therapy in the long term follow- ing successful control of LDL-C with lipid-lowering agents have yet to be established and maintaining the same dosage of medi- cation is the customary practice.
We compared the response rates between the Half-dosage group and Discontinuance group following the additional 6 months of therapy. The response rate was 53.1% in the Half- dosage group, which is similar to reports by others [15]. Even though the response rate of the Half-dosage group is better than that of the Discontinuance group, we do not recommend these kinds of dosage adjustments.
It was unexpected that, in the ‘Responder group’, LDL-C levels increased again to above 100 mg/dL in 47.4% of the 10 mg Maintenance group.
There may be several possible causes for this high rate of maintenance failure. First, the subjects may not have regularly taken their medication. Second, lifestyle modifications may not have been maintained successfully. Third, there may be a secondary failure of atorvastatin.
Dosage up-titration is a common practice with non-respon- sive patients. We compared the response rates of the 10 mg Maintenance group and 20 mg Double dosage group. The re- sponse rate of Double dosage group (50.0%) was better than that of the Maintenance group (28.6%).
We infer that it is necessary to increase the dosage of atorv- astatin by at least double for the ‘Non-responder group’. More- over, if patients do not show a response to a 20 mg dosage, they may need to increase to the maximal dosage of atorvastatin monotherapy [7,8], and a prompt up-titration should also be applied [11,16].
If patients continue to show failure of lipid control with the higher dosage of atorvastatin or experience significant side ef- fects, we should consider adding other lipid lowering agents, such as ezetimibe [17-19].
Under these conditions, it may be worthwhile to investigate whether the patients had primary dyslipidemia or not; howev- er, we did not perform this evaluation.
The 5-year follow-up data from this study are promising.
Even though the number of patients in our study was too small to draw a certain conclusions, in does appear that long-term use of atorvastatin has a favorable lipid-lowering effect. The Table 7. Response rate according to stratification by BMI and
WHO classification following 6 months of therapy
BMI, kg/m2 Responder
group (n = 78)
Non- responder
group (n = 27)
Response rate (%)
18.5 to 24.9 (n = 59) 51 8 86.4
25 to 29.9 (n = 42) 25 17 59.5
≥ 30 (n = 4) 2 2 50.0
No patients had a baseline BMI below 18.5.
BMI, body mass index; WHO, World Health Organization.
5-year LDL-C profiles of the 8 cases who took a 10 mg fixed dosage of atorvastatin during the entire period give us the in- sight that final LDL-C levels within the target range are achiev- able long-term, even though some fluctuations in LDL-C lev- els were noted during that period. The fluctuations in LDL-C levels seem to be related to compliance of the individual pa- tient rather than the efficacy or dosage of medication (Fig. 2).
We could exclude other possibilities such as the effect of con- comitantly using medications or episodes of other diseases.
The results of our study are comparable to those of the Ste- no-2 study, although that study was on total cholesterol, not LDL-C. Nonetheless, the Steno-2 study also showed that about 80% of subjects were controlled. In that study, however, the lipid lowering therapy was more intensive and applied for a longer period than in our study. The lipid lowering agent in the Steno-2 study was also atorvastatin, with a maximum dos- age of 80 mg daily, or the equivalent, and the study duration was 7.8 years [20].
If our results are reliable, we could hypothesize that long- term therapy with atorvastatin for diabetic patients can bring more favorable results in the control of LDL-C levels, even though prompt up-titrations were not applied. This is not the same concept as the legacy effect or metabolic memory. We hypothesized that long-term statin use decreases the size of the LDL-C pool, induces a decrease in serum LDL-C, and helps to maintain stable lipid levels.
This study has some limitations. First, the number of patients that followed the DCDAMC lipid lowering protocol was in- sufficient for us to enroll enough subjects, and this may add bias to our study. Second, we could not confirm that the pre- scribed lifestyle modifications associated with diet or exercise were performed. This may also have an effect on our results.
Third, medical compliance by the enrolled patients was not guaranteed. Finally, medication history from other clinics with- in at least 2 months prior to study initiation was not fully iden- tified, which may have resulted in under-estimation of the base- line or final LDL-C levels.
In conclusion, routine 10 mg fixed dosage atorvastatin ther- apy is effective in about three quarters of T2DM subjects for treatment of hypercholesterolemia, during the first 6 months of therapy.
However, patients with high baseline LDL-C levels and high BMI may need a higher starting and maintenance dosage or even other therapeutic regimens, for better control.
ACKNOWLEDGMENT
This work was supported by the Dong-A University research fund.
REFERENCES
1. Stamler J, Vaccaro O, Neaton JD, Wentworth D. Diabetes, other risk factors, and 12-yr cardiovascular mortality for men screened in the Multiple Risk Factor Intervention Trial. Diabetes Care 1993;16:434-44.
2. Ho JE, Paultre F, Mosca L. Is diabetes mellitus a cardiovascular diseases risk equivalent for fatal stroke in women? Data from the Women’s Pooling Project. Stroke 2003;34:2812-6.
3. Jeong YJ, Ko SK, Park HS, Yang BM. Meta-analysis and econom- ic evaluation for the effect of statins. J Korean Soc Lipidol Ath- eroscler 2004;14:120-30.
4. American Diabetes Association. Position Statement. Manage- ment of dyslipidemia in adults with diabetes. Diabetes Care 2002;25(suppl 1):S74-7.
5. American Diabetes Association. Position Statement. Manage- ment of dyslipidemia in adults with diabetes. Diabetes Care 2001;24(suppl 1):S58-61.
6. Shepherd J, Cobbe SM, Ford I, Isles CG, Lorimer AR, MacFar- lane PW, McKillop JH, Packard CJ. Prevention of coronary heart disease with pravastatin in men with hypercholesterol- emia. West of Scotland Coronary Prevention Study Group. N Engl J Med 1995;333:1301-7.
7. Expert Panel on Detection, Evaluation, and Treatment of High Blood Cholesterol in Adults. Executive Summary of the Third Report of the National Cholesterol Education Program (NCEP) Expert Panel on Detection, Evaluation, and Treatment of High Blood Cholesterol in Adult Treatment Panel(ATP) III. JAMA 2001;285:2486-97.
8. Grundy SM, Cleeman JI, Merz CN, Brewer HB Jr, Clark LT, Hunninghake DB, Pasternak RC, Smith SC Jr, Stone NJ; Na- tional Heart, Lung, and Blood Institute; American College of Cardiology Foundation; American Heart Association. Impli- cations of recent clinical trials for the National Cholesterol Ed- ucation Program Adult Treatment Panel III guidelines. Circu- lation 2004;110:227-39.
9. National Cholesterol Education Program. Second report of the Expert Panel on Detection, Evaluation, and Treatment of High Blood Cholesterol in Adults (Adult Treatment Panel II). Cir- culation 1994;89:1333-445.
10. Choi DS, Kim DK, Kim DM, Kim SY, Nam MS, Park YS, Shon HS, Ahn CW, Lee KW, Lee KU, Lee MK, Chung CH, Cha BY, and 83 investigators. Efficacy evaluation of atorvastatin in Ko- rean hyperlipidemic patients with type 2 diabetes mellitus. J Korean Diabetes Assoc 2006;30:292-302.
11. Aguilar-Salinas CA, Gomez-Perez FJ, Posadas-Romero C, Vazquez-Chavez C, Meaney E, Gulias-Herrero A, Guillen LE, Alvarado Vega A, Mendoza Perez E, Eduardo Romero-Nava L, Angelica Gomez-Diaz R, Salinas-Orozco S, Moguel R, Novoa G. Efficacy and safety of atorvastatin in hyperlipidemic, type 2 diabetic patients. A 34-week, multicenter, open-label study.
Atherosclerosis 2000;152:489-96.
12. Liao JK. Safety and efficacy of statins in Asians. Am J Cardiol 2007;99:410-4.
13. Lee E, Ryan S, Birmingham B, Zalikowski J, March R, Ambrose H, Moore R, Lee C, Chen Y, Schneck D. Rosuvastatin pharma- cokinetics and pharmacogenetics in white and Asian subjects residing in the same environment. Clin Pharmacol Ther 2005;
78:330-41.
14. Pola P, Kumar R, Reddy AP, Rajagopal G, Harinarayan CV, Suresh V, Suchitra MM, Sachan A. Efficacy of low dose atorv- astatin in diabetic dyslipidemia. J Indian Med Assoc 2009;
107:807-9.
15. Cho SW, Lee WR, Lee SY, Namkung J, Do JH. How does atorv- astatin 5 mg, simvastatin 10 mg as maintenance therapy meet the therapeutic goal of NCEP ATP III? Korean J Med 2005;69 (suppl 1):S117.
16. Atorvastatin Study Group in Korea. Flexible initial dosing of atorvastatin based upon initial low-density lipoprotein choles- terol levels in type 2 diabetic patients. Korean J Intern Med 2008;23:22-9.
17. Bae JW, Kim HS, Lee SC, Han KH, Jeon ES. The safety and effi- cacy of ezetimibe and simvastatin combination therapy in Ko- reans patients with primary hypercholesterolemia. Korean J Med 2005;68:487-97.
18. Yi MY, Bae JW, Hwang KK, Kim DW, Cho MC. The effect of dual inhibition of cholesterol in hyperlipidemia patients with acute myocardial infarction. Korean J Med 2008;74:59-67.
19. Villa J, Prately RE. Ezetimibe/simvastatin or atorvastatin for the treatment of hypercholesterolemia in patients with the met- abolic syndrome, the VYMET study. Curr Diab Rep 2010;
10:173-5.
20. Gaede P, Vedel P, Larsen N, Jensen GV, Parving HH, Pedersen O. Multifactorial intervention and cardiovascular disease in patients with type 2 diabetes. N Engl J Med 2003;348:383-93.