770 http://dx.doi.org/10.9713/kcer.2015.53.6.770
PISSN 0304-128X, EISSN 2233-9558
Thermodynamic and Isothermal Studies of Congo RedAdsorption onto Modified Bentonite
Basava Rao. V. V.**, and Mohan Rao. T*,†
*Associate Prof., Dept. of Chemical Eng., Bapatia Engineering College, A. P., India.
**Dean, Faculty of Technology, University College of Technology, OU, India.
(Received 8 August 2015; Received in revised form 5 October 2015; accepted 5 October 2015)
Abstract − Adsorption of Congo Red (CR) from dye-containing effluents using modified bentonite (MB) has been investigated here. Isothermal studies were conducted to ascertain maximum adsorption capacity of the adsorbent. MB exhibited superior adsorption capacity compared to other low-cost adsorbents. Experimental data fitted the Langmuir isotherm better, indicating monolayer coverage of CR on MB. The feasibility of the process was measured in terms of separation factor RL. The values of Gibbs free energy, entropy and enthalpy were calculated from the thermodynamics of the process. Adsorption was feasible and spontaneous, being endothermic. Analytical techniques including SEM, EDS, FTIR and XRD were applied to characterize MB and also to provide conclusive proof of the accumulation of CR on to MB.
Key words: Congo red, Bentonite, Isotherms, Thermodynamics, XRD, SEM, FTIR
1. Introduction
As earth’s population continues to grow, pollution by human activities is becoming a major global concern. Pollution from toxic chemicals, especially those of anthropogenic origin, threatens life on this planet. The textile industry is one of the most prolific polluters in the world. Around 20% of global water pollution comes from textile dyeing with an exit of 72 toxic chemicals [1]. Dyes are particularly resistant to treatment, defying bio- as well as photo-degradation and persisting in the environment.
Congo red (CR) is one such carcinogen with a complex chemical structure (C32H22N6Na2O6S2) and high molecular weight (696.66).
This diazo dye is water-soluble, forming a red colloid, but has higher affinity for organic solvents.Apart from its usage as a dye, CR is also a pH indicator and cell staining agent. However, its application as a dye is reducing due to its highly toxic and recalcitrant nature [2].
Hence, removal of CR from waste water is a challenge often faced by environmental chemists and engineers, requiring advanced treat- ment [3].
Adsorption is the commonest among all dye removal methods due to high efficiency and lower cost compared to other methods like reverse osmosis and ultrafiltration. Selection of the adsorbent plays a vital role in the cost of removal. Apart from being economical, it must be efficient and abundantly available for regular industrial applica- tion [4].
Currently, a number of studies have reported on the use of many natural materials such as zeolites [5, 6], clays [7-9], coal [10,11] and plant biomass [12-16] for decolorization of dye-containing efflu-
ents. These have been classified as low-cost sorbents since their ini- tial cost is very low and they are locally available materials [17].
Among these, clay minerals have found widespread application as adsorbents. Clay minerals composed of tetrahedral and octahedral cationplanes occur naturally at the earth’s near surface environments [18]. They have been known to mankind for thousands of years. Clay minerals have played a key role in the cultural and industrial devel- opment of mankind. Around 5000 B.C., they were used for the cleaning of animal skins and hides [19]. For thousands of years, clays have been used for making pottery, brick, and other building materials. Man’s use of expanding clays such as bentonite began later. Today, there are hundreds of uses for clay minerals in a variety of products ranging from pet litter to pharmaceuticals [20].
Some clay minerals like kaoline, bentonite, and clinoptilolite pos- sess unique properties that make them suitable for a broad range of scientific, industrial and consumer applications. Their applications are as diverse as the industries that utilize them [21].
Though all clay minerals have similar compositions, bentonite is superior with its unique cation chemistry andsurface area. It is mainly composed of montmorillonite with a chemical composition of SiO2, Al2O3, CaO, MgO, Fe2O3, Na2O, K2O. It is a 2:1 type aluminosili- cate, the unitlayer structure of which consists of one A13+ octahedral sheet between two Si4+ tetrahedral sheets [22]. It exhibits volumetric expansion and strong colloidal properties in aqueous phase. These unique properties make it suitable for many applications [23].
The desirable properties of bentonite can be further improved by activation. In an earlier study, bentonite was modified with CaCl2, and used to remove CR from the textile industry effluent [24]. Several other studies have reported the successful removal of CR through adsorption onneem (Azadirachtaindica) leaf powder [25], chitosan hydrobeads [26], waste orange peel [27], and coal-based activated carbons [28]. This indicates that use of modified bentonite for the
†To whom correspondence should be addressed.
E-mail: [email protected]
This is an Open-Access article distributed under the terms of the Creative Com- mons Attribution Non-Commercial License (http://creativecommons.org/licenses/by- nc/3.0) which permits unrestricted non-commercial use, distribution, and reproduc- tion in any medium, provided the original work is properly cited.
removal of CR needs to be explored from research as well as application points of view. The present study was, thus, undertaken to address this gap in our collective knowledge.
A detailed literature review was conducted to find various pollut- ants that had been successfully removed by bentonite in its raw or modified forms. Similarly, various adsorbents used to remove CR from effluents were also listed. Isothermal and thermodynamic stud- ies ascertained the nature and gained an insight into the mass trans- fer process. Characterization was done to support the observation with evidence and help identify the functional groups responsible for the binding process.
2. Materials and Methods 2-1. Congo red
Congo red (CR) was supplied by M/S. Merck Chemicals, India (CI=22120); chemical formula:
C32H22N6Na2O6S2; nature:
anionic direct diazo;
Molecular weight: 696.66.2-2. Modified bentonite
Concentrated H2SO4was added to bentonite powder in 1:1 w/v ratio and kept in hot air oven at 110oC for 12 hours. It was taken out, washed and then soaked in 2% NaHCO3 solution for the same period to expel the residual acid. pH of the material was brought to neutral by washing with distilled water several times. It was again dried for a day and then stored in an air-tight container.
2-3. Instruments used
Analytical Balance: SHIMADZU - AX200 pH meter: ELICO-L1 612
Temperature-controlled Orbital Shaker: REMI - CIS 24 BL Centrifuge: REMI C 24
UV-Visible Spectrophotometer: SYSTRONICS - 117
2-3-1. Characterization
The surface morphology examination and elemental analysis of MB was conducted by scanning electron microscopy (SEM, Carl Zeiss, EVO-18) equipped with Energy Dispersive X-ray Spectroscopy (EDS) analyzer. IR spectra of Modified Bentonite (MB) was obtained with a SHIMADZU, FTIR 8400S Fourier transform infrared spectrome- ter (FTIR). X-ray diffraction patterns were recorded by SHIMADZU XRD 7000 using Cu Kα radiation.
The adsorbent performance was measured in terms of uptake (qt) and percent removal (%R),which were calculated using the follow- ing equations:
(1)
(2)
where C0 is the initial CR concentration (mg/1), Ct is the concen-
tration of CR at time t, (mg/L), V is the volume of dye solution (L) and m is the mass (g) of the adsorbent.
3. Theory
3-1. Adsorption Isotherms
Isotherms are used to estimate the maximum adsorption capacity of a material in removing pollutant from the effluent. The character- istics and the interaction between two phases can be inferred from the shape of the equilibrium isotherm. Usually, it is derived from equi- librium data collected at different influent concentrations [29,30].
Solid/liquid interphase behavior can be described by various iso- therm models. In general, the Langmuir and Freundlich isotherm equations are broadly used for interpretation of adsorption data obtained.
3-1-1. Langmuir isotherm equation
This is the simplest and the most widely used expression based on the assumption of homogeneous adsorption sites, with each site accom- modating one molecule or one atom of zero interaction with each other; adsorption is through monolayer coverage. The Langmuir iso- therm is represented by equation [31].
(3)
Its linear expresson is
(4)
where qe is the amount of dye adsorbed per unit mass of adsorbent (mg/g), Ce is the equilibrium dye concentration (mg/L), qmax and b are the Langmuir constants representing the monolayer adsorp- tion capacity (mg/g) and the energy of adsorption (L/mg), respec- tively. qmax and b are calculated from the slopes and intercepts of the straight lines of the plot of 1/qe versus 1/Ce.
3-2. Freundlich isotherm model
The Freundlich model is not restricted to the formation of a mono- layer and is based on sorption on a heterogeneous surface. The well- known expression for the Freundlich model is [32].
(5) where Kf and n are the Freundlich constants that indicate adsorp- tion capacity and adsorption intensity, respectively. The linearized form of the Freundlich isotherm can be written as,
(6) The values of Kf and n can be calculated by plotting lnqeversus lnCe. Kf (unit:mg/g) can be used as an alternative measure of adsorp- tive capacity, while 1/n (1/mg) determines the adsorption intensity.
It is also possible to predict the possibility of separation by adsorp- tion by calculating the separation factor ‘RL’, which can be deter- qt (C0–Ct)
---Vm
=
%R (C0–Ct) C0 ---100
=
qe qmaxbCe 1 bC+ e ---
=
1 qe ---- 1
qmax --- 1
bqmaxCe --- +
=
qe=KfCe1/n
qe
ln =lnKf+1/n Cln e
mined from the following equation [33]:
(7)
where KL is the Langmuir constant and Co is the highest initial dye concentration. This isotherm is (i) unfavorable when RL>1, (ii) linear when RL= 1, (iii) favorable when RL<1, and (iv) irrevers- ible when RL= 0.
3-3. Adsorption thermodynamics
Thethermodynamic feasibility of aprocess depends on the values of standard free energy (ΔG0), enthalpy change (ΔH0) and entropy change (ΔS0), which can be determined by using the following equa- tions [34]:
(8)
(9)
(10)
where Kc is the equilibrium constant, and CA and Cs are equilib- rium concentrations (mg/g) of the dye in solid andliquid phases, respectively, T is the temperature in Kelvin and R is the gas con- stant [35].
4. Results and Discussion
4-1. Adsorption isotherms
Experiments were conducted by taking 50 ml of effluent atdiffer- ent concentrations (10~1000 mg/L) and a dosage of 0.1 g of benton- ite was added to each. The mixture wasagitated at 303 K, up to the equilibrium condition. The data obtained was fitted to linear forms (Eq. 4 and 6) of both Langmuirand Freundlich isotherms, the plots
were prepared (Fig. 1 and 2, respectively) and the parameters calcu- lated (Table 1). Both of the expressions fit well for the data, with high correlation coefficients (greater than 0.97), but Langmuir exhibited a better fit with the R2 value of 0.992. Maximum adsorption capacity that was calculated from the Langmuir isotherm was333.33 mg/L, proving the efficiency of MB inremoving CR from aqueous solutions.
The values of RL calculated from the experimental data and Lang- muir constant (Equation 7) are in the range of 0.03~0.55, indicating that adsorption is favorable.
4-1-1. Adsorption thermodynamics
Experiments were conducted at five different temperatures 293.15, 303.15, 313.15, 323.15 and 333.15 K with two different effluent concentrations (20 and 60 mg/L)and0.1 g MB. Equilibrium constant was calculated from equilibrium concentrations of both phases at each temperature. From these values,a plot of lnKc as a function of 1/
T was generated. Fig. 3 represents this plot. From the slope andinter- cept of lines presented in Fig. 3, thermodynamic parameters ΔG0, ΔH0 and ΔS0 were calculated using Equations 8, 9 and 10, values of which are presented in Table 2.
The increase in Gibbs free energy values with temperature indi-
RL 1
1 K+ LCo ---
=
Kc CA Cs ---
=
ΔGo=–RTlnKc
Kc
ln ΔGo
---RT
– ΔHo
--- ΔRT So ---R +
= =
Fig. 1. Langmuir Isotherm for Adsorption of CR using MB at 303.15 K, pH 6.0, adsorbent dose 0.1 g and contact time 180 min.
Fig. 2. Freundlich Isotherm for adsorption of CR using MB at 303.15 K, pH 6.0, adsorbent dose 0.1 g and contact time 180 min.
Table 1. Adsorption Isotherm Constants for CR Removal using MB
Isotherm Langmuir isotherm Freundlich isotherm
Parameters qmax (mg/g) B L/mg R2 RL Kf n R2f
333.33 0.003995 0.992 0.03-0.55 16.58336 2.485 0.974
Fig. 3. lnKc vs. 1/T for estimation of thermodynamic parameters at pH 6.0, adsorbent dose 0.1 g and contact time 180 min.
cates an increase in the feasibility of absorption at higher tempera- tures. It may be due to swelling of pores at high temperature, leading to a high rate of diffusion. The negative ΔGo values indicate the sponta- neous nature of the process, which increased with temperature.
The magnitude of the enthalpy change (ΔHo) provides informa- tion about the type of sorption. If change in enthalpy is in the range of 2.1~20.9 kJ/mol, adsorption is considered to be physical, while if it falls in the range of 80~200 kJ/mol, the process is assumed to be chemisorption. ΔHo values obtained for 20 and 60 mg/L samples were 28.71656 and 29.74749 kJ/mol, respectively. These positive values of enthalpy indicate that the process is endothermic in nature. These values are close to the range of physisorption, indicating the involve- ment of weak physical forces in the binding process. The ΔSo values were 0.1120 and 0.1178 kJ/mol for 20 and 60 mg/L samples, respec- tively. The positive values of entropy indicate an increase in random- ness at the interface.
We did a detailed literature review to find various pollutants that were successfully removed by bentonite in its raw or modified forms,
results of which are presented in Table 3. Similarly, various adsor- bents used to remove CR from water effluents are presented in Table 4.
MB with a maximum uptake of 333.3 mg/g proved to be the most efficient among all the other materials.
4-2. Characterization
Scanning electron microscopy (SEM) was used to study the surface morphology. SEM image (Fig. 4) for MB shows particles of irregu- Table 2. Thermodynamic Parameters for the Adsorption of CR on MB
Temp, oK ΔGo, kJ/mol ΔHo, kJ/mol ΔSo, kJ/mol
Concentration 60 mg/L 20 mg/L 60 mg/L 20 mg/L 60 mg/L 20 mg/L
293.15 -4.788 -4.13762
29.74749 28.71656 0.1178 0.112073
303.15 -5.966 -5.25835
313.15 -7.144 -6.37908
323.15 -8.322 -7.4998
333.15 -9.5 -8.62053
Table 3. Adsorption Capacities of Bentonite used in the Removal of Different Pollutants
Adsorbent Solute Capacity, mg/g Ref.
CaCl2 modified bentonite Congo red 227.27 [3]
Naturalbentonite Hydroxyl quinoline 120 [36]
Na-bentonite Reactive Yellow 2 67 [37]
CTS-CTAB-Bentonite weak acid scarlet 175 [38]
Chitosan/bentonitecomposite matrix Thorium (IV) 126 [39]
AMP-bentonite composite Humic acid 121 [40]
Chitosan immobilized on bentonite Copper, lead, and nickel 28,20,12 [41]
Yellowbentonite 2-NP, 4-NP, and 2,4-DNP 3.34, 6.2, 4.31 [42]
Table 4. Adsorption Capacities of Congo RedDye on Various Adsorbents
Adsorbent Capacity (mg.g-1) Reference
CaCl2 modified bentonite 227.27 [24]
Coir Pitch 6.72 [43]
Red mud 4.05 [44]
Azadirachtaindica Leaf powder 41.2-28.3 [25]
Fly ash 4.13 [45]
Chitosan hydrobeads 93.40 [26]
Waste orange peel 22.44 [27]
Coal-based activated carbons 52-189 [28]
Fig. 4. SEM Image for MB at magnification of 10 K and 50 K.
lar agglomerates, with a porous network and extended textural surface.
The particle size is uneven and relatively small.
The chemical composition of MB and CR-loaded MB was obtained by EDS analysis, results of which are in Table 5. MB is composed of silica and alumina as major constituents along with traces of magnesium and potassium, due to which it was expected to play a key role in dye uptake. The presence of carbon, sodium, nitro- gen and sulfur in the CR-loaded sample confirmed the transfer of CR from aqueous phase on to MB, as these elements were absent in the MB sample.
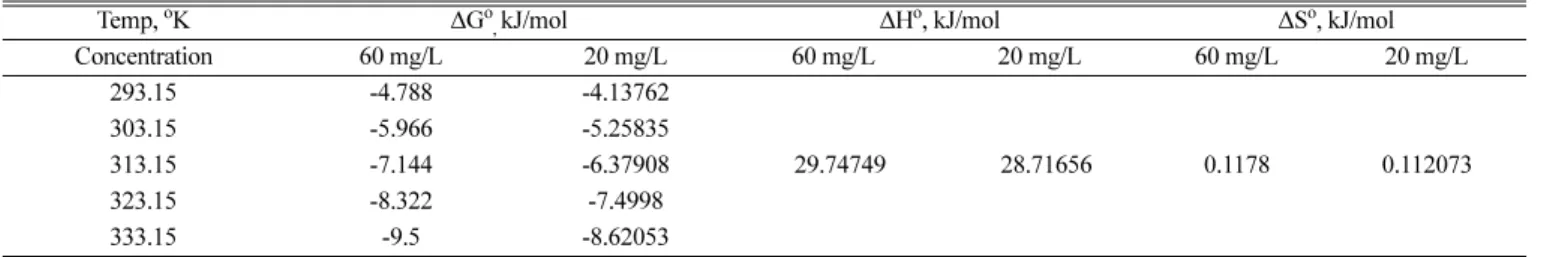
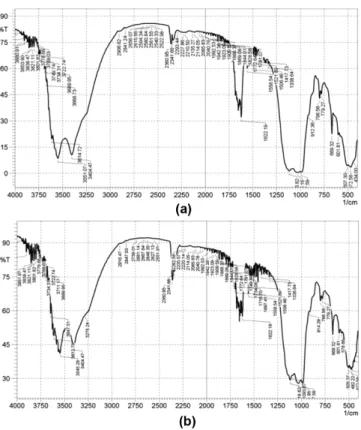
FTIR spectra for both samples (before and after adsorption) were taken to understand the surface changes during the sorption process.
A dry sample of powder (about 0.1 g) was mixed with KBr and pressed into tablet form. The recorded FT-IR spectrum has been depicted in Figures 5(A) and 5(B). Broad peaks were observed at
3545, 3404, 1116 and 1093 cm-1, while medium peaks were seen at 2360, 1622, 505 and 482 cm-1. These indicate OH stretching and vibration in Al-Al-OH, Si-O stretching, Si-O-Al stretches and Si-O- Si bending. These are indications of the key role of aluminium and silicon oxides in the sorption process. The peak intensity of MB and CR loaded MB is compared in Table 6. Percent transmittance (% T) for CR loaded MB was lower than that of MB alone, by a difference ranging from 25-30% T. This is acceptable evidence for adsorption of CR on MB.
XRD analysis was used to confirm CR adsorption on MB. XRD patterns of MB before and after adsorption are displayed in Fig. 6.
Table 5. Elemental analysis for MB
Element Before Adsorption After Adsorption Weight % Atomic % Weight % Atomic %
O 57.28 69.8399 39.31 34.73
Mg 5.138 4.1218 2.66 1.5493
Al 5.1499 3.7242 0.0518 0.0202
Si 31.3978 21.8014 0.145 0.0708
K 1.029 0.5126 1.5123 0.5468
C 39.734 46.7645
N 15.765 15.9088
Na 0.2072 0.1316
S 0.631 0.2734
Fig. 5. (a) FTIR Spectrum before adsorption of CR on MB, (b) FTIR Spectrum after adsorption of CR on MB.
Table 6. Comparison of peak intensities of MB and CR loaded MB from FT-IR Spectra
Peak location Peak intensity, % Transmittance wave length, cm-1 MB CR loaded MB Difference
482 35.031 3.448 31.583
505 34.763 4.249 30.514
1622 57.44 32.151 25.289
1093 31.372 0.415 31.957
1116 29.3 1.179 28.121
3404 44.48 10.444 34.036
3545 41.355 8.526 32.829
Fig. 6. (A) XRD spectrum for MB before CR loading, (B) XRD spec- trum for MB after CR loading.
An increase in the basal spacing of MB was observed after adsorp- tion of CR, which indicates intercalation of CR into the clay galler- ies. The changes in peak positions are due to ionic bondage with CR molecules at MB surface. These indicate the adsorption of the dye on MB.
5. Conclusions
Modified bentonite proved to be a promising alternative to com- mercial activated carbon with an adsorption capacity of is 333.33 mg/g, which is much higher than that of other low cost adsorbents such as leaf powder, coir pith, fly ash, and even coal-based activated carbons. Experimental data fitted the Langmuir isotherm better, indi- cating monolayer coverage of CR on MB. Adsorption was thermo- dynamically favorable with RL values less than 1. The process was endothermic with positive values of enthalpy. Randomness increased at the interface and the process was found to be spontaneous. SEM- EDS displayed MB as agglomerated particles with Al2O3 and SiO2 as the major components. Decrease in energy level in FTIR and shift of XRD peaks confirmed the accumulation of CR on to MB.
References
1. Water pollution, accessed August 20, 2015, http://www.sustain- ablecommunication.org/eco360/what-is-eco360s-causes/water- pollution.
2. Telke, A. A., Joshi, S. M., Jadhav, S. V., Tamboli, D. P. and Gov- indwar, S. P., Biodegradation, 21(2), 283(2010).
3. Han, R., Ding, D., Xu, Y., Zou, W., Wang, Y., Li, Y. and Zou, L., Bioresource Technol., 99, 2938(2008).
4. Hu, Q. H., Xu, Z. P. and Qiao, S. Z., J. Colloid Interface Sci., 308(1), 191(2007).
5. Wang, C., Li, J., Wang, L., Sun, X. and Huang, J., Chin. J. Chem.
Eng., 17, 513(2009).
6. Alver, E. and Metin, A. U., Chem. Eng. J., 200, 59(2012).
7. Errais, E., Duplay, J., Darragi, F., M’Rabet, I., Aubert, A., Huber, F. and Morvan, G., Desalination, 275, 74(2011).
8. Errais, E., Duplay, J., Elhabiri, M., Khodja, M., Ocampo, R., Balten- weck-Guyot, R. and Darragi, F., Colloid Surf. B, 403, 69(2012).
9. TunaliAkar, S. and Uysal, R., Chem. Eng. J., 162, 591(2010).
10. Hsu, T. C., Fuel, 87, 3040(2008).
11. Rusu, L., Harja, M., Simion, A. I., Suteu, D., Ciobanu, G., Favier, L., Korean J. Chem. Eng., 31(6), 1008(2014).
12. Mao, J., Won, S. W., Min, J. and Yun, Y. S., Korean J. Chem.
Eng., 25, 1060(2008).
13. Kumar, G. V., Ramalingam, P., Kim, M. J., Yoo, C. K. and Kumar, M. D., Korean J. Chem. Eng., 27, 1469(2010).
14. Mehmood, A., Bano, S., Fahim, A., Parveen, R. and Khurshid, S., Korean J. Chem. Eng., 32, 882 (2015).
15. Lafi, R., Fradj, A., Hafiane, A. and Hameed, B. H., Korean J. Chem.
Eng., 31, 2198 (2014).
16. Gaikwad, R. W. and Kinldy, S. A. M., Korean J. Chem. Eng., 26, 102(2009).
17. Khan, A., Badshah, S. and Airoldi, C., Colloid Surf. B, 87, 88(2011).
18. Clays and minerals, accessed August 20,2015, http://www.clay- sandminerals.com/.
19. Robertson, R. H. S., Fuller’s Earth: a History of Calcium Mont- morillonite,Volturna Press, Hythe, Kent, England(1986).
20. Odom, I. E., Commercial Uses of Clay Minerals, American Col- loid Company, Arlington Heights, IL(1989).
21. Minerals and Ores-Applications, accessed August 20, 2015, http://
www.sorptive.org/applications/.
22. Li, Q., Yue, Q. Y., Sun, H. J., Su, Y. and Gao, B. Y., J. of Environ.
Manage., 91, 1601(2010).
23. Rahman, A., Urabe, T. and Kishimoto, N., Procedia Environ. Sci., 17, 270(2013).
24. Lian, L., Guo, L. and Wang, A., Desalination, 249, 797(2009).
25. Bhattacharyya, K. G. and Sharma, A., J. Environ. Manage., 71(3), 217(2004).
26. Chatterjee, S., Colloids Surf. A Physicochem. Eng. Asp., 299(1-3), 146(2007).
27. Deo, N. and Ali, M., Indian J.Environ. Prot., 13(7), 496(1993).
28. Lorenc-Grabowskaa, E. and Gryglewicz, G., Dyes Pigm., 74(1), 34(2007).
29. Wong, Y. C., Szeto, Y. S., Cheung, W. H. and McKay, G., Langmuir, 19, 7888(2003).
30. Duong, D. D., Adsorption Analysis: Equilibria and Kinetics, Impe- rial College Press, London(1998).
31. Tien, C., Adsorption Calculations and Modeling, Butterworth- Heinemann, Boston(1994).
32. Ozcan, A., Oncu, E. M. and Ozcan, A. S., J. Hazard. Mater., 129 (1-3), 244(2006).
33. Khattri, S. D. and Singh, M., Ind. Chem. Technol., 6, 112(1999).
34. Liu, Y. and Liu, Y. J., Sep. Purif. Technol., 61, 229(2008).
35. Xia, C., Jing, Y., Jia, Y., Yue, D., Ma, J. and Yin, X., Desalina- tion, 265, 81(2011).
36. Erdem, B., Ozcan, A. and Ozcan, A. S., Appl. Surf.Sci., 256, 5422 (2010).
37. SafaOzcan, A., Erdem, B. and Ozcan, A., J. Colloid Interface Sci., 280, 44(2004).
38. Guo, J., Chen, S., Liu, L., Li, B., Yang, P., Zhang, L. and Feng, Y., J. Colloid Interface Sci., 382, 61(2012).
39. Anirudhan, T. S., Rijith, S. and Tharun, A. R., Colloids and Surfaces A: Physicochem. Eng. Aspects, 368, 13(2010).
40. Anirudhan, T. S., Suchithra, P. S. and Rijith, S., Colloids Surf. A, 326, 147 (2008).
41. Futalana, C. M., Kan, C. C., Dalidac, M. L., Hsien, K. J., Pascua, C.
and Wan, M. W., Carbohydr.Polym., 83, 528(2011).
42. Yaneva, Z. and Koumanova, B., J. Colloid Interface Sci., 293, 303(2006).
43. Namasivayam, C. and Kavitha, D., Dyes Pigm., 54(1), 47(2002).
44. Namasivayam, C. and Arasi, D. J. S. E., Chemosphere, 34(2), 401 (1997).
45. Rao, V. V. B. and Rao, S. R. M., Chem. Eng. J., 116(1), 77(2006).