Leptin DNA Methylation and Its Association with Metabolic Risk Factors in a Northwest Indian Obese Population
Sadashiv1,2,3,*, Anupama Modi2, Manoj Khokhar2, Praveen Sharma2, Rajnish Joshi4, Sudhanshu Shekhar Mishra3, Rajay N Bharshankar3, Sunita Tiwari5, Pankaj Kumar Singh6, Vivek Vidyadhar Bhosale7, Mahendra Pal Singh Negi7
1Department of Biochemistry, All India Institute of Medical Sciences Raebareli, Raebareli; 2Department of Biochemistry, All India Institute of Medical Sciences Jodhpur, Jodhpur; 3Department of Physiology, All India Institute of Medical Sciences Bhopal, Bhopal; 4Deparment of General Medicine, All India Institute of Medical Sciences Bhopal, Bhopal; 5Department of Physiology, King George’s Medical University, Lucknow; 6Department of Biochemistry, All India Institute of Medical Sciences Bibinagar, Bibinagar; 7Toxicology and Experimental Medicine Division, CSIR-Central Drug Research Institute, Lucknow, India
Background: It is well established that obesity is a major health risk in diabetes and associated diseases. Epi- genetic changes, specially DNA methylation, play an important role in regulation of adipokines. The objective of the present study was to evaluate the DNA methylation status at the promoter region of the leptin gene in obese individuals and its association with metabolic risk factors.
Methods: The study included obese (n=100) and non-obese (n=75) individuals aged 25–45 years, and mea- sured their physical, biochemical parameters (glucose, insulin, and lipid profiles) and leptin, DNA methyltransfer- ase 1 (DNMT1), and DNA methyltransferase 3 beta (DNMT3b) mRNA expressions with real-time reverse tran- scription-polymerase chain reaction (qRT-PCR). DNA methylation of the leptin gene at the promoter region was analyzed by methyl-specific qPCR .
Results: The study found that the DNA methylation level at the promoter area of the leptin gene was negative- ly associated with weight in obese subjects. Furthermore, study findings showed that the DNA methylation level was negatively associated with fasting insulin, glucose, homeostatic model assessment for insulin resistance, and total cholesterol. There was also a higher expression of DNMT1 and DNMT-3b in obese subjects as com- pared with non-obese subjects.
Conclusion: The leptin epigenetic profile may be associated with obesity and its associated metabolic risk fac- tors.
Key words: DNA methylation, DNA methyltransferase, Leptin, Obesity
Received December 8, 2020 Reviewed June 22, 2021 Accepted June 23, 2021
* Corresponding author Sadashiv
https://orcid.org/0000-0002-6232-1622 Department of Biochemistry, All India Institute of Medical Sciences Raebareli, UP 229405, India
Tel: +91-535-270-4400 Fax: +91-535-270-4400 E-mail: [email protected]
INTRODUCTION
Obesity is a long-standing condition1 that “results from the inter- action between genetic factors with environmental influences”.2 An overflow of triglycerides (TGs) in adipose tissue due to an imbal- ance between energy intake and expenditure causes obesity.3 The World Health Organization estimates that 39% of the world adult population is overweight and 13% is obese. Around 3.0 million in-
dividuals die each year from obesity-associated complications.
Obesity is now considered a key risk factor for a broad range of dis- eases such as type 2 diabetes, cardiovascular disease, and cancer.4 In 2015, an estimated 1.6 million deaths were caused by diabetes.5
Adipose tissue expresses leptin, a 16 kDa protein6 that works like a hormone and changes whole body energy homeostasis by con- trolling appetite. The arcuate nucleus in the hypothalamus has a leptin receptor where leptin acts like a hormone and maintains en-
Copyright © 2021 Korean Society for the Study of Obesity
This is an Open Access article distributed under the terms of the Creative Commons Attribution Non-Commercial License (https://creativecommons.org/licenses/by-nc/4.0/) which permits unrestricted non-commercial use, distribution, and reproduction in any medium, provided the original work is properly cited.
eISSN 2508-7576
2017-03-16 https://crossmark-cdn.crossref.org/widget/v2.0/logos/CROSSMARK_Color_square.svg
Original Article
Leptin DNA Methylation and Its Association with Metabolic Risk Factors in a Northwest Indian Obese Population
Sadashiv1,2,3,*, Anupama Modi2, Manoj Khokhar2, Praveen Sharma2, Rajnish Joshi4, Sudhanshu Shekhar Mishra3, Rajay N Bharshankar3, Sunita Tiwari5, Pankaj Kumar Singh6, Vivek Vidyadhar Bhosale7, Mahendra Pal Singh Negi7
1Department of Biochemistry, All India Institute of Medical Sciences Raebareli, Raebareli; 2Department of Biochemistry, All India Institute of Medical Sciences Jodhpur, Jodhpur; 3Department of Physiology, All India Institute of Medical Sciences Bhopal, Bhopal; 4Deparment of General Medicine, All India Institute of Medical Sciences Bhopal, Bhopal; 5Department of Physiology, King George’s Medical University, Lucknow; 6Department of Biochemistry, All India Institute of Medical Sciences Bibinagar, Bibinagar; 7Toxicology and Experimental Medicine Division, CSIR-Central Drug Research Institute, Lucknow, India
Background: It is well established that obesity is a major health risk in diabetes and associated diseases. Epi- genetic changes, specially DNA methylation, play an important role in regulation of adipokines. The objective of the present study was to evaluate the DNA methylation status at the promoter region of the leptin gene in obese individuals and its association with metabolic risk factors.
Methods: The study included obese (n=100) and non-obese (n=75) individuals aged 25–45 years, and mea- sured their physical, biochemical parameters (glucose, insulin, and lipid profiles) and leptin, DNA methyltransfer- ase 1 (DNMT1), and DNA methyltransferase 3 beta (DNMT3b) mRNA expressions with real-time reverse tran- scription-polymerase chain reaction (qRT-PCR). DNA methylation of the leptin gene at the promoter region was analyzed by methyl-specific qPCR .
Results: The study found that the DNA methylation level at the promoter area of the leptin gene was negative- ly associated with weight in obese subjects. Furthermore, study findings showed that the DNA methylation level was negatively associated with fasting insulin, glucose, homeostatic model assessment for insulin resistance, and total cholesterol. There was also a higher expression of DNMT1 and DNMT-3b in obese subjects as com- pared with non-obese subjects.
Conclusion: The leptin epigenetic profile may be associated with obesity and its associated metabolic risk fac- tors.
Key words: DNA methylation, DNA methyltransferase, Leptin, Obesity
Received December 8, 2020 Reviewed June 22, 2021 Accepted June 23, 2021
* Corresponding author Sadashiv
https://orcid.org/0000-0002-6232-1622 Department of Biochemistry, All India Institute of Medical Sciences Raebareli, UP 229405, India
Tel: +91-535-270-4400 Fax: +91-535-270-4400 E-mail: [email protected]
ergy homeostasis by regulating appetite.7,8 Leptin has a key associa- tion between leptinaemia and the chronic sub inflammatory state in obesity, which suggests other possible, peripheral biological ef- fects associated with its cytokine-like structure.9 Accordingly, sup- plementation of leptin in generalized lipodystrophy (absence of ad- ipose tissue) polish up insulin sensitivity and metabolic parameters.10 Leptin expression11 and its serum levels are directly associated with obesity. Increased adipose tissue size (total fat mass) is significantly associated with increase in leptin, hence leptin is a signature of total fat mass.12 Leptin is a signaling molecule from peripheral adipose tissue to the brain. Leptin gene-lacking mice were obese and had more complicated type 2 diabetes.6 These opinions enlighten fur- ther work to uncover the mechanism of regulation for leptin ex- pression in adipocytes.
Gene expression in physiologic and pathologic states is regulated by DNA methylation, which signals major epigenetic changes.
Methylation of cytosine in CpG sites is one of the important epi- genetic modifications that suppresses gene expression. Methylation usually prevents transcriptional factors from binding to promoters, and recruits transcriptional repressors such as methyl CpG binding protein 2.13,14 As a result, genes associated with the CpG-rich pro- moter and their expression level of genes have a tendency to rely on the methylation grade. In fact, the reason for down-regulated activ- ity of leptin is methylated CpG rich promoter.15
Previous studies have reported that DNA methylation levels at candidate gene loci associated to obesity and metabolic abnor- malities are impaired in peripheral blood and fat tissue of obese pa- tients16,17 and in low weight loss responder to diet and exercise in- terventions.18-21 In total, these findings suggest that leptin DNA methylation profiles might be involved in the pathology of obesity and metabolic disorder. Thus, the aim of the present study was to explore the role of DNA methylation in leptin gene expression in obese subjects and its link with metabolic risk factors in a north- west Indian Population.
METHODS Study design and participants
The researchers designed a hospital based, cross-sectional study.
The study design was approved by the Institutional Human Ethics
Committee (IHEC-LOP/2016/EF0026 dated 7th Mar 2016) and a written informed consent was obtained from all participants before inclusion. Individuals of both sexes between the age of 25–45 years and who presented to the outpatient department of All India Insti- tute of Medical Sciences, Jodhpur (a tertiary care hospital in north- western India) for a routine health-check-up were recruited. A ques- tionnaire was administered to all participants to determine their known morbidities, and anthropometry was performed using stan- dard means to classify them as obese (body mass index [BMI]
≥ 5 kg/m2) or non-obese (BMI, 18.5–24.9 kg/m2) on the basis of BMI. A fasting blood sample was obtained for biochemical and molecular assays.
The obese subjects were further divided into two sub-groups, those with metabolic syndrome and those without metabolic syndrome, according to the National Cholesterol Education Program’s Adult Treatment Panel III, which requires at least three of the following:
central obesity (waist circumference [WC] of ≥102 cm in men and
≥88 cm in women); dyslipidemia (TG levels ≥150 mg/dL; decreased high-density lipoprotein [HDL] cholesterol levels < 40 mg/dL [males] and <50 mg/dL [female]); blood pressure of 130/85 mmHg or higher or drug treatment for hypertension; and fasting plasma glucose ≥ 110 mg/dL.22
Biochemical estimation
Serum insulin concentrations were determined using the ADVIA Centaur Insulin assay kit (Tarrytown, NY, USA). Plasma glucose and lipid profile (Beckman Coulter kit) concentrations were deter- mined using an autoanalyzer (Beckman Coulter 480).
Nucleic acid (DNA and RNA) extraction
DNA was purified from whole blood samples with the Relia Prep Blood gDNA Miniprep (Promega Corp., Madison, WI, USA). To- tal RNA was isolated using Trizol reagent (Thermo Fischer Life Science, Carlsbad, CA ,USA). Complementary DNA (cDNA) was synthesized from RNA using high-capacity cDNA RT kit (Thermo Fischer Life Science) according to manufacturer instruction.
Sodium bisulfite modification
The isolated DNA was modified with sodium bisulfite, which transforms unmethylated cytosine into uracil without changing
methylated cytosine by using the EpiTect Bisufite Kit (Qiagen) ac- cording to the manufacturer’s instructions.
Quantitative methylation analysis
Real time PCR was carried out using Methylamp MS-qPCR (Epigenetek). PCR amplification was carried out in Bio-Rad CFX96 Real time PCR (Bio-Rad). A 96-well PCR plate using a temperature profile of 95°C, 15 minutes (initial denaturation) followed by 40 cycles of 94°C, 15 seconds, 59°C, 30 seconds and 72°C, 30 seconds for denaturation, annealing, and extension steps, respectively. The primers were designed by using Meth Primer (Li Lab) software.
The PCR primers were synthesized by (Eurofins Scientific). Primer sequence for leptin methylated are forward: 5´-TAGGATTAAC- GAGGGCGTAGTC-3´ and reverse: 5´-AACCCCTTAAAAAA- ATACTTCGAA-3´ and for unmethylated are forward: 5´-TTAG- GATTAATGAGGGTGTAGTTGT-3´ and reverse: 5´-CAACC- CCTTAAAAAAATACTTCAAA-3´.
Real time PCR measurement of leptin mRNA, DNMT1, and DNMT3b
Real time-PCR was carried out using the iTaq Universal SYBR Green Supermix kit (Bio-Rad). PCR amplification was conducted in Bio-Rad CFX96 Realtime PCR (Bio-Rad). A 96 well PCR plate using the temperature profile of 95°C, 15 minutes, (initial denatur- ation) was followed by 40 cycles of 94°C, 15 seconds, 59°C, 30 sec- onds and 72°C, 30 seconds for denaturation, annealing, and exten- sion steps, respectively. Primer sequence of human leptin, DNA methyltransferase 1 (DNMT1) and DNA methyltransferase 3 beta (DNMT3b) were 5´-GCTGTGCCCATCCAAAAAGT-3´ (forward) 5´-ACTGCCAGTGTCTGGTCCAT-3´ (reverse), 5´-TACCTGG- ACCCTGACCTC-3´ (forward), 5´-CGTTGGCATCAAAGATG- GACA-3´ (reverse) and 5´-GGCAAGTTCTCCGAGGTC TC- TG-3´ (forward) 5´-TGGTACATGGCTTTTCGATAGGA-3´ (re- verse). The primer sequence of GAPDH as an internal control with the following sequence was 5′-AGGGCTGCTTTTAACTCTG- GT-3′ (forward) and 5′-CCCCACTTGATTTTGGAGGGA-3′
(reverse). The PCR primers were synthesized by Eurofins Scientif- ic (Munich, Germany).
Calculation
Insulin resistance
The homeostatic model assessment for insulin resistance (HOMA- IR) was calculated using the HOMA-IR [HOMA-IR= fasting in- sulin (μU/L)× fasting glucose (mM)/22.5].23
Relative gene expression
The relative gene expression was calculated using [(1/2)ΔCt].
Statistical analysis
Data were summarized as the mean± standard error of the mean.
Two independent groups (non-obese and obese; and obese with non-metabolic and metabolic syndrome) were compared using the Student t-test. A Pearson correlation analysis was performed to as- sess the association of methylation (leptin) with gene expression (DNMT1, DNMT3b and leptin) and metabolic risk factors (de- mographic, biochemical, and clinical variables). A two-tailed P<0.05 was considered statistically significant. Analyses were per- formed with STATISTICA software version 6.0 (StatSoft, Tulsa, OK, USA).
RESULTS
Demographic, biochemical, and clinical characteristics
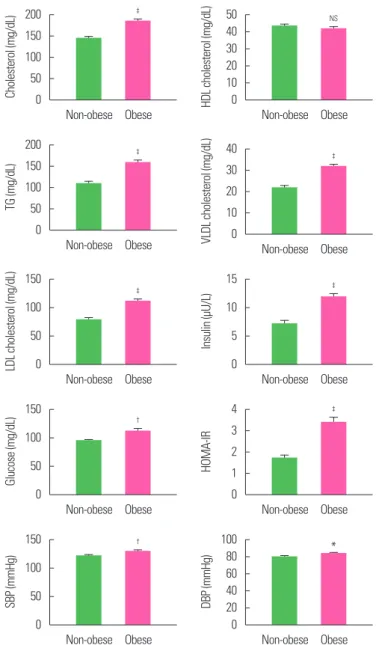
A total of 175 individuals were included in the study; 100 of them were obese and 75 were non-obese. The demographic (age, sex, height, weight, BMI, WC, biochemical (cholesterol, HDL cho- lesterol, TG, very low density lipoprotein (VLDL) cholesterol, low- density lipoprotein (LDL) cholesterol, and clinical (insulin, glu- cose, HOMA-IR, systolic blood pressure [SBP], and diastolic blood pressure [DBP]) characteristics of these two groups are summarized in Table 1 and Fig. 1. Age and sex distribution of the participants in the two groups was similar (P>0.05). However, the mean weight, BMI, WC, cholesterol, TG, VLDL, LDL, insulin, HOMA-IR, SBP, and DBP were found to be significantly (P<0.05, P<0.01, or P<0.001) different and higher in obese individuals when compared to non-obese individuals.
Relative gene expression
The relative gene expression of markers (DNMT1, DNMT3b,
and leptin) of the two groups (obese and non-obese) is summarized in Table 2. The relative mean gene expression of markers was found to be similar (P>0.05) between the two groups though it was 63.3%, 78.4%, and 96.4% higher, respectively, in obese as compared to non- obese individuals.
Methylation and unmethylation
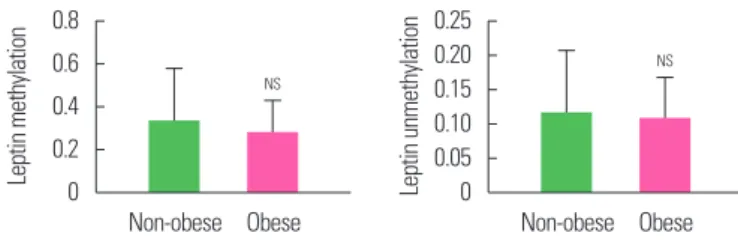
The methylation and unmethylation levels of leptin in the two groups (obese and non-obese) is summarized in Table 3 and Fig. 2.
The mean methylation and unmethylation levels of leptin were also found to be similar (P>0.05) between the two groups though
it was lower, 16.5% and 7.3% respectively, in obese as compared to non-obese individuals.
Correlation
The correlation of leptin methylation and unmethylation with metabolic risk factors (demographic, biochemical, and clinical) and relative markers (DNMT1, DNMT3b, and leptin) gene expression in the obese is summarized in Table 4. Leptin methylation and un- Figure 1. Mean biochemical risk factor levels of non-obese and obese subjects.
Values are presented as mean± standard error of the mean. *P< 0.05, †P< 0.01,
‡P< 0.001, and NSP> 0.05, as compared to non-obese. HDL, high-density lipopro- tein; TG, triglyceride; VLDL, very low density lipoprotein; LDL, low-density lipopro- tein; SE, standard error of the mean; SBP, systolic blood pressure; DBP, diastolic blood pressure; NS, not significant.
200 150 100 50 Cholesterol (mg/dL) 0
Non-obese Obese
‡ 50
40 30 20 10 HDL cholesterol (mg/dL) 0
Non-obese Obese
NS
200 150 100 50 0
TG (mg/dL)
Non-obese Obese
‡ 40
30 20 10 VLDL cholesterol (mg/dL) 0
Non-obese Obese
‡
150 100 50 LDL cholesterol (mg/dL) 0
Non-obese Obese
‡
15 10 5 0
Insulin (μU/L)
Non-obese Obese
‡
150 100 50 Glucose (mg/dL) 0
Non-obese Obese
† 4
3 2 1 0
HOMA-IR
Non-obese Obese
‡
150 100 50 0
SBP (mmHg)
Non-obese Obese
† 100
80 60 40 20 0
DBP (mmHg)
Non-obese Obese
* Table 1. Demographic, biochemical, and clinical characteristics of non-obese and
obese groups
Variable Non-obese group
(n= 75) Obese group
(n= 100) t-value P
Age (yr) 36.04± 0.82 37.56± 0.63 1.50 0.136
Sex 0.09 0.760
Female 38 (50.7) 53 (53.0)
Male 37 (49.3) 47 (47.0)
Height (cm) 161.93± 0.98 160.92± 1.07 0.68 0.500
Weight (kg) 58.06± 0.93 76.53± 1.14 11.94 < 0.001 BMI (kg/m2) 22.10± 0.24 29.58± 0.38 15.52 < 0.001
WC (cm) 83.47± 0.90 99.06± 0.89 12.13 < 0.001
Cholesterol (mg/dL) 144.34± 3.75 185.03± 4.57 6.57 < 0.001 HDL cholesterol (mg/dL) 43.53± 0.90 41.69± 1.02 1.31 0.193 TG (mg/dL) 109.43± 4.86 159.00± 6.28 5.91 < 0.001 VLDL cholesterol (mg/dL) 21.89± 0.97 31.80± 1.26 5.91 < 0.001 LDL cholesterol (mg/dL) 78.92± 3.33 111.54± 4.10 5.88 < 0.001 Insulin (μU/L) 7.21± 0.57 11.87± 0.64 5.22 < 0.001 Glucose (mg/dL) 94.81± 1.52 111.86± 4.62 3.10 0.002
HOMA-IR 1.70± 0.15 3.39± 0.24 5.47 < 0.001
SBP (mmHg) 121.67± 1.88 129.84± 1.62 3.30 0.001
DBP (mmHg) 80.11± 1.16 84.05± 1.04 2.51 0.013
Values are presented as mean± standard error of the mean or number (%).
BMI, body mass index; WC, waist circumference; HDL, high-density lipoprotein; TG, tri- glyceride; VLDL, very low density lipoprotein; LDL, low-density lipoprotein; HOMA-IR, homeostatic model assessment for insulin resistance; SBP, systolic blood pressure;
DBP, diastolic blood pressure.
Table 2. Relative gene expression of markers of the two groups Variable Non-obese group Obese group
t-value P
n Mean± SE n Mean± SE
DNMT1 29 0.169± 0.027 52 0.462± 0.127 1.70 0.092 DNMT3b 29 0.033± 0.005 52 0.154± 0.054 1.66 0.101 Leptin 29 0.012± 0.005 52 0.321± 0.178 1.29 0.200 SE, standard error of the mean; DNMT, DNA methyltransferase.
methylation showed an insignificant (P>0.05) correlation with metabolic risk factors and relative markers gene expression except leptin. Leptin showed a significant and positive (direct) correlation with age (r= 0.560, P<0.001) and a significant and negative (in- verse) correlation with weight (r= –0.449, P<0.01).
Methylation and unmethylation in obese groups
The methylation and unmethylation levels of leptin in two obese groups (non-metabolic and metabolic) is summarized in Table 5 and Fig. 3. The mean methylation and unmethylation levels of leptin were also found to be similar (P>0.05) between the two obese groups though it was lower, 55.0% and 62.1% respectively, in the metabolic obese as compared to the non-metabolic obese group.
DISCUSSION
In obesity and obesity-related metabolic disorders, leptin regula- tion is profoundly altered,24 and some of these changes are regulat- ed by DNA methylation. The present study reports that leptin DNA methylation levels at the promoter region, investigated in pe- ripheral blood specimens, are associated with obesity-related an- thropometric variables, biochemical parameters, and leptin mRNA expression.
Study findings report that the hypomethylation (reduced meth- Table 3. Leptin methylation and unmethylation levels of non-obese and obese
groups
Variable Non-obese Obese
t-value P
n Mean± SE n Mean± SE
Leptin M 29 0.328± 0.248 33 0.274± 0.154 0.19 0.849 Leptin U 20 0.116± 0.093 28 0.107± 0.062 0.08 0.938 SE, standard error of the mean; M, methylation; U, unmethylation.
0.8 0.6 0.4 0.2 Leptin methylation 0
Non-obese Obese
NS
0.25 0.20 0.15 0.10 0.05 Leptin unmethylation 0
Non-obese Obese
NS
Figure 2. Mean methylation and unmethylation leptin levels of non-obese and obese subjects. Values are presented as mean± standard error of the mean.
NSP> 0.05 as compared to non-obese. NS, not significant.
Table 5. Leptin methylation and unmethylation levels of two obese groups Variable Non-metabolic obese group Metabolic obese group
t-value P-value
n Mean± SE n Mean± SE
Leptin M 11 0.433± 0.302 22 0.195± 0.177 0.73 0.474 Leptin U 13 0.160± 0.128 15 0.061± 0.035 0.80 0.432 SE, standard error of the mean; M, methylation; U, unmethylation.
0.8 0.6 0.4 0.2 Leptin methylation 0
Non-metabolic Metabolic obese obese
NS
0.4 0.3 0.2 0.1 Leptin unmethylation 0
Non-metabolic Metabolic obese obese
NS
Figure 3. Mean methylation and unmethylation leptin levels of non-metabolic obese and metabolic obese subjects. NSP> 0.05 as compared to non-obese. NS, not significant.
Table 4. Correlation of methylation with metabolic risk factors and relative mark- ers gene expression in obese subjects
Variable Leptin methylation Leptin unmethylation Correlation (r) P Correlation (r) P
Age 0.560 < 0.001† 0.171 0.357
Sex –0.267 0.213 –0.097 0.584
Height –0.287 0.128 0.169 0.506
Weight –0.449 0.001* 0.059 0.933
BMI –0.329 0.194 –0.067 0.665
WC –0.360 0.148 –0.025 0.855
Cholesterol –0.092 0.548 0.012 0.952
HDL cholesterol 0.033 0.996 0.136 0.457
TG 0.001 0.987 –0.210 0.279
VLDL cholesterol 0.001 0.987 –0.210 0.279
LDL cholesterol –0.119 0.482 0.029 0.897
Insulin –0.063 0.927 –0.160 0.390
Glucose –0.174 0.358 0.046 0.813
HOMA-IR –0.178 0.467 –0.113 0.539
SBP –0.273 0.170 –0.177 0.403
DBP –0.187 0.292 –0.023 0.865
DNMT1 0.022 0.918 0.168 0.413
DNMT3b 0.022 0.919 0.269 0.183
Leptin –0.034 0.872 –0.089 0.664
*P< 0.01; †P< 0.001.
BMI, body mass index; WC, waist circumference; HDL, high-density lipoprotein; TG, tri- glyceride; VLDL, very low density lipoprotein; LDL, low-density lipoprotein; HOMA-IR, homeostatic model assessment for insulin resistance; SBP, systolic blood pressure;
DBP, diastolic blood pressure; DNMT, DNA methyltransferase.
ylation) of the leptin promoter in the peripheral blood of the obese was like that of the non-obese. Further, it demonstrated reduced DNA methylation in the metabolic obese as compared to the non- metabolic obese subjects. Various authors have reported reduced levels of leptin methylation in the blood cells of children with high- er birth weight and BMI,25 in obese and insulin resistant adoles- cents,26 and obese women.27 Another report stipulates that genetic variation may have a substantial impact on local methylation pat- terns,28,29 but as to the extent that methylation is not affected by ge- netic variation, the mechanisms remain unclear.
This study also found higher leptin gene expression in obese sub- jects. Interestingly, leptin was also higher in non-metabolic obese subjects. This finding is supported by Tiwari et al.24 who reported higher gene expression in the adipose tissue of obese subjects. An- other study involving human subjects showed that the develop- mental increase in leptin mRNA expression in adipose tissue dur- ing childhood, reaching maximal capacity in adulthood.30 Moreover, a study also supported associating leptin with a direct supervision of body fat (adipose tissue) metabolism through inhibition of TG synthesis and stimulation of lipid breakdown.31 Reduced leptin methylation could account for obesity-related leptin upregulation.
These findings indicate that methylation at the promoter region regulates leptin gene expression. A possible mechanism, the in sili- co analysis, is in line with a study that noted that methylation sur- rounding the transcription start site is tightly associated to transcrip- tional silencing while methylation of more downstream regions is not associated with the magnitude of gene expression.32,33
Researchers in the current study also observed the significant neg- ative association between methylation levels of leptin promoter and body weight. This finding is consistent with the recent finding of García-Cardona et al.26 who reported a negative correlation between methylation frequency and BMI in obese adolescents.
In addition, the study also found a negative association of meth- ylation levels of leptin promoter with BMI, cholesterol, insulin, HOMA-IR and glucose. However, it was not significant. These in- significant results may be due to small sample size. This finding is also consistent with previous findings.26,34 Moreover, these results also showed higher expression of DNMT1 and DNMT3b in obese rather than non-obese groups, but there was a lower methylation level at the promoter of leptin. This may be due to changes in DNMT
protein levels. Moreover, the study found a higher expression of DNMT1 and DNMT3b in the non-metabolic obese than in the metabolic obese. Thus, these findings support that lower methyla- tion might be the cause of the development of obesity and its asso- ciated metabolic risks.
The strength of the current study includes analysis of the impor- tance of adipokine central in energy metabolism regulation in blood cells. Blood is the most clinically within-reach tissue. Limitations of the current study are its small sample size and the fact that it did not include analysis in adipose tissue. In conclusion, the present findings add evidence that leptin DNA methylation levels in blood cells are associated with obesity-related anthropometric measures.
CONFLICTS OF INTEREST
The authors declare no conflict of interest.
ACKNOWLEDGMENTS
This study was funded by Science and Engineering Research Board (SERB), New Delhi, India (Grant No. YSS/2015/000054).
AUTHOR CONTRIBUTIONS
Study concept and design: S; acquisition of data: AM and MK;
analysis and interpretation of data: PS; drafting of the manuscript:
SSM; critical revision of the manuscript: RJ; statistical analysis:
VVB and MPSN; obtained funding: S; administrative, technical, or material support: RB; and study supervision: ST and PKS.
REFERENCES
1. Ogden CL, Carroll MD, Kit BK, Flegal KM. Prevalence of obesity and trends in body mass index among US children and adolescents, 1999-2010. JAMA 2012;307:483-90.
2. O’Rahilly S. Human genetics illuminates the paths to metabol- ic disease. Nature 2009;462:307-14.
3. Rosen ED, Spiegelman BM. Adipocytes as regulators of ener- gy balance and glucose homeostasis. Nature 2006;444:847-53.
4. Pi-Sunyer X. The medical risks of obesity. Postgrad Med 2009;
121:21-33.
5. World Health Organization. World health report 2012 fact sheet 311. Geneva: World Health Organization; 2016.
6. Zhang Y, Proenca R, Maffei M, Barone M, Leopold L, Fried- man JM. Positional cloning of the mouse obese gene and its human homologue. Nature 1994;372:425-32.
7. Minokoshi Y, Kim YB, Peroni OD, Fryer LG, Müller C, Car- ling D, et al. Leptin stimulates fatty-acid oxidation by activat- ing AMP-activated protein kinase. Nature 2002;415:339-43.
8. Muoio DM, Dohm GL, Fiedorek FT Jr, Tapscott EB, Cole- man RA. Leptin directly alters lipid partitioning in skeletal muscle. Diabetes 1997;46:1360-3.
9. Ahima RS, Flier JS. Leptin. Annu Rev Physiol 2000;62:413-37.
10. Oral EA, Simha V, Ruiz E, Andewelt A, Premkumar A, Snell P, et al. Leptin-replacement therapy for lipodystrophy. N Engl J Med 2002;346:570-8.
11. Vidal H, Auboeuf D, De Vos P, Staels B, Riou JP, Auwerx J, et al. The expression of ob gene is not acutely regulated by insu- lin and fasting in human abdominal subcutaneous adipose tissue. J Clin Invest 1996;98:251-5.
12. Considine RV, Sinha MK, Heiman ML, Kriauciunas A, Ste- phens TW, Nyce MR, et al. Serum immunoreactive-leptin concentrations in normal-weight and obese humans. N Engl J Med 1996;334:292-5.
13. Watt F, Molloy PL. Cytosine methylation prevents binding to DNA of a HeLa cell transcription factor required for optimal expression of the adenovirus major late promoter. Genes Dev 1988;2:1136-43.
14. Bird AP, Wolffe AP. Methylation-induced repression: belts, braces, and chromatin. Cell 1999;99:451-4.
15. Komori N, Tawata M, Onaya T. DNA demethylation modu- lates mouse leptin promoter activity during the differentiation of 3T3-L1 cells. Diabetologia 2002;45:140-8.
16. Dick KJ, Nelson CP, Tsaprouni L, Sandling JK, Aïssi D, Wahl S, et al. DNA methylation and body-mass index: a genome- wide analysis. Lancet 2014;383:1990-8.
17. Milagro FI, Gómez-Abellán P, Campión J, Martínez JA, Or- dovás JM, Garaulet M. CLOCK, PER2 and BMAL1 DNA methylation: association with obesity and metabolic syndrome characteristics and monounsaturated fat intake. Chronobiol
Int 2012;29:1180-94.
18. Jacobsen SC, Gillberg L, Bork-Jensen J, Ribel-Madsen R, Lara E, Calvanese V, et al. Young men with low birthweight exhibit decreased plasticity of genome-wide muscle DNA methylation by high-fat overfeeding. Diabetologia 2014;57:1154-8.
19. Bouchard L, Rabasa-Lhoret R, Faraj M, Lavoie ME, Mill J, Pérusse L, et al. Differential epigenomic and transcriptomic responses in subcutaneous adipose tissue between low and high responders to caloric restriction. Am J Clin Nutr 2010;
91:309-20.
20. Rönn T, Volkov P, Davegårdh C, Dayeh T, Hall E, Olsson AH, et al. A six months exercise intervention influences the genome-wide DNA methylation pattern in human adipose tissue. PLoS Genet 2013;9:e1003572.
21. Moleres A, Campión J, Milagro FI, Marcos A, Campoy C, Garagorri JM, et al. Differential DNA methylation patterns between high and low responders to a weight loss interven- tion in overweight or obese adolescents: the EVASYON study.
FASEB J 2013;27:2504-12.
22. Oh JE. Relationship between weekly physical activity frequen- cy and metabolic syndrome. Korean J Obes 2016;25:77-83.
23. Matthews DR, Hosker JP, Rudenski AS, Naylor BA, Treacher DF, Turner RC. Homeostasis model assessment: insulin resis- tance and beta-cell function from fasting plasma glucose and insulin concentrations in man. Diabetologia 1985;28:412-9.
24. Tiwari S, Sadashiv, Paul BN, Kumar S, Chandra A, Dhananjai S, et al. TNF-α gene expression in subcutaneous adipose tis- sue associated with HOMA in Asian Indian postmenopausal women. Horm Metab Res 2014;46:94-9.
25. Obermann-Borst SA, Eilers PH, Tobi EW, de Jong FH, Slag- boom PE, Heijmans BT, et al. Duration of breastfeeding and gender are associated with methylation of the LEPTIN gene in very young children. Pediatr Res 2013;74:344-9.
26. García-Cardona MC, Huang F, García-Vivas JM, López-Ca- marillo C, Del Río Navarro BE, Navarro Olivos E, et al. DNA methylation of leptin and adiponectin promoters in children is reduced by the combined presence of obesity and insulin resistance. Int J Obes (Lond) 2014;38:1457-65.
27. Lesseur C, Armstrong DA, Paquette AG, Koestler DC, Pad- bury JF, Marsit CJ. Tissue-specific Leptin promoter DNA
methylation is associated with maternal and infant perinatal factors. Mol Cell Endocrinol 2013;381:160-7.
28. Gibbs JR, van der Brug MP, Hernandez DG, Traynor BJ, Nalls MA, Lai SL, et al. Abundant quantitative trait loci exist for DNA methylation and gene expression in human brain. PLoS Genet 2010;6:e1000952.
29. Boks MP, Derks EM, Weisenberger DJ, Strengman E, Janson E, Sommer IE, et al. The relationship of DNA methylation with age, gender and genotype in twins and healthy controls.
PLoS One 2009;4:e6767.
30. Schoof E, Stuppy A, Harig F, Carbon R, Horbach T, Stöhr W, et al. Comparison of leptin gene expression in different adi- pose tissues in children and adults. Eur J Endocrinol 2004;
150:579-84.
31. Yang WS, Lee WJ, Funahashi T, Tanaka S, Matsuzawa Y, Chao CL, et al. Weight reduction increases plasma levels of an adi- pose-derived anti-inflammatory protein, adiponectin. J Clin Endocrinol Metab 2001;86:3815-9.
32. Hellman A, Chess A. Gene body-specific methylation on the active X chromosome. Science 2007;315:1141-3.
33. Hsieh CL. Dependence of transcriptional repression on CpG methylation density. Mol Cell Biol 1994;14:5487-94.
34. Houde AA, Légaré C, Biron S, Lescelleur O, Biertho L, Marceau S, et al. Leptin and adiponectin DNA methylation levels in adipose tissues and blood cells are associated with BMI, waist girth and LDL-cholesterol levels in severely obese men and women. BMC Med Genet 2015;16:29.