INTRODUCTION
Adipose tissue biology plays an important role in defining the mechanisms related to the pathophysiology of metabolic dis- eases, such as obesity, hypertension, metabolic syndrome, and
type 2 diabetes.1,2 White adipose tissue synthesizes and releases various anti-inflammatory and pro-inflammatory cytokines known as adipokines.3,4 Adiponectin and leptin are two impor- tant adipokines in the regulation of energy homeostasis. Adipo- nectin is the most abundant adipokine and is recognized as a key regulator of insulin sensitivity, tissue inflammation, and endothelial function.5,6 Previous studies have reported that low serum levels of adiponectin are associated with risk of obesity, type 2 diabetes, and metabolic syndrome.7,8 Leptin is another key regulator of food intake and energy expenditure.9 High lev- els of circulatory leptin are known to be associated with insulin resistance, obesity, and metabolic syndrome.10,11
Since adiponectin and leptin have opposite effects on glu- cose and fat metabolism, the ratio of serum leptin to adiponec- tin (L/A ratio) has been proposed as a better marker for insulin
Impact of Serum Leptin to Adiponectin Ratio on Regression of Metabolic Syndrome in High-Risk Individuals: The ARIRANG Study
Dae Ryong Kang
1, Dhananjay Yadav
2, Sang-Baek Koh
2,3, Jang-Young Kim
3,4, and Song Vogue Ahn
2,31Department of Humanities and Social Medicine, Ajou University School of Medicine, Suwon;
Departments of 2Preventive Medicine and 4Internal Medicine, Yonsei University Wonju College of Medicine, Wonju;
3Institute of Genomic Cohort, Yonsei University, Wonju, Korea.
Purpose: The ratio of serum leptin to adiponectin (L/A ratio) could be used as a marker for insulin resistance. However, few pro- spective studies have investigated the impact of L/A ratio on improvement of metabolic components in high-risk individuals with metabolic syndrome. We examined the association between L/A ratio and the regression of metabolic syndrome in a population- based longitudinal study.
Materials and Methods: A total of 1017 subjects (431 men and 586 women) with metabolic syndrome at baseline (2005–2008) were examined and followed (2008–2011). Baseline serum levels of leptin and adiponectin were analyzed by radioimmunoassay.
Area under the receiver operating characteristics curve (AUROC) analyses were used to assess the predictive ability of L/A ratio for the regression of metabolic syndrome.
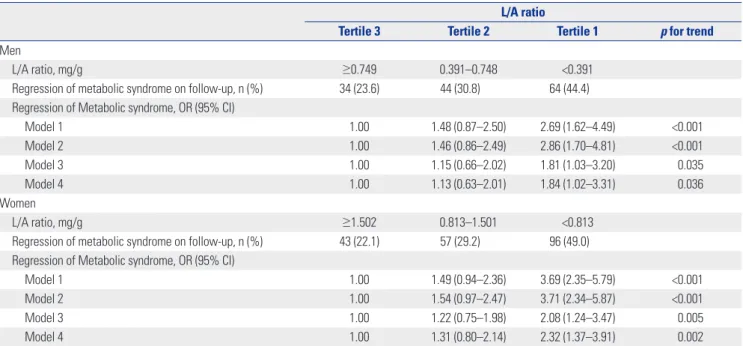
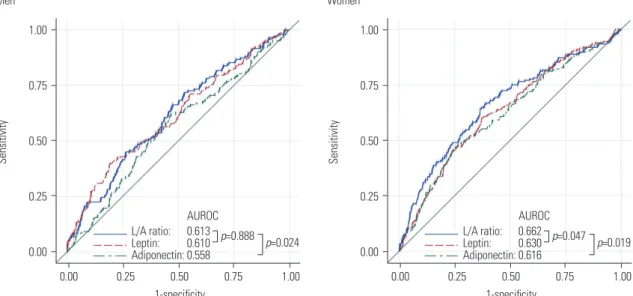
Results: During an average of 2.8 years of follow-up, metabolic syndrome disappeared in 142 men (32.9%) and 196 women (33.4%). After multivariable adjustment, the odds ratios (95% confidence interval) for regression of metabolic syndrome in com- parisons of the lowest to the highest tertiles of L/A ratio were 1.84 (1.02–3.31) in men and 2.32 (1.37–3.91) in women. In AUROC analyses, L/A ratio had a greater predictive power than serum adiponectin for the regression of metabolic syndrome in both men (p=0.024) and women (p=0.019).
Conclusion: Low L/A ratio is a predictor for the regression of metabolic syndrome. The L/A ratio could be a useful clinical marker for management of high-risk individuals with metabolic syndrome.
Key Words: Leptin, adiponectin, metabolic syndrome, insulin resistance, prospective study
pISSN: 0513-5796 · eISSN: 1976-2437
Received: July 25, 2016 Revised: August 30, 2016 Accepted: September 29, 2016
Corresponding author: Dr. Song Vogue Ahn, Department of Preventive Medicine, Yonsei University Wonju College of Medicine, 20 Ilsan-ro, Wonju 26426, Korea.
Tel: 82-33-741-0348, Fax: 82-33-747-0409, E-mail: [email protected]
•The authors have no financial conflicts of interest.
© Copyright: Yonsei University College of Medicine 2017
This is an Open Access article distributed under the terms of the Creative Com- mons Attribution Non-Commercial License (http://creativecommons.org/licenses/
by-nc/3.0) which permits unrestricted non-commercial use, distribution, and repro- duction in any medium, provided the original work is properly cited.
Yonsei Med J 2017 Mar;58(2):339-346 https://doi.org/10.3349/ymj.2017.58.2.339
resistance than leptin or adiponectin alone.12,13 The L/A ratio has also been evaluated as a potential atherogenic index in obese diabetic patients.14 However, little information is avail- able about the ability of L/A ratio to predict improvement of metabolic components in high-risk individuals with metabolic syndrome.
Accordingly, we investigated the prospective association be- tween L/A ratio and the regression of metabolic syndrome and its components in individuals with metabolic syndrome. Fur- thermore, we analyzed the predictive ability of L/A ratio for the regression of metabolic syndrome, beyond that of adiponectin alone.
MATERIALS AND METHODS
Study population
We analyzed study data from the Korean Genome and Epide- miology Study on Atherosclerosis Risk of Rural Areas in the Ko- rean General Population (KoGES-ARIRANG), a community- based prospective cohort study that was primarily designed to estimate the prevalence, incidence, and risk factors for cardio- vascular and metabolic diseases, such as hypertension, diabe- tes, dyslipidemia, and metabolic syndrome.8 The study design and protocol were approved by the Institutional Review Board of Wonju Severance Christian Hospital. All study participants provided written informed consent prior to the commence- ment of the study.
Baseline data were collected for 5178 adults (2127 men and 3051 women) aged 40 to 70 years from November 2005 to Janu- ary 2008. The first follow-up survey conducted from April 2008 to January 2011 involved 3862 subjects. We excluded 2317 sub- jects without metabolic syndrome at baseline, 190 without base- line adiponectin measurement, 334 without baseline leptin measurement, and four with incomplete data. Finally, 1017 in- dividuals (431 men and 586 women) with metabolic syndrome at baseline were included in the analysis (Supplementary Fig. 1, only online).
Measurement of anthropometric and biochemical characteristics
Standardized questionnaires related to medical history and life- style factors were collected at baseline and on follow-up exami- nation. Body weights and heights were measured with subjects wearing light indoor clothing without shoes. Waist circumfer- ence was measured in a horizontal plane midway between the inferior margin of the ribs and the superior border of the iliac crest using a tape measure (SECA 200; SECA, Hamburg, Ger- many). Systolic and diastolic blood pressures were measured twice in the right arm at a 5-minute interval at least using a mercury sphygmomanometer (Baumanometer, Copiague, NY, USA). The mean of two blood pressure readings was used for analysis. Smoking, alcohol drinking, and regular exercise habits
were determined by self-reported questionnaires according to a procedure described elsewhere.8
A venous blood sample was collected from study subjects af- ter fasting for ≥12 hours. Serum levels of adiponectin and leptin were analyzed by radioimmunoassay (LINCO Research Inc., St.
Charles, MO, USA). The intra-assay and inter-assay coefficients of variation for serum adiponectin and leptin levels ranged from 2.9% to 6.6% and 3.0% to 6.2%, respectively. The fasting serum glucose and insulin levels were determined by a glucose oxidase-based assay and double-antibody radioimmunoassay.
The intra-assay and inter-assay coefficients of variation for se- rum insulin ranged from 2.1% to 8.3%. High-sensitivity C-reac- tive protein (hs-CRP) was measured using the Denka Seiken (Tokyo, Japan) assay. Serum levels of high-density lipoprotein (HDL) cholesterol and triglycerides were determined by enzy- matic methods (Advia 1650, Siemens, Tarrytown, NY, USA). In- sulin resistance was calculated using the homeostasis model assessment of insulin resistance (HOMA-IR) method with the following formula: fasting insulin (μIU/mL)×fasting blood glu- cose (mg/dL)/405.15
Definition of metabolic syndrome
We diagnosed metabolic syndrome according to a harmonized definition16 as the presence of at least three of the following risk factors: 1) waist circumference ≥90 cm for men or ≥85 cm for women (using cut-offs established by the Korean Society of Obesity);17 2) serum HDL cholesterol level <40 mg/dL for men or <50 mg/dL for women; 3) serum triglyceride level ≥150 mg/
dL; 4) systolic blood pressure ≥130 mm Hg, or diastolic blood pressure ≥85 mm Hg, or treatment with antihypertensives; and 5) fasting serum glucose level ≥100 mg/dL or previously diag- nosed type 2 diabetes.
Statistical analysis
The data are expressed as frequencies with percentage, means with standard deviation or median with interquartile range. All statistical analyses were performed separately for men and women because women have higher levels of adiponectin and leptin, compared to men. We stratified the study population into sex-specific tertiles of L/A ratio, with cut-off points of 0.391 and 0.748 mg/g for men and 0.813 and 1.501 mg/g for women.
The independent effects of L/A ratio on regression of metabolic syndrome were analyzed through multivariable logistic regres- sion models. The study used four models with a gradual degree of adjustment. First, we conducted an age-adjusted analysis.
Second, we adjusted for age, smoking, alcohol intake, and regu- lar exercise. Third, we additionally adjusted model 2 with base- line body mass index, hs-CRP and HOMA-IR. Fourth, we addi- tionally adjusted model 3 with changes in body weight between baseline and follow-up. The odd ratios with 95% confidence in- terval (CI) were calculated according to increasing tertiles of L/
A ratio. We also calculated the individual contributions of L/A ratio and serum adiponectin for predicting regression of meta-
bolic syndrome. Area under the receiver operating characteris- tics curve (AUROC) analyses were used to compare the predic- tive powers of serum levels of leptin, adiponectin, and L/A ratio for regression of metabolic syndrome. Statistical significance was considered at p<0.05 for all comparisons. All statistical analyses were performed using SAS, version 9.3 (SAS Institute, Cary, NC, USA).
RESULTS
During a mean (range) follow-up of 2.8 (1.5–4.9) years, meta- bolic syndrome disappeared in 142 men (32.9%) and 196 wom- en (33.4%). The baseline characteristics of the study subjects are shown in Table 1 according to the presence and absence of metabolic syndrome on follow-up. In both men and women, waist circumference, body mass index, levels of fasting serum glucose and serum leptin, HOMA-IR, and L/A ratio were signif-
icantly lower in subjects with regression of metabolic syndrome than in those with persistent metabolic syndrome. In women, systolic blood pressure, serum triglyceride, and hs-CRP levels were significantly lower and adiponectin level was significantly higher in subjects with regression of metabolic syndrome, com- pared to those with persistent metabolic syndrome. Men who regressed from metabolic syndrome exhibited higher levels of serum HDL cholesterol than those with persistent metabolic syndrome. Prevalence of diabetes was higher in subjects with persistent metabolic syndrome than in those with regression of metabolic syndrome. Prevalence of hypertension, smoking, al- cohol drinking, and regular exercise were not significantly dif- ferent between subjects with persistent metabolic syndrome and those with regression of metabolic syndrome. The majority of subjects with regression metabolic syndrome at follow-up had three components of metabolic syndrome at baseline (73.9% of men and 79.1% of women), whereas more than a half of subjects with persistent metabolic syndrome had four or five
Table 1. Baseline Characteristics of Study Subjects According to Regression of Metabolic Syndrome on Follow-Up
Men Women
Regression of metabolic syndrome
No regression of
metabolic syndrome p value Regression of metabolic syndrome
No regression of
metabolic syndrome p value
n (%) 142 (32.9) 289 (67.1) 196 (33.4) 390 (66.6)
Age, yrs 55.3±8.1 56.5±7.8 0.137 56.8±8.4 57.4±7.9 0.383
Waist circumference, cm 89.1±6.2 92.4±6.1 <0.001 84.9±7.4 89.0±7.1 <0.001
Body mass index, kg/m2 25.2±2.6 26.6±2.5 <0.001 25.5±3.0 27.3±2.9 <0.001
Systolic BP, mm Hg 134.6±17.0 134.7±17.7 0.931 132.7±16.6 136.0±17.2 0.027
Diastolic BP, mm Hg 88.2±10.6 88.3±11.5 0.964 87.1±10.2 87.1±11.3 0.987
Fasting glucose, mg/dL 99.7±20.1 110.0±27.4 <0.001 96.0±20.7 103.8±28.6 <0.001
HDL cholesterol, mg/dL 41.9±10.8 38.5±8.0 0.001 44.1±8.1 42.6±8.5 0.051
LDL cholesterol, mg/dL 114.8±36.4 114.5±33.1 0.924 128.4±31.6 129.9±37.3 0.616
Triglycerides, mg/dL 199.0 (156.0, 254.0) 206.0 (151.0, 280.0) 0.421* 168.0 (120.5, 213.0) 179.0 (133.0, 237.0) 0.004*
hs-CRP, mg/L 1.12 (0.66, 1.87) 1.36 (0.70, 2.40) 0.126* 1.00 (0.50, 1.75) 1.30 (0.70, 2.61) 0.001*
HOMA-IR, units 1.78 (1.38, 2.38) 2.19 (1.73, 3.17) <0.001* 1.82 (1.44, 2.28) 2.29 (1.74, 3.16) <0.001*
Leptin, ng/mL 2.68 (1.85, 3.94) 3.31 (2.37, 4.57) <0.001* 8.39 (5.93, 12.40) 10.96 (7.69, 15.22) <0.001*
Adiponectin, µg/mL 6.32 (4.20, 8.33) 5.46 (3.93, 7.46) 0.052* 10.79 (7.71, 13.70) 8.80 (6.54, 11.23) <0.001*
L/A ratio, mg/g 0.447 (0.287, 0.723) 0.604 (0.373, 1.039) <0.001* 0.836 (0.492, 1.299) 1.263 (0.812, 2.020) <0.001*
Diabetes† (%) 14 (9.9) 76 (26.3) <0.001 20 (10.2) 82 (21.0) 0.001
Hypertension‡ (%) 108 (76.1) 235 (81.3) 0.203 153 (78.1) 323 (82.8) 0.164
Current smoker (%) 54 (38.0) 108 (37.4) 0.979 4 (2.0) 4 (1.0) 0.534
Current drinker (%) 107 (75.4) 213 (73.7) 0.154 45 (23.0) 69 (17.7) 0.159
Regular exercise (%) 39 (27.5) 76 (26.3) 0.887 47 (24.0) 102 (26.2) 0.639
No. of metabolic syndrome
components at baseline (%) <0.001 <0.001
3 105 (73.9) 140 (48.4) 155 (79.1) 176 (45.1)
4 35 (24.7) 106 (36.7) 39 (19.9) 154 (39.5)
5 2 (1.4) 43 (14.9) 2 (1.0) 60 (15.4)
BP, blood pressure; HDL, high-density lipoprotein; LDL, low-density lipoprotein; hs-CRP, high sensitivity-C reactive protein; HOMA-IR, homeostasis model assess- ment of insulin resistance; L/A ratio, ratio of serum leptin to adiponectin.
Values are expressed as mean (SD), number (%), or median (25th, 75th percentiles).
*p value from Mann-Whitney U test, †Diabetes is defined as fasting serum glucose ≥126 mg/dL or current usage of antidiabetics, ‡Hypertension is defined as systolic BP ≥140 mm Hg or diastolic BP ≥90 mm Hg or current usage of antihypertensives.
components of metabolic syndrome at baseline (51.6% of men and 54.9% of women). The baseline characteristics of study subjects according to tertiles of L/A ratio are shown in Supple- mentary Table 1 (only online).
Fig. 1 shows the proportion of individuals who experienced regression of metabolic syndrome according to baseline leptin and adiponectin tertiles. The proportions of regression of meta- bolic syndrome in the highest tertile of leptin and the lowest tertile of adiponectin were 17.6 % in men and 22.2% in women, respectively. Proportions of regression of metabolic syndrome in the lowest tertile of leptin and the highest tertile of adiponec- tin were 46.8 % in men and 62.8% in women, respectively.
Table 2 shows the odds ratios for regression of metabolic syn-
drome according to tertiles of baseline L/A ratio. In men, after adjustment for several confounding factors, such as age, smok- ing, alcohol consumption, regular exercise, baseline body mass index, hs-CRP level, HOMA-IR, and changes in body weight, the odds ratio for the regression of metabolic syndrome in the lowest tertile of L/A ratio was 1.84 (95% CI 1.02–3.31), com- pared to the highest tertile of L/A ratio (p for trend=0.036). In women, after multivariable adjustment, the odds ratio for the regression of metabolic syndrome in the lowest tertile of L/A ratio was 2.32 (95% CI 1.37–3.91), compared to the highest ter- tile of L/A ratio (p for trend=0.002).
Table 3 shows the odds ratios for regression of each metabol- ic syndrome component according to baseline L/A ratios. In
Fig. 1. Proportion (%) of regression of metabolic syndrome according to baseline leptin (ng/mL) and adiponectin (µg/mL) tertiles. Leptin T1: <2.45 in men,
<8.02 in women; Leptin T2: 2.45–3.89 in men, 8.02–12.68 in women; Leptin T3: ≥3.90 in men, ≥12.69 in women; Adiponectin T1: <4.61 in men, <7.69 in women;
Adiponectin T2: 4.61–6.95 in men, 7.69–11.12 in women; Adiponectin T3: ≥6.96 in men, ≥11.13 in women.
60%
40%
20%
0%
60%
40%
20%
0%
Men Women
Leptin T1 Leptin T2 Leptin T3 Leptin T1 Leptin T2 Leptin T3
Adiponectin T3 Adiponectin T3
Adiponectin T2 Adiponectin T2
Adiponectin T1 Adiponectin T1
Table 2. Odds Ratios for Regression of Metabolic Syndrome According to Baseline L/A Ratio
L/A ratio
Tertile 3 Tertile 2 Tertile 1 p for trend
Men
L/A ratio, mg/g ≥0.749 0.391–0.748 <0.391
Regression of metabolic syndrome on follow-up, n (%) 34 (23.6) 44 (30.8) 64 (44.4) Regression of Metabolic syndrome, OR (95% CI)
Model 1 1.00 1.48 (0.87–2.50) 2.69 (1.62–4.49) <0.001
Model 2 1.00 1.46 (0.86–2.49) 2.86 (1.70–4.81) <0.001
Model 3 1.00 1.15 (0.66–2.02) 1.81 (1.03–3.20) 0.035
Model 4 1.00 1.13 (0.63–2.01) 1.84 (1.02–3.31) 0.036
Women
L/A ratio, mg/g ≥1.502 0.813–1.501 <0.813
Regression of metabolic syndrome on follow-up, n (%) 43 (22.1) 57 (29.2) 96 (49.0) Regression of Metabolic syndrome, OR (95% CI)
Model 1 1.00 1.49 (0.94–2.36) 3.69 (2.35–5.79) <0.001
Model 2 1.00 1.54 (0.97–2.47) 3.71 (2.34–5.87) <0.001
Model 3 1.00 1.22 (0.75–1.98) 2.08 (1.24–3.47) 0.005
Model 4 1.00 1.31 (0.80–2.14) 2.32 (1.37–3.91) 0.002
L/A ratio, ratio of serum leptin to adiponectin; OR, odds ratio; CI, confidence interval; hs-CRP, high sensitivity-C reactive protein; HOMA-IR, homeostasis model assessment of insulin resistance.
Model 1: adjusted for age. Model 2: Model 1+additionally adjusted for smoking, alcohol consumption, regular exercise. Model 3: Model 2+additionally adjusted for baseline body mass index, hs-CRP, HOMA-IR. Model 4: Model 3+changes in body weight.
men, the corresponding odds ratios (95% CI) for disappearance of high waist circumference, low HDL cholesterol, high triglyc- eride, high blood pressure, and high blood glucose level were 4.23 (1.81–9.88), 1.28 (0.67–2.42), 1.72 (0.96–3.06), 1.15 (0.67–
1.98), and 3.63 (1.50–8.76), respectively, in the lowest compared to the highest tertile of L/A ratio. Low L/A ratios were signifi- cantly associated with improvement of waist circumference and blood glucose level in men. In women, the corresponding odds ratios (95% CI) for disappearance of high waist circumfer- ence, low HDL cholesterol and high triglyceride levels, high blood pressure, and high blood glucose level were 2.31 (1.01–
5.28), 1.50 (0.80–2.82), 1.41 (0.76–2.59), 1.49 (0.86–2.59), and
1.33 (0.52–3.41), respectively, in the lowest compared to the highest tertile of L/A ratio. Low L/A ratios were significantly as- sociated with improvement of waist circumference in women.
Fig. 2 shows the comparison of the predictive powers of se- rum levels of leptin, adiponectin, and L/A ratio for regression of metabolic syndrome. In both sexes, L/A ratio had a higher pre- dictive power than serum adiponectin for regression of meta- bolic syndrome (AUROC of L/A ratio vs. adiponectin, 0.613 vs.
0.558, p=0.024 for men; 0.662 vs. 0.616, p=0.019 for women). L/
A ratio also showed a higher predictive power than serum leptin for regression of metabolic syndrome in women (AUROC of L/A ratio vs. leptin, 0.662 vs. 0.630, p=0.047 for women).
Table 3. ORs for Regression of Metabolic Syndrome Components According to Baseline L/A Ratio
Serum L/A ratio
Tertile 3 Tertile 2 Tertile 1 p for trend
Men
L/A ratio, mg/g ≥0.749 0.391–0.748 <0.391
High waist circumference, OR (95% CI)* 1.00 2.89 (1.25–6.65) 4.23 (1.81–9.88) <0.001
Low HDL cholesterol, OR (95% CI)* 1.00 1.07 (0.55–2.07) 1.28 (0.67–2.42) 0.453
High triglyceride, OR (95% CI)* 1.00 0.95 (0.53–1.72) 1.72 (0.96–3.06) 0.066
High blood pressure, OR (95% CI)* 1.00 1.24 (0.73–2.10) 1.15 (0.67–1.98) 0.599
High blood glucose, OR (95% CI)* 1.00 2.05 (0.85–4.97) 3.63 (1.50–8.76) 0.004
Women
L/A ratio, mg/g ≥1.502 0.813–1.501 <0.813
High waist circumference, OR (95% CI)* 1.00 1.70 (0.75–3.87) 2.31 (1.01–5.28) 0.048
Low HDL cholesterol, OR (95% CI)* 1.00 0.95 (0.52–1.74) 1.50 (0.80–2.82) 0.198
High triglyceride, OR (95% CI)* 1.00 1.48 (0.88–2.51) 1.41 (0.76–2.59) 0.242
High blood pressure, OR (95% CI)* 1.00 0.80 (0.47–1.36) 1.49 (0.86–2.59) 0.151
High blood glucose, OR (95% CI)* 1.00 0.44 (0.18–1.13) 1.33 (0.52–3.41) 0.663
L/A ratio, ratio of serum leptin to adiponectin; OR, odds ratio; CI, confidence interval; HDL, high-density lipoprotein; hs-CRP, high sensitivity-C reactive protein;
HOMA-IR, homeostasis model assessment of insulin resistance.
Adjusted for age, smoking, alcohol consumption, regular exercise, baseline body mass index, hs-CRP, HOMA-IR, changes in body weight.
*Subjects without each component of metabolic syndrome at baseline have been excluded.
Fig. 2. Comparison of predictive powers of serum levels of leptin, adiponectin and L/A ratio for regression of metabolic syndrome. AUROC, area under the receiver operating characteristics curve; L/A ratio, ratio of leptin to adiponectin.
1.00
0.75
0.50
0.25
0.00
1.00
0.75
0.50
0.25
0.00
Sensitivity Sensitivity
Men Women
0.00 0.25 0.50 0.75 1.00 0.00 0.25 0.50 0.75 1.00
1-specificity 1-specificity
AUROC AUROC
p=0.888 p=0.024 p=0.047 p=0.019
L/A ratio: 0.613 Leptin: 0.610 Adiponectin: 0.558
L/A ratio: 0.662 Leptin: 0.630 Adiponectin: 0.616
Further, we assessed the prospective association between baseline L/A ratio and development of metabolic syndrome in 1610 subjects without metabolic syndrome at baseline (Supple- mentary Table 2, only online). A higher L/A ratio was associated with an increased risk of developing metabolic syndrome in both men and women (p for trend=0.029 in men; p for trend <0.036 in women).
DISCUSSION
This is the first study to report the impact of L/A ratio on the re- gression of metabolic syndrome in high-risk individuals. The L/
A ratio showed an inverse association with the regression of metabolic syndrome and had a higher predictive power than serum adiponectin for regression of metabolic syndrome in both men and women.
Metabolic syndrome is a constellation of several cardiovas- cular risk factors, which is a growing public health concern.18 Several biomarkers have been proposed for early detection of metabolic syndrome. The two adipokines, leptin and adiponec- tin, were suggested as being associated with risk of metabolic syndrome in different ethnic populations.10,19,20 Several studies have proposed L/A ratio to be a better marker for the prevalence of metabolic syndrome than leptin or adiponectin alone.13,21 A cross-sectional study conducted in a Chinese population re- ported that L/A ratio exhibits higher AUROC than adiponectin levels for predicting the prevalence of metabolic syndrome.22 Furthermore, our prospective findings additionally suggest that L/A ratio is a useful predictor for the regression of metabolic syndrome in high-risk individuals.
In the current study, low L/A ratio was associated with the re- gression of metabolic syndrome. Low leptin and high adiponec- tin levels could provide protection against the development of metabolic disorders.8,10 These findings have been explained by the pro-inflammatory effects of leptin and anti-inflammatory effects of adiponectin.3 Both leptin and adiponectin regulate ni- tric oxide production in endothelial cells and affect the renin- angiotensin-aldosterone system.23-26 In addition, leptin activates the sympathetic nervous system and causes chronic elevations in blood pressure.27 Leptin, serving as a cofactor of TGF-beta ac- tivation, also promotes vascular endothelial cell proliferation.28
Leptin and adiponectin levels are closely associated with amounts of body fat. Excess adiposity is associated with up-reg- ulation of leptin production and down-regulation of adiponec- tin production, contributing to insulin resistance and metabolic disorders, such as type 2 diabetes, hypertension, and dyslipid- emia.10,29-31 Leptin levels have been reported to be proportional to body adiposity and to be high in obese individuals.32 Adipo- nectin levels are known to be negatively associated with intra- abdominal fat mass and to be positively associated with insulin sensitivity.33 These are in accordance with our findings, show- ing low L/A ratio as a predictor for improvement of waist cir-
cumference.
Another important finding of the present study was that low L/A ratio was associated with improvement of fasting blood glu- cose in men. This finding is in line with previous studies report- ing sex-based differences, in which higher leptin levels predict development of diabetes mellitus in men but not in women.34,35 In women, the leptin levels are higher than those in men be- cause of the higher proportion of adipose tissue and elevated production rate of leptin per unit mass of adipose tissue in wom- en.36 Sex-based differences in adiponectin levels have also been reported, and it has been hypothesized that androgens inhibit secretion of adiponectin, resulting in lower levels of adiponectin in men.37 Furthermore, sex-based differences in fat distribution may play a role in pathophysiology of leptin and adiponectin se- creted from adipocytes, as women have more subcutaneous fat than men.38 Further studies are needed to understand sex-based differences in the association of L/A ratio with regression of metabolic syndrome components.
Several limitations of this study should be considered. First, we measured total adiponectin levels to calculate the L/A ratio, but not high molecular weight adiponectin. Several reports have suggested that high molecular weight adiponectin is the active form of adiponectin.39 Further work is required to investigate the role of leptin and the high molecular weight adiponectin ratio in metabolic syndrome. Second, our analyses were based on a sin- gle measurement of serum leptin and adiponectin, which may be a source of random error. Third, the present study was limited to middle-aged and older individuals living in rural areas of Ko- rea. Thus, our findings may not be generalizable to other popu- lations. Fourth, we have not considered treatment with antihy- percholesterolemic drug in metabolic syndrome criteria of HDL and triglyceride, because medication history on hypercholester- olemia was not scrutinized in detail.
In conclusion, low L/A ratio was found to be independently associated with regression of metabolic syndrome. Further- more, L/A ratio provided significant adjunctive information of use in predicting the regression of metabolic syndrome beyond adiponectin alone. These findings suggest that the L/A ratio could be a useful clinical marker for management of high-risk individuals with metabolic syndrome.
ACKNOWLEDGEMENTS
This study was supported in part by a grant of the Korea Centers for Disease Control and Prevention (2005-E71013-00, 2006- E71002-00, 2007-E71013-00, 2008-E71004-00, 2009-E71006-00, 2010-E71003-00).
REFERENCES
1. Wang P, Mariman E, Renes J, Keijer J. The secretory function of adipocytes in the physiology of white adipose tissue. J Cell Physiol 2008;216:3-13.
2. Bartness TJ, Song CK. Thematic review series: adipocyte biology.
Sympathetic and sensory innervation of white adipose tissue. J Lipid Res 2007;48:1655-72.
3. Fantuzzi G. Adipose tissue, adipokines, and inflammation. J Al- lergy Clin Immunol 2005;115:911-9.
4. Matsuzawa Y, Funahashi T, Nakamura T. Molecular mechanism of metabolic syndrome X: contribution of adipocytokines adipo- cyte-derived bioactive substances. Ann N Y Acad Sci 1999;892:146- 54.
5. Ouchi N, Kihara S, Arita Y, Okamoto Y, Maeda K, Kuriyama H, et al.
Adiponectin, an adipocyte-derived plasma protein, inhibits en- dothelial NF-kappaB signaling through a cAMP-dependent path- way. Circulation 2000;102:1296-301.
6. Kawanami D, Maemura K, Takeda N, Harada T, Nojiri T, Imai Y, et al. Direct reciprocal effects of resistin and adiponectin on vascu- lar endothelial cells: a new insight into adipocytokine-endothelial cell interactions. Biochem Biophys Res Commun 2004;314:415-9.
7. Weyer C, Funahashi T, Tanaka S, Hotta K, Matsuzawa Y, Pratley RE, et al. Hypoadiponectinemia in obesity and type 2 diabetes: close association with insulin resistance and hyperinsulinemia. J Clin Endocrinol Metab 2001;86:1930-5.
8. Kim JY, Ahn SV, Yoon JH, Koh SB, Yoon J, Yoo BS, et al. Prospective study of serum adiponectin and incident metabolic syndrome:
the ARIRANG study. Diabetes Care 2013;36:1547-53.
9. Friedman JM, Halaas JL. Leptin and the regulation of body weight in mammals. Nature 1998;395:763-70.
10. Patel SB, Reams GP, Spear RM, Freeman RH, Villarreal D. Leptin:
linking obesity, the metabolic syndrome, and cardiovascular dis- ease. Curr Hypertens Rep 2008;10:131-7.
11. Segal KR, Landt M, Klein S. Relationship between insulin sensitivity and plasma leptin concentration in lean and obese men. Diabe- tes 1996;45:988-91.
12. Finucane FM, Luan J, Wareham NJ, Sharp SJ, O’Rahilly S, Balkau B, et al. Correlation of the leptin:adiponectin ratio with measures of insulin resistance in non-diabetic individuals. Diabetologia 2009;52:2345-9.
13. Yoon JH, Park JK, Oh SS, Lee KH, Kim SK, Cho IJ, et al. The ratio of serum leptin to adiponectin provides adjunctive information to the risk of metabolic syndrome beyond the homeostasis model as- sessment insulin resistance: the Korean Genomic Rural Cohort Study. Clin Chim Acta 2011;412:2199-205.
14. Satoh N, Naruse M, Usui T, Tagami T, Suganami T, Yamada K, et al.
Leptin-to-adiponectin ratio as a potential atherogenic index in obese type 2 diabetic patients. Diabetes Care 2004;27:2488-90.
15. Matthews DR, Hosker JP, Rudenski AS, Naylor BA, Treacher DF, Turner RC. Homeostasis model assessment: insulin resistance and beta-cell function from fasting plasma glucose and insulin concen- trations in man. Diabetologia 1985;28:412-9.
16. Alberti KG, Eckel RH, Grundy SM, Zimmet PZ, Cleeman JI, Donato KA, et al. Harmonizing the metabolic syndrome: a joint interim statement of the international diabetes federation task force on epi- demiology and prevention; national heart, lung, and blood Insti- tute; American heart association; world heart federation; interna- tional atherosclerosis society; and international association for the study of obesity. Circulation 2009;120:1640-5.
17. Lee SY, Park HS, Kim DJ, Han JH, Kim SM, Cho GJ, et al. Appropri- ate waist circumference cutoff points for central obesity in Korean adults. Diabetes Res Clin Pract 2007;75:72-80.
18. Eckel RH, Grundy SM, Zimmet PZ. The metabolic syndrome. Lan- cet 2005;365:1415-28.
19. Trujillo ME, Scherer PE. Adiponectin--journey from an adipocyte secretory protein to biomarker of the metabolic syndrome. J In- tern Med 2005;257:167-75.
20. Gannagé-Yared MH, Khalife S, Semaan M, Fares F, Jambart S, Hala- by G. Serum adiponectin and leptin levels in relation to the meta- bolic syndrome, androgenic profile and somatotropic axis in healthy non-diabetic elderly men. Eur J Endocrinol 2006;155:167-76.
21. Kumagai S, Kishimoto H, Masatakasuwa, Zou B, Harukasasaki. The leptin to adiponectin ratio is a good biomarker for the prevalence of metabolic syndrome, dependent on visceral fat accumulation and endurance fitness in obese patients with diabetes mellitus.
Metab Syndr Relat Disord 2005;3:85-94.
22. Zhuo Q, Wang Z, Fu P, Piao J, Tian Y, Xu J, et al. Comparison of adi- ponectin, leptin and leptin to adiponectin ratio as diagnostic mark- er for metabolic syndrome in older adults of Chinese major cities.
Diabetes Res Clin Pract 2009;84:27-33.
23. Kimura K, Tsuda K, Baba A, Kawabe T, Boh-oka S, Ibata M, et al. In- volvement of nitric oxide in endothelium-dependent arterial relax- ation by leptin. Biochem Biophys Res Commun 2000;273:745-9.
24. Chen H, Montagnani M, Funahashi T, Shimomura I, Quon MJ. Adi- ponectin stimulates production of nitric oxide in vascular endo- thelial cells. J Biol Chem 2003;278:45021-6.
25. Ouchi N, Kobayashi H, Kihara S, Kumada M, Sato K, Inoue T, et al.
Adiponectin stimulates angiogenesis by promoting cross-talk be- tween AMP-activated protein kinase and Akt signaling in endo- thelial cells. J Biol Chem 2004;279:1304-9.
26. Xie D, Bollag WB. Obesity, hypertension and aldosterone: is leptin the link? J Endocrinol 2016;230:F7-11.
27. Carlyle M, Jones OB, Kuo JJ, Hall JE. Chronic cardiovascular and re- nal actions of leptin: role of adrenergic activity. Hypertension 2002;
39(2 Pt 2):496-501.
28. Wolf G, Hamann A, Han DC, Helmchen U, Thaiss F, Ziyadeh FN, et al. Leptin stimulates proliferation and TGF-beta expression in renal glomerular endothelial cells: potential role in glomerulo- sclerosis [seecomments]. Kidney Int 1999;56:860-72.
29. Wannamethee SG, Lowe GD, Rumley A, Cherry L, Whincup PH, Sattar N. Adipokines and risk of type 2 diabetes in older men. Dia- betes Care 2007;30:1200-5.
30. Iwashima Y, Katsuya T, Ishikawa K, Ouchi N, Ohishi M, Sugimoto K, et al. Hypoadiponectinemia is an independent risk factor for hypertension. Hypertension 2004;43:1318-23.
31. Matsubara M, Maruoka S, Katayose S. Decreased plasma adipo- nectin concentrations in women with dyslipidemia. J Clin Endo- crinol Metab 2002;87:2764-9.
32. Beltowski J. Leptin and atherosclerosis. Atherosclerosis 2006;189:
47-60.
33. Cnop M, Havel PJ, Utzschneider KM, Carr DB, Sinha MK, Boyko EJ, et al. Relationship of adiponectin to body fat distribution, in- sulin sensitivity and plasma lipoproteins: evidence for indepen- dent roles of age and sex. Diabetologia 2003;46:459-69.
34. McNeely MJ, Boyko EJ, Weigle DS, Shofer JB, Chessler SD, Leon- netti DL, et al. Association between baseline plasma leptin levels and subsequent development of diabetes in Japanese Americans.
Diabetes Care 1999;22:65-70.
35. Söderberg S, Zimmet P, Tuomilehto J, Chitson P, Gareeboo H, Al- berti KG, et al. Leptin predicts the development of diabetes in Mau- ritian men, but not women: a population-based study. Int J Obes (Lond) 2007;31:1126-33.
36. Hellström L, Wahrenberg H, Hruska K, Reynisdottir S, Arner P.
Mechanisms behind gender differences in circulating leptin levels.
J Intern Med 2000;247:457-62.
37. Nishizawa H, Shimomura I, Kishida K, Maeda N, Kuriyama H, Nagaretani H, et al. Androgens decrease plasma adiponectin, an insulin-sensitizing adipocyte-derived protein. Diabetes 2002;51:
2734-41.
38. Boyne MS, Bennett NR, Cooper RS, Royal-Thomas TY, Bennett FI,
Luke A, et al. Sex-differences in adiponectin levels and body fat dis- tribution: longitudinal observations in Afro-Jamaicans. Diabetes Res Clin Pract 2010;90:e33-6.
39. Seino Y, Hirose H, Saito I, Itoh H. High-molecular-weight adipo-
nectin is a predictor of progression to metabolic syndrome: a pop- ulation-based 6-year follow-up study in Japanese men. Metabo- lism 2009;58:355-60.