J Korean Surg Soc 2012;82:271-280 http://dx.doi.org/10.4174/jkss.2012.82.5.271
ORIGINAL ARTICLE
Journal of the Korean Surgical Society
JKSS
pISSN 2233-7903ㆍeISSN 2093-0488
Received November 11, 2011, Revised March 15, 2012, Accepted March 21, 2012 Correspondence to: Sun Wook Kim
Division of Endocrinology and Metabolism, Department of Medicine, Samsung Medical Center, 81 Irwon-ro, Gangnam-gu, Seoul 135-710, Korea
Tel: +82-2-3410-1653, Fax: +82-2-6918-4653, E-mail: [email protected]
cc Journal of the Korean Surgical Society is an Open Access Journal. All articles are distributed under the terms of the Creative Commons Attribution Non-Commercial License (http://creativecommons.org/licenses/by-nc/3.0/) which permits unrestricted non-commercial use, distribution, and reproduction in any medium, provided the original work is properly cited.
Gene expression profiling of papillary thyroid carcinomas in Korean patients by oligonucleotide microarrays
Ki-Wook Chung, Seok Won Kim, Sun Wook Kim
1Center for Thyroid Cancer, Research Institute and Hospital, National Cancer Center, Goyang, 1Division of Endocrinology and Metabolism, Department of Medicine, Samsung Medical Center, Sungkyunkwan University School of Medicine, Seoul, Korea
Purpose: The incidence of papillary thyroid carcinomas (PTCs) is rapidly increasing in Korea. Analyzing the gene expression profiling (GEP) of PTCs will facilitate the advent of new methods in diagnosis, prognostication, and treatment. We per- formed this study to find the GEP of Korean PTCs. Methods: We performed oligonucleotide microarray analysis with 19 PTCs and 7 normal thyroid glands. Differentially expressed genes were selected using a t-test (|fold| >3) and adjusted Benjamini-Hochberg false discovery rate P-value < 0.01. Quantitative reverse transcription-polymerase chain reaction (QRT-PCR) was used to validate microarray data. A classification model was developed by support vector machine (SVM) al- gorithm to diagnose PTCs based on molecular signatures. Results: We identified 79 differentially expressed genes (70 up-regulated and 9 down-regulated) according to the criteria. QRT-PCR for five genes (CDH3, NGEF, PROS1, TGFA, MET) was confirmatory of the microarray data. Hierarchical cluster analysis and a classification model by the SVM algorithm accu- rately differentiated PTCs from normal thyroid gland based on GEP. Conclusion: A disease classification model showed ex- cellent accuracy in diagnosing PTCs, thus showing the possibility of molecular diagnosis in the future. This GEP could serve as baseline data for further investigation in the management of PTCs based on molecular signatures.
Key Words: Thyroid neoplasms, Papillary, Microarray, Gene expression profiling
INTRODUCTION
The incidence of thyroid carcinoma is rapidly increas- ing in Korea and in several regions of the world [1-3]; most of the increase is due to the early detection of small papil- lary thyroid carcinoma (PTC). In Korea, PTCs comprise approximately 95% of thyroid carcinomas and 90% are PTCs of the classic type [4].
Although fine needle aspiration biopsy (FNAB) is the choice of diagnostic tests for most thyroid nodules, an in- determinate (10 to 20%) and inadequate (10 to 15%) diag- nosis imposes a dilemma for clinicians and undermines the diagnostic value of FNABs. In this context, several mo- lecular diagnostic techniques focusing on the detection of genetic alterations have been designed, but this approach also has limitations because genetic alterations are not
found in all thyroid carcinomas. Thus, there is a hope that detection of differential gene expression profiling (GEP) of thyroid carcinomas can be used as a diagnostic marker and improve the diagnostic value of FNABs of thyroid nodules.
Paik et al. [5] proposed that GEP of 21 genes selected from previous published microarray analyses can accu- rately predict the prognosis of patients with breast cancer.
It is also possible that the accumulation of microarray and clinic-pathologic data will facilitate the use of GEP in esti- mating the prognosis of thyroid carcinomas.
Furthermore, analyzing the pattern of GEP in PTCs will shed light for identifying a molecular target of treatment and the adoption of personalized molecular medicine in treatment.
In this study we determined the global GEP of PTCs in Korean patients compared to normal thyroid gland tissues using oligonucleotide microarray, which contains 24,000 transcripts. We also tested five up-regulated genes to vali- date the microarray technique.
METHODS
Tissue samples
The samples for this study were randomly selected and obtained from 19 PTCs and 7 controls of normal thyroid tissue from contra-lateral lobes (all paired with PTCs) at the time of surgery from patients who underwent total thyroidectomies at the National Cancer Center between December 2006 and December 2007. All contra-lateral lobes were normal on preoperative ultrasound imaging.
Gross specimens were carefully examined to reduce the chance of including occult carcinoma in control samples.
The tissues were immediately snap-frozen and stored at -80oC until use. The purity of the samples was confirmed by microscopic examination under frozen section before RNA extraction. All carcinoma samples contained pure carcinomas and normal thyroid tissue. The medical re- cords were reviewed to define the clinical features of each case. Informed consent was obtained from all patients.
This study was approved by the Institutional Review Board of the National Cancer Center.
RNA preparation
Total RNA was extracted using Trizol (Invitrogen, Carlsbad, CA, USA) and purified using RNeasy columns (Qiagen, Hilden, Germany) according to the manu- facturers’ protocols. After processing with DNase diges- tion and clean-up procedures, RNA samples were quanti- fied, aliquotted, and stored at -80°C until use. For quality control, RNA purity and integrity were evaluated by de- naturing gel electrophoresis (OD 260/280 ratio) and ana- lyzed on an Agilent 2100 Bioanalyzer (Agilent Technolo- gies, Santa Clara, CA, USA).
Oligonucleotide microarray analysis
Total RNA was amplified and purified using the Ambion Illumina RNA amplification kit (Ambion, Austin, TX, USA) to yield biotinylated cRNA according to the manufacturer’s instructions. Briefly, 550 ng of total RNA was reverse-transcribed to cDNA using a T7 oligo(dT) primer. Second-strand cDNA was synthesized, in vitro- transcribed, and labeled with biotin-NTP. After purifica- tion, the cDNA was quantified using a ND-1000 Spec- trophotometer (NanoDrop, Wilmington, DE, USA). Label- ed cDNA (750 ng) samples were hybridized to each Illumina Human-8 Expression Bead Chip (Illumina Inc., San Diego, CA, USA) for 16 to 18 hours at 58oC according to the manufacturer's instructions. The Human-8 Express- ion Bead Chip microarray contains 23920 probes derived from the National Center for Biotechnology Information Reference Sequence (NCBI RefSeq) database (Build 36.2, Release 22). Detection of the array signal was carried out using Amersham fluorolink streptavidin-Cy3 (GE Healthcare Bio-Sciences, Piscataway, NJ, USA) following the bead array manual. Arrays were scanned with an Illumina BeadArray Reader (Illumina Inc.) confocal scan- ner according to the manufacturer's instructions.
Data analysis
Array data export processing and analysis was perfor- med using Illumina BeadStudio ver. 2.1.12 (Illumina Inc.).
The quality of hybridization and overall chip performance were monitored by visual inspection of both internal qual- ity control checks and the raw scanned data. Raw data were extracted and filtered by a detection P-value < 0.05
Characteristic Value
Age (yr) 48.3 ± 3.08
Female gender 15 (78.9)
Peri-thyroidal soft tissue extension 15 (78.9)
Gross extension 3 (15.8)
Multi-focality 8 (42.1)
Angiolymphatic invasion 6 (31.6) Lymph node metastasis
Central 9 (47.4)
Lateral 4 (21.1)
Stagea)
I 10 (52.6)
II 0 (0)
III 6 (31.6)
IV 3 (15.8)
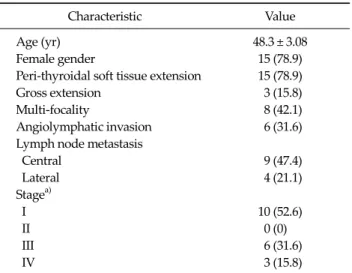
Values are presented as mean ± SD or number (%).
a)American Joint Committee on Cancer, 6th ed., stage of disease.
Table 1. Clinical characteristics of patients with papillary thyroid carcinomas (n = 19)
(similar to signal-to-noise) in at least 50% of the samples; a filtering criterion for data analysis was applied and a high- er signal value was required to obtain a detection P-value
< 0.05. The selected gene signal value was transformed by logarithm and normalized by the quantile method. The comparative analysis between PTCs and controls (normal thyroid gland) was carried out using a t-test (|fold|>3) and an adjusted Benjamini-Hochberg false discovery rate (FDR) P-value < 0.01 [6].
Hierarchical cluster analysis was performed using com- plete linkage and Euclidean distance as a measure of similarity. Classifications were made using a support vec- tor machine (SVM) algorithm in ArrayAssist (Stratagene, La Jolla, CA, USA); 16 samples (10 PTCs and 6 controls) were used by training, and 10 samples (9 PTCs and 1 con- trol) were validated. All data analysis and visualization of differentially expressed genes was conducted using ArrayAssist. Biological pathway and gene function-based analysis were performed by using the protein analysis through evolutionary relationships (PANTHER) database (http://www.pantherdb.org). The PANTHER classifica- tion system is a resource that classifies genes by function using published scientific experimental evidence and evo- lutionary relationships to predict function even in the ab- sence of direct experimental evidence.
Quantitative reverse transcription-polymerase chain reaction (QRT-PCR)
A TaqMan real-time RT-PCR kit (Applied Biosystems, Foster City, CA, USA) was used to detect and quantify spe- cific mRNA expression in PTCs and controls. Briefly, a 2-μg aliquot of RNA was converted to cDNA using a high capacity cDNA reverse transcription kit (Applied Biosys- tems). The cDNA products are diluted and an aliquot of cDNA equivalent to 10 ng of total RNA was used for quan- titative real-time PCR performed using primers and TaqMan probes supplied from Applied Biosystems. The assays include cadherin 3, type 1, P-cadherin (CDH3, NM_001793.3), neuronal guanine nucleotide exchange factor (NGEF, NM_019850.1), met proto-oncogene (MET, NM_000245.2), protein S (PROS1, NM_000313.1), and transforming growth factor alpha (TGFA, NM_ 003236.1).
Glyceraldehyde-3-phosphate dehydrogenase (GAPDH)
was used as an endogenous control for normalizing the RNA concentration. Real-time PCR was performed with the ABI 7700 sequence detection system.
Standard thermal cycling cycle threshold (CT) values for each gene were obtained for each sample. Differences in the CT values between a test gene and endogenous con- trols (GAPDH) (ΔCT) were calculated and used for stat- istical analyses.
RESULTS
Patient characteristics
Nineteen classic PTC samples were collected and the normal thyroid glands of the contra-lateral lobe were gathered from seven out of nineteen patients for controls.
The mean age of the patients was 48.3 years (range, 29 to 78 years) and 78.9% of the patients (15/19) were females. The clinical characteristics of the patients with PTCs are pre- sented in Table 1.
Differentially-expressed genes in PTCs and normal thyroid glands
To identify the genes that were differentially-expressed between PTCs and normal thyroid gland tissues, we ap- plied a strict threshold in comparative analysis (a t-test
Gene symbol Accession no.a) Fold-change (T/N) Gene symbol Accession no. Fold-change (T/N)
CDH3 NM_001793.3 10.61 BHLHB3 NM_030762.1 3.62
PROS1 NM_000313.1 8.67 PERP NM_022121.2 3.60
NGEF NM_019850.1 8.08 EVA1 NM_005797.2 3.58
METTL7B NM_152637.1 7.72 DUSP4 NM_057158.2 3.58
FLJ41841 NM_207499.1 7.33 IL1RAP NM_002182.2 3.50
PDE5A NM_033437.2 6.45 XPR1 NM_004736.2 3.47
NRCAM NM_005010.2 6.32 PRSS23 NM_007173.3 3.47
TUSC3 NM_006765.2 6.18 TBC1D2 NM_018421.2 3.46
PSD3 NM_206909.1 6.02 HPN NM_002151.1 3.43
GALE NM_000403.3 6.01 ELF3 NM_004433.3 3.36
LONRF2 NM_198461.1 5.66 ARNTL NM_001178.4 3.33
SCEL NM_003843.2 5.19 C6orf168 NM_032511.1 3.32
CTXN1 NM_206833.1 5.00 ULBP2 NM_025217.2 3.32
GJB3 NM_001005752.1 4.97 ADRA1B NM_000679.3 3.31
KIAA1202 NM_020717.1 4.81 RXRG NM_006917.3 3.29
MFGE8 NM_005928.1 4.78 DOCK9 NM_015296.1 3.27
MXRA8 NM_032348.2 4.77 IER5L NM_203434.1 3.25
MTMR11 NM_181873.1 4.44 B3GNT3 NM_014256.2 3.25
CXorf6 NM_005491.1 4.36 CSF2 NM_000758.2 3.22
P4HA2 NM_001017974.1 4.36 HEY2 NM_012259.1 3.21
LAD1 NM_005558.3 4.24 SIPA1L2 NM_020808.1 3.21
ABCC3 NM_020037.1 4.19 ECE1 NM_001397.1 3.21
MET NM_000245.2 4.11 ADAMTS9 NM_182920.1 3.20
KLK10 NM_145888.1 4.09 IGF2BP2 NM_006548.4 3.19
CLDN9 NM_020982.2 4.09 WIG1 NM_152240.1 3.14
EVA1 NM_144765.1 4.09 PPL NM_002705.3 3.14
PTPRE NM_006504.3 3.97 LIFR NM_002310.3 -3.12
SDC4 NM_002999.2 3.90 FLJ37266 NM_175892.3 -3.16
STK32A NM_145001.1 3.83 MAFB NM_005461.3 -3.33
TPD52L1 NM_001003396.1 3.80 BMP2 NM_001200.1 -3.38
ERBB3 NM_001982.2 3.79 ARHGAP24 NM_001025616.1 -3.46
PDLIM4 NM_003687.2 3.79 TBC1D4 NM_014832.1 -3.58
PLAG1 NM_002655.1 3.76 PIP3-E NM_015553.1 -4.05
UPP1 NM_181597.1 3.72 ANKRD37 NM_181726.1 -4.29
EVA1 NM_144765.1 3.67
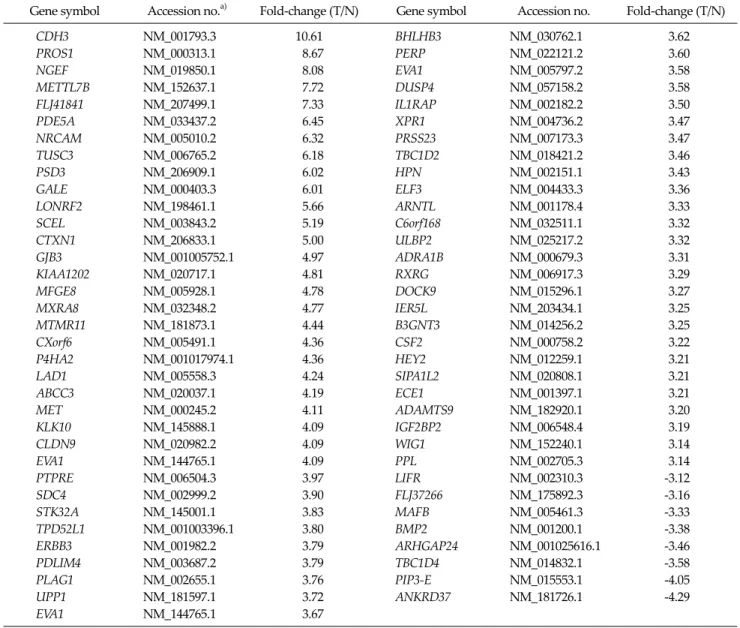
T, tumor; N, normal thyroid tissue.
a)Genbank gene identification number.
Table 2. List of differently-expressed genes in microarray analysis: negative fold-changes represent down-regulation of the gene
|fold| >3 and an adjusted Benjamini-Hochberg FDR P-value < 0.01). In the comparison analysis between 19 PTCs and 7 controls, 70 genes were identified as up-regu- lated and 9 genes as down-regulated in PTCs according to the criteria (Table 2).
When we classified 79 differentially-expressed genes according to their biological process and molecular func- tion using the PANTHER database, the highest involved biologic process was signal transduction (38%, 30/79) fol- lowed by the developmental process (19%, 15/79), protein metabolism/modification (16%, 13/79). According to mo-
lecular funtion classification, the receptor (14%, 11/79) is the leading functional class of differentially-expressed genes, followed by transcription factor (10%, 8/79), cell ad- hesion molecule (10%, 8/79), Detailed distributions of the differentially-expressed genes are displayed in Fig. 1A, B.
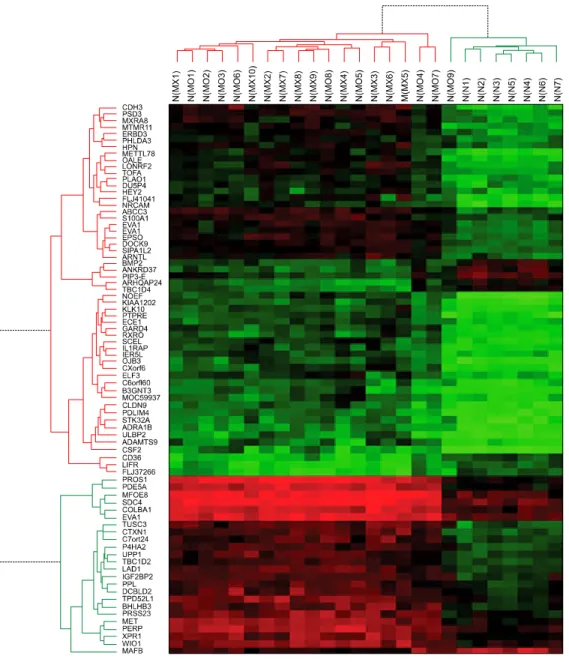
Hierarchical cluster analysis showed that PTCs were well-discriminated from controls, with the exception of one case which showed overlap between PTCs and con- trols, indicating the possibility of selecting a group of genes for the diagnosis of PTCs. Detailed results of hier- archical cluster analysis is shown in Fig. 2. Data from one
Fig. 1. Molecular characteristics of differentially expressed genes between papillary thyroid carcinomas and normal thyroid glands. (A) Molecular characteristics according to biological process (B) molecular characteristics according to molecular function.
Fig. 2. Hierarchical cluster analysis of genes associated with papillary thyroid carci- nomas (PTCs). Columns re- present 19 PTCs and 7 normal thyroid glands (con- trols). Rows show the 79 differentially expressed ge- nes between PTCs and controls. The heatmap indi- cates up-regulation (red), down-regulation (green) and average (black) gene expres- sion.
Fig. 3. Validation of microarray analysis by quantitative reverse transcription-polymerase chain reaction (QRT-PCR). Expression status was well-matched with QRT-PCR results, with the exception of non-equilibrium Green's function (NEGF). However, NEGF expression was up-regulated in oligonucleotide microarray ana- lysis and QRT-PCR results. CDH3, cadherin 3, type 1, P-cadherin;
NGEF, neuronal guanine nucleotide exchange factor; MET, met proto-oncogene; PROS1, protein S; TGFA, transforming growth factor alpha.
Identifier Class Predicted class Confidence measure
MX4a) PTC PTC 0.73727816
MX7 PTC PTC 0.7595941
MX8 PTC PTC 0.94525576
MX9 PTC PTC 0.79724693
MX10 PTC PTC 0.761422
MO3b) PTC PTC 0.7481214
MO6 PTC PTC 0.81863475
MO7 PTC PTC 0.5090502
MO9 PTC PTC 1
N2c) Normal Normal 0.94844013
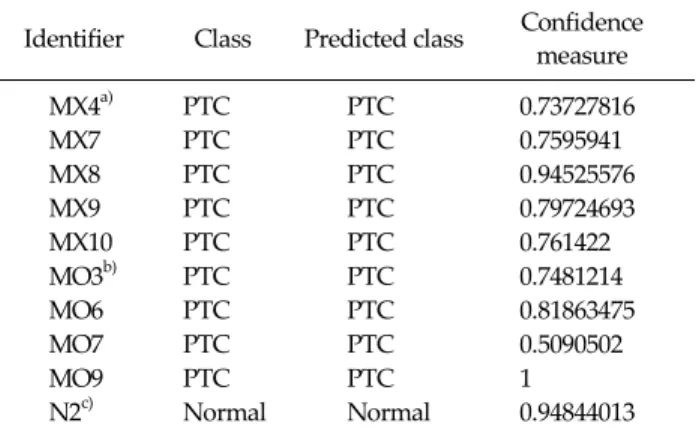
Probability of error was expected less than 0.01 when confidence measure was more than 0.5.
PTC, papillary thyroid carcinoma; Identifier, tissue identifi- cation number.
a)PTC with lymph node metastasis. b)PTC without lymph node metastasis. c)Normal thyroid tissue.
Table 3.Confidence measure to calculate accuracy of validation test. Nine PTCs and one normal thyroid tissues are completely discriminated from each other with 90 gene probe classification model
PTC sample which showed no discrimination is excluded in this figure.
Validation of the microarray-derived data by quantitative RT-PCR
To verify the reproducibility of these genes, we per- formed QRT-PCR using the same RNA used for micro- array analysis (Fig. 3). The following five representative genes were used: CDH3 (NM_001793.3), NGEF (NM_
019850.1), MET (NM_000245.2), PROS1 (NM_000313.1), and TGFA (NM_003236.1). GAPDH expression was ana- lyzed as a control. The QRT-PCR showed consistent re- sults with those obtained from the oligonuleotide micro- array, except that QRT-PCR showed a 3.9-fold increased expression compared to oligonucleotide microarray data for non-equilibrium Green's function (NEGF).
Classification by the SVM algorithm
Classification model by SVM algorithm was con- structed to differentiate PTC from normal thyroid tissue.
Ninety gene probes were selected from raw data with arbi- trary criteria of a FDR adjusted P-value < 0.01 and an ab- solute fold-change >3. A training classification model was formed according to the SVM algorithm from 10 PTCs and 6 controls. Probability of error was expected less than
0.01 when confidence measure was more than 0.5.
Training model discriminated PTC from normal thyroid tissue with 100% of accuracy. Then with this 90 probe clas- sification model, remaining samples from 9 PTCs and 1 control were used to validate possible prediction of PTC.
This validation test revealed also 100% accuracy in dis- criminating PTCs and normal thyroid gland (Table 3).
DISCUSSION
In this study, we performed GEP analysis using oligo- nucleotide microarray and identified 79 differentially-ex- pressed genes (70 up-regulated and 9 down-regulated) be- tween PTCs and normal thyroid glands which could serve as potential diagnostic and therapeutic targets in the man- agement of PTCs in Korean patients. This study also dem- onstrated the possibility of using differential gene ex- pression in the molecular diagnosis of PTCs using a classi- fication model designed by the SVM algorithm. This GEP analysis was performed with Illumina’s Human-8 Ex- pression Bead Chip, which contains 23920 probes derived from the NCBI RefSeq database. This oligonucleotide mi-
croarray has never been used for thyroid carcinomas.
Furthermore, the criteria of selection for differentially-ex- pressed genes were rather strict that the absolute fold-change >3 and a FDR adjusted P-value < 0.01 were adopted, whereas many other studies about microarray analysis of thyroid carcinomas used a 2-fold change and a P-value < 0.05 [7-9].
Genes associated with signal transduction were the most common up-regulated genes. This finding seems to be reasonable because the RAS-BRAF-MAPK and PI3K-AKt pathways are the most important molecular mechanisms in the carcinogenesis of PTCs [10]. However, cross-talking between other signal transduction pathways may be present because several genes associated with oth- er signal transduction pathways were found in our analysis.
A large-scale meta-analysis of cancer microarray data is known to differentiate important genes from false-pos- itive genes in a large number of candidate gene lists from DNA microarray data [11]. In that context, Griffith et al.
[12] conducted a comprehensive meta-analysis of thyroid carcinoma GEP studies in 2006 to identify meaningful biomarkers. Griffith et al. [12] reviewed 21 published stud- ies, in which 34 comparisons were performed from 10 dif- ferent expression platforms of microarrays and showed that 39 genes (23 up-regulated and 16 down-regulated in thyroid carcinoma) showed the same expression patterns among thyroid carcinoma, regardless of the tumor type, in an overlap of 3 or more studies. Among the 23 up-regu- lated genes in thyroid carcinoma from their study, 7 genes (MET, TGFA, PROS1, PSD3, SDC4, TUSC3, and P4HA2) were also selected as members of 70 up-regulated genes in our study. Recently, Kim et al. [13] reported gene ex- pression profiling of Korean PTCs. Their results showed different up-regulated or down-regulated genes with our results. Discordance between similarly designed studies may be caused from technical error or difficulties of re- producibility in microarray experiment. However, the present study included greater number of sample size and decreased chance of including parenchyma cells using mi- croscopic exam of tumor samples before RNA prepara- tion.
MET oncogene encodes the c-MET protein. c-Met pro-
tein is a hepatocellular growth factor receptor and is known to be responsible for the motility and mitogenesis of epithelial cells, including cancer cells [14]. Several stud- ies reported c-MET protein expression in thyroid carcino- ma as a useful diagnostic and prognostic marker [15].
Increased c-MET expression has been associated with a higher risk for metastasis [3] and recurrence [3,5] of PTCs.
TGFA encodes transforming growth factor alpha protein.
TGFA stimulates the growth and proliferation of cells and its over-expression has been correlated with patient sur- vival in a variety of tumors. TGFA is closely related to epi- dermal growth factor (EGF) and binds to the EGF re- ceptors (EGFR) as a ligand. TGFA is reported to be up-regulated in some human carcinomas [16]. Bergstrom et al. [17] proposed that increased expression of TGFA may cause aberrant activation of EGFRs and ultimately led to over-expression and activation of c-MET. PROS1 co- des for the vitamin-K-dependent plasma protein (protein S), which is an essential anticoagulant and multifunctional protein [18]. The association of protein S and thrombosis is well-established, but its role in cancer is not studied. The up-regulation of PROS1 was eminent in the meta-analysis of Griffith et al. [12] and our study also showed a marked increase of PROS1 transcripts in microarray (9-fold) and QRT-PCR (12-fold) among PTCs compared to normal thy- roid gland. PSD3 is located in chromosome 8p21. A meta-analysis of gene expression in breast carcinomas showed that PSD3 is down-regulated in metastasizing tu- mors and was identified as a candidate metastasis sup- pressor gene [19]. However, there are no reports about its role in thyroid carcinomas. SDC4 is found on chromosome 20 and encodes a transmembrane (type I) heparan sulfate proteoglycan that functions as a main cell adhesion re- ceptor involved in focal adhesion formation and is re- quired for cell migration [20]. Tumor suppressor candi- date 3 (TUSC3) is a candidate tumor suppressor gene and is located on chromosome 8p22, which is a homo- zygous-deleted region of a pancreatic cancer [21]. It is in- teresting that TUSC3 is up-regulated in PTCs, whereas it is down-regulated by chromosomal deletion in pancreas cancer. Prolyl 4-hydroxylase, alpha polypeptide II (P4HA2) is located in 5q31 and encodes a component of prolyl 4-hydroxylase, a key enzyme in collagen synthesis
composed of two identical alpha subunits and two beta subunits [22]. Prolyl 4-hydroxylase catalyzes the for- mation of 4-hydroxyproline, which is essential to the proper three-dimensional folding of newly synthesized procollagen chains. Teodoro et al. [23] reported that p53-mediated inhibition of angiogenesis in cancer is thor- ough via up-regulation of P4HA2.
In addition to the 7 genes in agreement with the meta- analysis of Griffith et al. [12], we focused on two more genes which showed increased up-regulation in this mi- croarray experiment (CDH3, 10.6-fold; NGEF, 8.1 fold).
CDH3 is the highest up-regulated gene in this microarray analysis. This gene is located on chromosome 16q22 and is a classical cadherin from the cadherin superfamily and encodes P-cadherin, which is a membrane glycoprotein that functionally mediates tumor cell adhesion [24]. P-cad- herin over-expression is strongly associated with tumor aggressiveness and a poor prognostic marker in breast cancer [25]. Furthermore, monoclonal antibody (PF- 03732010) against P-cadherin has anti-tumor and an- ti-metastatic activity in a tested xenograft model and is now in a Phase 1 clinical trial [26]. If PTCs overexpress P-cadherin, P-cadherin also could be a candidate for this kind of therapy in intractable cases with PTCs. NGEF is lo- cated on 2q37 and functions as a guanine nucleotide ex- change factor for the Rho-type GTPases. Although NGEF showed transforming potential in cell culture and was able to induce tumors in nude mice [27], further studies are lacking and its role in carcinogenesis needs to be clari- fied in the future. Interestingly, NEGF expression was more prominent in validation experiment using quantita- tive RT-PCR. This suggests that NEGF expression plays more important role in PTC because quantitative RT-PCR is more sensitive method to detect gene expression than microarray.
The diagnosis of PTC based on FNAB has limitations because of “indeterminate” results, which accounts for 15 to 20% of FNAB results [10]. Molecular diagnostic markers could be helpful to discriminate malignant thyroid nod- ules from benign nodules. Our GEP analysis using a SVM algorithm successfully discriminated PTCs from normal thyroid tissues. SVM algorithm is a powerful method to classify differences between two groups with large num-
ber of data. Yukinawa et al. [28] reported feasibility of GEP based diagnosis using SVM algorithm in thyroid tumors even though the accuracy was 85.7%. However, future study should select a more concise gene cluster to analyze it from FNAB samples because diagnosis of thyroid nod- ule are made by FNAB mostly [29].
There were some limitations in this study. First, al- though GEF is a powerful technique that is capable of pro- viding new leads in the understanding of molecular mech- anisms of PTCs, there still exists the possibility of false-positive discovery in the 79 selected genes of our study. Thus, the selected genes from our study need to be clarified about its role in carcinogenesis of PTCs through further studies. Second, we used mRNA from bulk tu- mors, which could contain inflammatory cells, stroma cells, endothelial cells, and fibroblasts in addition to can- cer cells. To reduce the bias from the contamination of the other aforementioned cells, Nikolova et al. [30] used a la- ser microdissection technique to enrich the tumor cell population in their microarray study. Although we did not use a microdissection method for the samples in this study, we checked every sample before mRNA extraction so that every tumor specimen should contain >90% of tu- mor cells. Thus, we think that this approach will reduce the chance of contamination from various cells other than PTCs.
In conclusion, we investigated GEP of PTCs compared with normal thyroid gland and identified 70 up-regulated and 9 down-regulated genes in PTCs. A disease classi- fication model using the SVM algorithm showed excellent accuracy in diagnosing PTCs only by GEP.
We anticipate that the results of this study involving GEP will shed light on a better understanding of PTCs in Korea and lead to discover novel diagnostic molecular tests of PTCs.
CONFLICTS OF INTEREST
No potential conflict of interest relevant to this article was reported.
ACKNOWLEDGEMENTS
This work was supported by a grant from the National Cancer Center (Number 0710230-1).
REFERENCES
1. Ministry of Health & Welfare; National Cancer Center.
Cancer facts and figures 2011 in the Republic Korea.
Goyang: National Cancer Center; 2011.
2. Yu GP, Li JC, Branovan D, McCormick S, Schantz SP.
Thyroid cancer incidence and survival in the national can- cer institute surveillance, epidemiology, and end results race/ethnicity groups. Thyroid 2010;20:465-73.
3. Davies L, Welch HG. Increasing incidence of thyroid can- cer in the United States, 1973-2002. JAMA 2006;295:2164-7.
4. Nishiyama RH. Pathology of tumors of the thyroid gland.
In: Clark OH, Duh QY, Kebebew E, editors. Textbook of en- docrine surgery. 2nd ed. Philadelphia: Elsevire Saunders;
2005. p.223-47.
5. Paik S, Shak S, Tang G, Kim C, Baker J, Cronin M, et al. A multigene assay to predict recurrence of tamoxifen- treat- ed, node-negative breast cancer. N Engl J Med 2004;351:
2817-26.
6. Reiner A, Yekutieli D, Benjamini Y. Identifying differ- entially expressed genes using false discovery rate control- ling procedures. Bioinformatics 2003;19:368-75.
7. Wasenius VM, Hemmer S, Kettunen E, Knuutila S, Franssila K, Joensuu H. Hepatocyte growth factor re- ceptor, matrix metalloproteinase-11, tissue inhibitor of metalloproteinase-1, and fibronectin are up-regulated in papillary thyroid carcinoma: a cDNA and tissue micro- array study. Clin Cancer Res 2003;9:68-75.
8. Huang Y, Prasad M, Lemon WJ, Hampel H, Wright FA, Kornacker K, et al. Gene expression in papillary thyroid carcinoma reveals highly consistent profiles. Proc Natl Acad Sci U S A 2001;98:15044-9.
9. Aldred MA, Huang Y, Liyanarachchi S, Pellegata NS, Gimm O, Jhiang S, et al. Papillary and follicular thyroid carcinomas show distinctly different microarray ex- pression profiles and can be distinguished by a minimum of five genes. J Clin Oncol 2004;22:3531-9.
10. Carpi A, Mechanick JI, Saussez S, Nicolini A. Thyroid tu- mor marker genomics and proteomics: diagnostic and clin- ical implications. J Cell Physiol 2010;224:612-9.
11. Rhodes DR, Yu J, Shanker K, Deshpande N, Varambally R, Ghosh D, et al. Large-scale meta-analysis of cancer micro- array data identifies common transcriptional profiles of neoplastic transformation and progression. Proc Natl Acad Sci U S A 2004;101:9309-14.
12. Griffith OL, Melck A, Jones SJ, Wiseman SM. Meta-analysis and meta-review of thyroid cancer gene expression profil- ing studies identifies important diagnostic biomarkers. J
Clin Oncol 2006;24:5043-51.
13. Kim HS, Kim DH, Kim JY, Jeoung NH, Lee IK, Bong JG, et al. Microarray analysis of papillary thyroid cancers in Korean. Korean J Intern Med 2010;25:399-407.
14. Giordano S, Di Renzo MF, Narsimhan RP, Cooper CS, Rosa C, Comoglio PM. Biosynthesis of the protein encoded by the c-met proto-oncogene. Oncogene 1989;4:1383-8.
15. Mineo R, Costantino A, Frasca F, Sciacca L, Russo S, Vigneri R, et al. Activation of the hepatocyte growth factor (HGF)-Met system in papillary thyroid cancer: biological effects of HGF in thyroid cancer cells depend on Met ex- pression levels. Endocrinology 2004;145:4355-65.
16. Benjamini Y, Lipkind D, Horev G, Fonio E, Kafkafi N, Golani I. Ten ways to improve the quality of descriptions of whole-animal movement. Neurosci Biobehav Rev 2010;34:
1351-65.
17. Bergstrom JD, Westermark B, Heldin NE. Epidermal growth factor receptor signaling activates met in human anaplastic thyroid carcinoma cells. Exp Cell Res 2000;259:
293-9.
18. Benjamini Y, Yekutieli D. Quantitative trait Loci analysis using the false discovery rate. Genetics 2005;171:783-90.
19. Thomassen M, Tan Q, Kruse TA. Gene expression meta-analysis identifies chromosomal regions and candi- date genes involved in breast cancer metastasis. Breast Cancer Res Treat 2009;113:239-49.
20. Carvallo L, Munoz R, Bustos F, Escobedo N, Carrasco H, Olivares G, et al. Non-canonical Wnt signaling induces ubiquitination and degradation of Syndecan4. J Biol Chem 2010;285:29546-55.
21. Bashyam MD, Bair R, Kim YH, Wang P, Hernandez- Boussard T, Karikari CA, et al. Array-based comparative genomic hybridization identifies localized DNA amplifica- tions and homozygous deletions in pancreatic cancer.
Neoplasia 2005;7:556-62.
22. Gorres KL, Raines RT. Prolyl 4-hydroxylase. Crit Rev Biochem Mol Biol 2010;45:106-24.
23. Teodoro JG, Parker AE, Zhu X, Green MR. p53-mediated inhibition of angiogenesis through up-regulation of a col- lagen prolyl hydroxylase. Science 2006;313:968-71.
24. Conacci-Sorrell M, Zhurinsky J, Ben-Ze'ev A. The cadher- in-catenin adhesion system in signaling and cancer. J Clin Invest 2002;109:987-91.
25. Turashvili G, McKinney SE, Goktepe O, Leung SC, Huntsman DG, Gelmon KA, et al. P-cadherin expression as a prognostic biomarker in a 3992 case tissue microarray series of breast cancer. Mod Pathol 2011;24:64-81.
26. Zhang CC, Yan Z, Zhang Q, Kuszpit K, Zasadny K, Qiu M, et al. PF-03732010: a fully human monoclonal antibody against P-cadherin with antitumor and antimetastatic activity. Clin Cancer Res 2010;16:5177-88.
27. Rodrigues NR, Theodosiou AM, Nesbit MA, Campbell L, Tandle AT, Saranath D, et al. Characterization of Ngef, a novel member of the Dbl family of genes expressed pre- dominantly in the caudate nucleus. Genomics 2000;65:
53-61.
28. Yukinawa N, Oba S, Kato K, Taniguchi K, Iwao-Koizumi K,
Tamaki Y, et al. A multi-class predictor based on a proba- bilistic model: application to gene expression profil- ing-based diagnosis of thyroid tumors. BMC Genomics 2006;7:190.
29. Krause K, Eszlinger M, Gimm O, Karger S, Engelhardt C, Dralle H, et al. TFF3-based candidate gene discrimination of benign and malignant thyroid tumors in a region with
borderline iodine deficiency. J Clin Endocrinol Metab 2008;93:1390-3.
30. Nikolova DN, Zembutsu H, Sechanov T, Vidinov K, Kee LS, Ivanova R, et al. Genome-wide gene expression profiles of thyroid carcinoma: identification of molecular targets for treatment of thyroid carcinoma. Oncol Rep 2008;20:
105-21.