INTRODUCTION
Decompensated cirrhosis (DC) has the clinical features of asci- tes, variceal hemorrhage (VH), and hepatic encephalopathy
caused by complications of portal hypertension (PHT) or jaun- dice-reflected liver insufficiency.1 The risk of mortality in DC is influenced by the degree of PHT, such that worsening PHT and circulatory failure may induce further development of recur- rent VH, refractory ascites, sepsis, or hepatorenal syndrome, and these results can lead to death.2
Both the Child-Turcotte-Pugh (CTP) and the model for end- stage liver disease (MELD) scores have been widely used for evaluating the prognosis of patients with cirrhosis in the real- life clinical practice. The MELD score may more accurately pre- dict survival for cirrhotic patients than the CTP score and has an advantage as a continuous or progressive score of disease severity, which increases with worsening of its parameters.3,4 However, it cannot fully reflect the prognostic impacts of portal hypertensive complications such as ascites, hepatic encepha-
Hepatic Venous Pressure Gradient Predicts Long-Term Mortality in Patients with Decompensated Cirrhosis
Tae Yeob Kim1*, Jae Gon Lee1*, Joo Hyun Sohn1, Ji Yeoun Kim1, Sun Min Kim1, Jinoo Kim2, and Woo Kyoung Jeong3
1Department of Internal Medicine, Hanyang University Guri Hospital, Hanyang University College of Medicine, Guri;
2Department of Radiology, Ajou University Hospital, Ajou University College of Medicine, Suwon;
3Department of Radiology and Center for Imaging Science, Samsung Medical Center, Sungkyunkwan University School of Medicine, Seoul, Korea.
Purpose: The present study aimed to investigate the role of hepatic venous pressure gradient (HVPG) for prediction of long-term mortality in patients with decompensated cirrhosis.
Materials and Methods: Clinical data from 97 non-critically-ill cirrhotic patients with HVPG measurements were retrospectively and consecutively collected between 2009 and 2012. Patients were classified according to clinical stages and presence of ascites.
The prognostic accuracy of HVPG for death, survival curves, and hazard ratios were analyzed.
Results: During a median follow-up of 24 (interquartile range, 13–36) months, 22 patients (22.7%) died. The area under the re- ceiver operating characteristics curves of HVPG for predicting 1-year, 2-year, and overall mortality were 0.801, 0.737, and 0.687, respectively (all p<0.01). The best cut-off value of HVPG for predicting long-term overall mortality in all patients was 17 mm Hg.
The mortality rates at 1 and 2 years were 8.9% and 19.2%, respectively: 1.9% and 11.9% with HVPG ≤17 mm Hg and 16.2% and 29.4% with HVPG >17 mm Hg, respectively (p=0.015). In the ascites group, the mortality rates at 1 and 2 years were 3.9% and 17.6% with HVPG ≤17 mm Hg and 17.5% and 35.2% with HVPG >17 mm Hg, respectively (p=0.044). Regarding the risk factors for mortality, both HVPG and model for end-stage liver disease were positively related with long-term mortality in all patients. Par- ticularly, for the patients with ascites, both prothrombin time and HVPG were independent risk factors for predicting poor out- comes.
Conclusion: HVPG is useful for predicting the long-term mortality in patients with decompensated cirrhosis, especially in the presence of ascites.
Key Words: Ascites, cirrhosis, hepatic venous pressure gradient, prognosis Yonsei Med J 2016 Jan;57(1):138-145
http://dx.doi.org/10.3349/ymj.2016.57.1.138 pISSN: 0513-5796 · eISSN: 1976-2437
Received: September 23, 2014 Revised: February 3, 2015 Accepted: March 4, 2015
Corresponding author: Dr. Joo Hyun Sohn, Department of Internal Medicine, Hanyang University Guri Hospital, 153 Gyeongchun-ro, Guri 11923, Korea.
Tel: 82-31-560-2225, Fax: 82-31-555-2998, E-mail: sonjh@hanyang.ac.kr
*Tae Yeob Kim and Jae Gon Lee contributed equally to this work.
•The authors have no financial conflicts of interest.
© Copyright: Yonsei University College of Medicine 2016
This is an Open Access article distributed under the terms of the Creative Com- mons Attribution Non-Commercial License (http://creativecommons.org/ licenses/
by-nc/3.0) which permits unrestricted non-commercial use, distribution, and repro- duction in any medium, provided the original work is properly cited.
lopathy or VH in those patients and can be also affected by body fluid status, muscle mass, sex, and age.5-8
The increase of portal pressure is closely associated with liver- related complications such as VH, ascites, and death. Therefore, the measurement of hepatic venous pressure gradient (HVPG) is a useful tool to evaluate the severity of cirrhosis and to predict prognosis.9 HVPG measurement is an invasive yet simple and safe procedure. It is also known that HVPG is a strong predictor for survival in patients with cirrhosis.10-12 Indeed, HVPG >20 mm Hg in cases of acute VH has a high probability of mortality at 1 year.13 Moreover, HVPG was shown to have an independent role in survival in addition to the MELD score, with each 1-mm Hg increase contributing to a 3% increase in mortality.12
However, the role of HVPG in predicting long-term mortality in patients with DC is controversial. In fact, recent studies com- paring HVPG and MELD have shown different results.6,14-16 However, these results were not classified based on ascites and VH according to D’Amico, et al.17 Recently, a study by Zipprich, et al.14 on survival analysis using HVPG suggested two new stages for decompensated patients, redefining stage 3 as VH without ascites and stage 4 as ascites irrespective to VH.
The present study aimed to investigate the role of HVPG in the prediction of long-term mortality in patients with DC, par- ticularly those with ascites.
MATERIALS AND METHODS
Patients
Between November 2009 and December 2012, a total of 169 non-critically-ill patients with DC were retrospectively and consecutively collected at Hanyang University Guri Hospital.
All patients had previous histological confirmation of cirrhosis18 or a diagnosis of cirrhosis on the basis of standard clinical, ul- trasonographic, and biochemical parameters.1 Non-critically-ill patients were those who had stable hemodynamic parameters, no uncontrolled infection, no acute bleeding for less than 1 month and no active alcohol abuse.19 Exclusion criteria were use of vasoactive drugs, the presence of hepatocellular carcino- ma (n=20),20 bilirubin levels above 10 mg/dL (n=7), compen- sated cirrhosis (n=33), and follow-up loss within 28 days (n=2).
Two patients with failed HVPG measurements due to nonco- operation and 8 patients with incorrect HVPG measurements were excluded from this study. Ultimately, 97 patients were an- alyzed (Fig. 1). Follow-up was continued until November 30, 2013. The Hanyang University Guri Hospital Institutional Re- view Board approved the study (No. 2013-03).
Clinical stages and MELD
Among patients with DC, clinical stage 3 or 4 was diagnosed according to the presence of ascites or portal hypertensive gas- trointestinal bleeding.17 Clinical stage 3 was defined as ascites with or without history of VH, and stage 4 was defined as VH
with or without ascites. The ascites group (AG) included pa- tients with ascites, namely those with clinical stage 3 (ascites) and a portion of those with stage 4 (both VH and ascites). MELD scores were calculated for each patient on the day of HVPG measurement.
HVPG measurement
After the serum sampling, HVPG measurement was performed on the same day by a radiologist (J.K.) with experience in more than 50 HVPG measurements. Under fluoroscopic guidance, a 6-Fr balloon-tip catheter (Arrow International, Inc., Cleveland, OH, USA) was inserted through a 7-Fr sheath placed in the right internal jugular vein and advanced into the right hepatic vein.
Measurement of the free and wedged hepatic venous pressures during balloon deflation and inflation, respectively, was per- formed using an electronic barometer built into the patient monitoring equipment (Pulscan-combo, Scionic Co., Ltd., Seoul, Korea). The measurements were acquired at a location less than 5 cm from the junction of the right hepatic vein and inferior vena cava (IVC). All measurements were performed in triplicate, and the results were reported as the means of the three mea- surements. The HVPG was determined by subtraction of the free hepatic venous pressure from the wedged hepatic venous pres- sure. The pressure in the IVC at the level of hepatic venous drainage was also measured for comparison with the free he- patic venous pressure to evaluate whether the measurement was relevant.
Statistical analysis
Descriptive statistics were produced for demographic, clinical, and laboratory characteristics for this study sample of patients.
The evaluation of normality of the distribution of quantitative variables was performed using the Shapiro-Wilk test. Variables with a normal distribution are expressed as mean and standard deviation, and others are expressed as median and interquar- tile range (IQR). The qualitative variables are presented as number and percentage (%). Means of HVPG measurements Fig. 1. Flow chart of enrolled patients. HVPG, hepatic venous pressure gradient.
169 consecutive cirrhotic patients performed HVPG measurements
97 patients analyzed Exclusion
Hepatocellular carcinoma, n=20 Bilirubin levels above 10 mg/dL, n=7 Follow-up loss <28 days, n=2 Compensated cirrhosis, n=33 Failure of HVPG measurement, n=2 Incorrect HVPG measurement, n=8
were compared according to clinical or subclinical stage using an independent t-test or a one-way analysis of variance with a post-hoc test (Turkey’s) as appropriate. According to the dura- tion of the follow-up period, the prognostic accuracies of MELD score and HVPG were analyzed using the means of the area under the receiver operating characteristics curve (AUROC) for the prediction of 1-year, 2-year, and overall mortality, and sen- sitivity, specificity, and cutoff values were also calculated. Opti- mal cutoff values to predict overall mortality were chosen to maximize the sum of sensitivity and specificity. Based on these optimal cutoff values, the Kaplan-Meier method was used with the log-rank test to calculate survival. To assess the prognostic predictors of long-term mortality, sex, age, etiology of cirrhosis, history of variceal bleeding, presence of ascites, platelet count, albumin, bilirubin, prothrombin time (international normalized ratio, INR), creatinine, sodium, MELD score, and HVPG vari- ables were used in the Cox regression models, and a hazard ra- tio (HR) of each independent predictive factor was obtained.
Only significant variables were used for backward elimination in a multivariate model. p values <0.05 were considered to be statistically significant. Statistical analysis was performed using SPSS 18.0 (SPSS Inc., IBM Company, Chicago, IL, USA).
RESULTS
Baseline characteristics of patients
The baseline characteristics of enrolled patients are summarized in Table 1. Shortly, the mean age of patients was 52±9 years, and there was a predominance of males (73.2%). Among 97 patients, 41 (42.3%) had clinical stage 3 DC, and 56 (57.7%) had clinical stage 4, of whom 31 had no ascites and 25 had ascites. Based on CTP score, 37 patients had class A, 43 had class B, and 17 had class C. The median MELD score was 9 (IQR, 7–14), and the mean of HVPG measurements was 16.6±5.9 mm Hg (Table 1).
HVPG measurements according to clinical stage and ascites group vs. non-ascites group
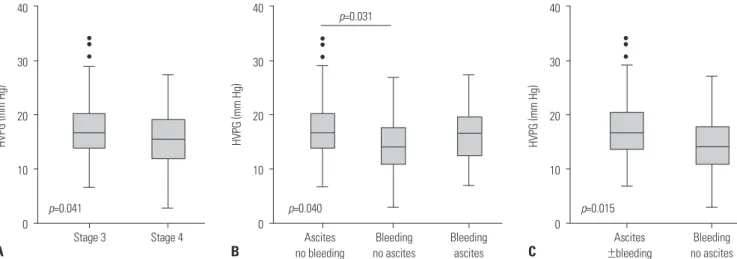
Mean values of HVPG in stage 3 disease were significantly high- er than those in stage 4 (18.0±6.3 mm Hg vs. 15.5±5.5 mm Hg;
p=0.041) (Fig. 2A). Stage 4 was divided according to the presence of ascites, and the mean values of HVPG in stage 3, stage 4 with- out ascites, and stage 4 with ascites were 18.0±6.3, 14.5±5.7, and 16.8±5.1 mm Hg, respectively (p=0.040). Particularly, the mean HVPG values of stage 3 patients were significantly higher than those of stage 4 patients without ascites (p=0.031) (Fig. 2B). Ac- cording to the presence of ascites in DC, the mean values of HVPG in AG were significantly higher than those in the non-as- cites group (NAG) (17.6±5.9 mm Hg vs. 14.5±5.7 mm Hg; p=0.015) (Fig. 2C).
HVPG and MELD in predicting 1-year, 2-year, and overall mortality
During a median follow-up period of 24 (IQR, 13–36; range, 2–48) months, 22 of 97 patients (22.7%) died. The causes of death were hepatorenal syndrome (n=8), VH (n=4), hepatic en- cephalopathy (n=8), ischemic enteropathy (n=1), and cerebral hemorrhage (n=1).
The AUROCs of HVPG for predicting 1-year, 2-year, and over- all mortality were 0.801, 0.737, and 0.687, respectively (all p<0.01) (Table 2); those of MELD scores for predicting 1-year, 2-year, and overall mortality were 0.827, 0.736, and 0.725, re- spectively (all p<0.01), and the differences between HVPG and MELD scores were not statistically significant (p=0.824, 0.993, and 0.635, respectively). The best cut-off value of HVPG for pre- dicting long-term overall mortality in all patients with DC was 17 mm Hg (Table 2A).
In the AG, the AUROCs of HVPG for predicting 1-year, 2-year, Table 1. Clinical Characteristics of the Enrolled Patients
Characteristics n=97
Sex, male (%) 71 (73.2)
Age, yrs (SD, range) 52 (9, 22–78)
Cause, n (%)
Hepatitis B virus 17 (17.5)
Hepatitis C virus 2 (2.1)
Alcohol 60 (61.9)
Mixed (virus+alcohol) 11 (11.3)
Others 7 (7.2)
Use of beta-blocker after HVPG measurement 65 (67.0)
Platelet count,103/μL (IQR, range) 91 (58–135, 20–507) Albumin, mg/dL (SD, range) 3.0 (0.5, 1.8–4.2) Bilirubin, mg/dL (IQR, range) 1.4 (0.6–3.0, 0.3–7.5)
AST, U/L (IQR, range) 52 (34–72, 4–928)
ALT, U/L (IQR, range) 23 (14–40, 4–527)
Prothrombin time, INR (IQR, range) 1.13 (1.0–1.3, 0.87–2.67) Creatinine, mg/dL (IQR, range) 0.7 (0.6–0.8, 0.3–1.3) Sodium, mEq/L (IQR, range) 139 (137–141, 118–146) Stage of liver cirrhosis*, n (%)
Stage 3 41 (42.3)
Stage 4 56 (57.7)
GI bleeding without ascites 31 (55.4)
GI bleeding with ascites 25 (44.6)
Child Turcott Pugh (CTP) score (IQR, range) 7 (6–9, 5–12)
CTP A, n (%) 37 (38.1)
CTP B, n (%) 43 (44.4)
CTP C, n (%) 17 (17.5)
MELD score (IQR, range) 9 (7–14, 6–21)
HVPG, mm Hg (SD, range) 16.6 (5.9, 3–34)
Follow-up duration, month (IQR, range) 24 (13–36, 2–48) SD, standard deviation; IQR, interquartile range; GI, gastrointestinal; HVPG, hepatic venous pressure gradient; MELD, model for end-stage liver disease;
Others, cryptogenic, autoimmune, Wilson’s disease.
*D’Amico G. Classification. J Hepatol 2006;44:217-31.17
and overall mortality were 0.749, 0.685, and 0.680, respectively (all p<0.01) (Table 2B). However, in the NAG, the AUROCs of HVPG for long-term overall mortality were not significant.
Survival analysis in decompensated cirrhosis
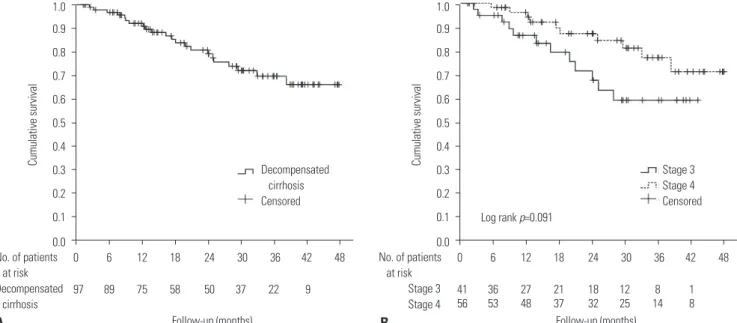
The mortality rates of patients with DC at 1 and 2 years were 8.9% and 19.2%, respectively (Fig. 3A). According to clinical stage, the mortality rates at 1 and 2 years were 15.7% and 28.7%
for stage 3 and 4.9% and 12.9% for stage 4, respectively (p=0.091)
(Fig. 3B). In addition, the difference of mortality rates between AG and NAG was not significant (p=0.201; data not shown).
However, the mortality rates at 1 and 2 years were signifi- cantly different according to the level of HVPG: 1.9% and 11.9%
with HVPG ≤17 mm Hg and 16.2% and 29.4% with HVPG >17 mm Hg, respectively (p=0.015) (Fig. 4A). In addition, the differ- ences in 1- and 2-year mortality rates were significant in the AG: 3.9% and 17.6% with HVPG ≤17 mm Hg and 17.5% and 35.2% with HVPG >17 mm Hg, respectively (p=0.044) (Fig. 4B).
Fig. 2. Comparison of HVPG values between (A) clinical stages 3 and 4, (B) the presence of ascites without bleeding (clinical stage 3) and variceal bleed- ing with or without ascites (stage 4), and (C) the presence or absence of ascites in patients with decompensated cirrhosis. The length of the box repre- sents the interquartile range, within which 50% of the values were located. The line in the middle of each box represents the mean. The error bars show the minimum and maximum values (range). HVPG, hepatic venous pressure gradient.
A B C
40
30
20
10
0 40
30
20
10
0
40
30
20
10
Ascites 0 no bleeding
Ascites
±bleeding
Stage 3 Stage 4 Bleeding
no ascites
Bleeding no ascites Bleeding
ascites p=0.031
p=0.040
p=0.041 p=0.015
HVPG
(mm Hg
)
HVPG
(mm Hg
) HVPG
(mm Hg
)
Table 2. AUROC and Cut-Off Values for Survival Prediction in (A) All Patients with Decompensated Cirrhosis and (B) Patients with Ascites
Parameters AUROC 95% CI p value COV Sn (95% CI) Sp (95% CI) +LR -LR
(A)
1-yr mortality
MELD 0.827 0.737–0.896 <0.001 14 85.7 (42.2–97.6) 81.1 (71.5–88.6) 4.54 0.18
HVPG 0.801 0.707–0.875 0.003 19 85.7 (42.2–97.6) 78.9 (69.0–86.8) 4.06 0.18
2-yr mortality
MELD 0.736 0.636–0.820 0.002 13 73.3 (44.9–92.0) 78.0 (67.5–86.4) 3.34 0.34
HVPG 0.737 0.637–0.821 0.002 18 66.7 (38.4–88.1) 73.2 (62.2–82.4) 2.48 0.46
Overall mortality
MELD 0.725 0.625–0.881 <0.001 14 54.5 (32.2–75.6) 85.3 (75.3–92.4) 3.72 0.53
HVPG 0.687 0.585–0.777 0.006 17 63.6 (40.7–82.8) 69.3 (57.6–79.5) 2.08 0.52
(B)
1-yr mortality
MELD 0.771 0.651–0.865 0.020 14 83.3 (36.1–97.2) 76.7 (64.0–86.6) 3.57 0.22
HVPG 0.749 0.627–0.847 0.037 19 83.3 (36.1–97.2) 75.0 (62.1–85.3) 3.33 0.22
2-yr mortality
MELD 0.672 0.545–0.782 0.047 14 64.3 (35.2–87.1) 80.8 (67.5–90.4) 3.34 0.44
HVPG 0.685 0.559–0.794 0.031 18 64.3 (35.2–87.1) 67.3 (52.9–79.7) 1.97 0.53
Overall mortality
MELD 0.650 0.523–0.764 0.058 14 55.6 (30.8–78.4) 81.2 (67.4–91.0) 2.96 0.55
HVPG 0.680 0.554–0.789 0.021 17 66.7 (41.0–86.6) 64.6 (49.5–77.8) 1.88 0.52
AUROC, area under the receiver operating characteristics curve; CI, confidence interval; COV, cutoff value; HVPG, hepatic venous pressure gradient; MELD, mod- el for end-stage liver disease; Sn, sensitivity; Sp, specificity; +LR, positive likelihood ratio; -LR, negative likelihood ratio.
However, the differences in mortality rates between HVPG lev- els higher and lower than 17 mm Hg were not significant in patients with NAG (p=0.209).
Predictors of long-term mortality in decompensated cirrhosis
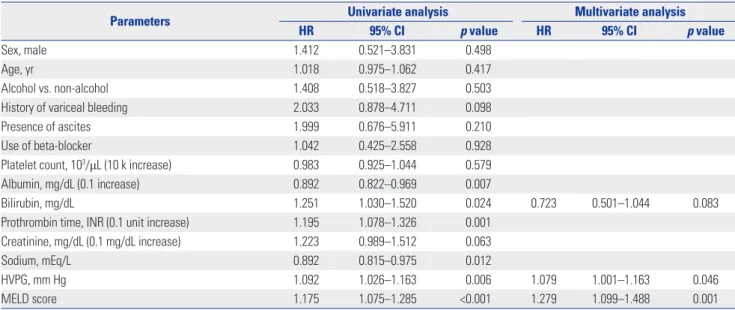
In the univariate analysis for patients with DC who died, serum albumin (p=0.007), bilirubin (p=0.024), INR (p=0.001), sodium (p=0.012), HVPG (p=0.006), and MELD score (p<0.001) were significantly related with long-term mortality. In a multivariate analysis using the Cox regression model, only HVPG [HR, 1.079;
95% confidence interval (CI), 1.001–1.163; p=0.046] and MELD score (HR, 1.279; 95% CI, 1.099–1.488; p=0.001) were signifi-
cantly related (Table 3). In the subgroup analysis, the factors as- sociated with long-term mortality in the AG were serum albu- min (p=0.040), INR (p=0.019), HVPG (p=0.025), and MELD score (p=0.017). In the multivariate analysis, only INR (0.1 unit per increase; HR, 1.146; 95% CI, 1.011–1.298; p=0.033) and HVPG (HR, 1.078; 95% CI, 1.003–1.159; p=0.042) were indepen- dent risk factors for predicting poor long-term survival (Table 4).
DISCUSSION
Clinically, DC is defined as a condition in which complications of PHT or liver insufficiency are presented.2 In this study, HVPG
Fig. 3. (A) Overall survival in all patients with decompensated cirrhosis and (B) comparison of overall survival between clinical stages 3 and 4.
A B
1.0 0.9 0.8 0.7 0.6 0.5 0.4 0.3 0.2 0.1 0.0
1.0 0.9 0.8 0.7 0.6 0.5 0.4 0.3 0.2 0.1 0.0
Cumulative survival Cumulative survival
Follow-up (months) Follow-up (months)
0 6 12 18 24 30 36 42 48 0 6 12 18 24 30 36 42 48
97 89 75 58 50 37 22 9 41 36 27 21 18 12 8 1
56 53 48 37 32 25 14 8 No. of patients
at risk Decompensated cirrhosis
No. of patients at risk
Stage 3 Stage 4 Decompensated
cirrhosis Censored
Stage 3 Stage 4 Censored Log rank p=0.091
Fig. 4. Kaplan-Meier survival curves of (A) all patients with decompensated cirrhosis and (B) patients with ascites, stratified by HVPG at a cut-off of 17 mm Hg. HVPG, hepatic venous pressure gradient.
A B
1.0 0.9 0.8 0.7 0.6 0.5 0.4 0.3 0.2 0.1 0.0
1.0 0.9 0.8 0.7 0.6 0.5 0.4 0.3 0.2 0.1 0.0
Cumulative survival Cumulative survival
Follow-up (months) Follow-up (months)
0 6 12 18 24 30 36 42 48 0 6 12 18 24 30 36 42 48
57 53 46 35 31 25 15 6 35 32 28 23 20 17 11 4
40 37 29 23 19 12 7 3 31 29 22 16 14 10 6 3
No. of patients at risk
≤17 mm Hg
>17 mm Hg
No. of patients at risk
≤17 mm Hg
>17 mm Hg HVPG≤17 mm Hg
HVPG>17 mm Hg Censored
HVPG≤17 mm Hg HVPG>17 mm Hg Censored
Log rank p=0.015 Log rank p=0.044
values were closely associated with long-term mortality (AU- ROC=0.687) and were valuable in predicting 1- or 2-year mor- tality in patients with clinical DC.
HVPG in chronic liver disease is well known as having a role in the evaluation of fibrosis in chronic hepatitis, the stratifica- tion of patients with cirrhosis, and the response to therapy for PHT.2 According to a meta-analysis, a good hemodynamic re- sponse, defined by a decrease in HVPG of at least 20% from baseline or to ≤12 mm Hg, reduced episodes of variceal bleed- ing and complications such as ascites and spontaneous bacte- rial peritonitis and was also associated with low mortality.21,22 However, the role of HVPG in DC is controversial, particularly in predicting long-term mortality. HVPG values in DC are al- most all above 12 mm Hg in view of PHT, and the subclassifica- tion of DC according to the level of PHT or HVPG is not well de- fined. Our study showed that both long-term mortality and the
mean values of HVPG in stage 3 DC were higher than those in stage 4. In the same way, the AG had higher levels of HVPG than the NAG. Similarly, the long-term mortality rates in pa- tients with DC and ascites were significantly related to the levels of HVPG though not related to clinical stages 3 and 4. However, the clinical stage could not correctly predict higher long-term mortality, particularly in patients with stage 4. These results of the present study suggested that measurement of HVPG is more useful for predicting long-term mortality of cirrhotic pa- tients, even in the state of DC. However, these findings should not be applied to critically-ill patients with DC, as HVPG was only measured in non-critically-ill patients in this study.
In clinical practice, the MELD score is widely used to evalu- ate the prognosis of patients with cirrhosis, while the use of HVPG is limited. Furthermore, comparison studies between HVPG and MELD score in patients with DC showed different
Table 3. Cox Regression Analysis of Variable Factors and HVPG for Mortality in Patients with Decompensated Cirrhosis
Parameters Univariate analysis Multivariate analysis
HR 95% CI p value HR 95% CI p value
Sex, male 1.412 0.521–3.831 0.498
Age, yr 1.018 0.975–1.062 0.417
Alcohol vs. non-alcohol 1.408 0.518–3.827 0.503
History of variceal bleeding 2.033 0.878–4.711 0.098
Presence of ascites 1.999 0.676–5.911 0.210
Use of beta-blocker 1.042 0.425–2.558 0.928
Platelet count, 103/μL (10 k increase) 0.983 0.925–1.044 0.579
Albumin, mg/dL (0.1 increase) 0.892 0.822–0.969 0.007
Bilirubin, mg/dL 1.251 1.030–1.520 0.024 0.723 0.501–1.044 0.083
Prothrombin time, INR (0.1 unit increase) 1.195 1.078–1.326 0.001
Creatinine, mg/dL (0.1 mg/dL increase) 1.223 0.989–1.512 0.063
Sodium, mEq/L 0.892 0.815–0.975 0.012
HVPG, mm Hg 1.092 1.026–1.163 0.006 1.079 1.001–1.163 0.046
MELD score 1.175 1.075–1.285 <0.001 1.279 1.099–1.488 0.001
HR, hazard ratio; CI, confidence interval; HVPG, hepatic venous pressure gradient; INR, international normalized ratio; MELD, model for end-stage liver disease.
Table 4. Cox Regression Analysis of Variable Factors and HVPG for Mortality in Patients with Decompensated Cirrhosis and Ascites
Parameters Univariate analysis Multivariate analysis
HR 95% CI p value HR 95% CI p value
Sex, male 1.235 0.440–3.467 0.211
Age, yr 1.021 0.973–1.071 0.403
Alcohol vs. non-alcohol 1.547 0.509–4.704 0.441
History of variceal bleeding 0.602 0.226–1.607 0.311
Use of beta-blocker 1.369 0.513–3.649 0.530
Platelet count, 103/μL (10 k increase) 1.006 0.943–1.073 0.853
Albumin, mg/dL (0.1 increase) 0.909 0.829–0.996 0.040
Bilirubin, mg/dL 1.182 0.953–1.468 0.129
Prothrombin time, INR (0.1 unit increase) 1.154 1.024–1.301 0.019 1.146 1.011–1.298 0.033
Creatinine, mg/dL (0.1 mg/dL increase) 1.082 0.846–1.383 0.532
Sodium, mEq/L 0.912 0.826–1.007 0.067
HVPG, mm Hg 1.081 1.010–1.158 0.025 1.078 1.003–1.159 0.042
MELD score 1.132 1.023–1.254 0.017
HR, hazard ratio; CI, confidence interval; HVPG, hepatic venous pressure gradient; INR, international normalized ratio; MELD, model for end-stage liver disease.
results in the ability to predict long-term mortality.6,14-16 Suk, et al.15 suggested that HVPG in predicting mortality may be more useful than MELD, while other authors showed no additional effect of HVPG on MELD score.14,16 Our study showed that the discriminative ability of HVPG to predict 1-year, 2-year, and overall mortality was useful, although it was not significantly different from that of the MELD score.
The 1-year mortality rate in DC varies 10–30% after the devel- opment of ascites, variceal bleeding, or ascites and hemor- rhage.2 This study showed 1- and 2-year morality rates of 8.9%
and 19.2%, respectively. These somewhat lower rates of long- term mortality might have been affected by selection bias, as we excluded critically-ill patients from enrollment. Of note, there was no significant difference in long-term mortality rates between clinical stage 3 (ascites) and 4 (VH±ascites; p=0.091).21 Although there may have been selection bias, the presence of ascites tended to be associated with a poorer outcome. This point was consistent with the results of Zipprich, et al.;14 howev- er, our study showed that HVPG as well as MELD score contrib- uted to the independent risk of death in all non-critically-ill pa- tients with DC, though in the subgroup analysis of the AG, both INR and HVPG (and not MELD score) were independent risk factors for predicting poor long-term survival. A possible expla- nation of this result is that it was likely due to selection bias such that the study subjects in the AG had an almost normal range of serum bilirubin (1.4; IQR, 0.6–3.0) and creatinine (0.7; IQR, 0.6–
0.8), indicating that the MELD score was mainly determined by INR in this group. It is well known that factors related to long- term mortality are positively associated with the degree of PHT and liver dysfunction. These findings of our study also con- firmed that HVPG values had valuable information in predict- ing long-term mortality in patients with clinical DC or ascites.
Higher HVPG values were an independent risk factor of sur- vival, such that each 1-mm Hg increase in HVPG resulted in a 3% increase in death risk.12 Several studies have found that HVPG values above 16 mm Hg or 18 mm Hg are an important predictor of poor outcome in DC.2,6,15 In these studies, deter- mining the prognostic value of HVPG was performed at the time of the first manifestation of decompensation. Similarly, we found that an HVPG of 17 mm Hg was the best discriminative cutoff value for the prediction of long-term mortality risk in pa- tients with DC.
There were several limitations in this study. First, the study was performed in a single center with a relatively small number of patients who were not critically ill at the time of enrollment.
Additionally, the follow-up period was not long, and the causes of cirrhosis were heterogeneous with most cases due to alcohol, restricting its application to other less common causes. Another limitation was that this study only considered the role of HVPG in all-cause mortality, not the prediction of other major compli- cations. To overcome these limitations, long-term prospective multi-centered studies are needed.
In conclusion, this study showed that HVPG is useful in pre-
dicting long-term mortality in patients with DC, particularly in the presence of ascites. Although HVPG was not superior to MELD score, it was proven to be an independent predictor of mortality. In addition, it was noted that there was no significant difference in mortality between clinical stages 3 and 4. To con- firm these findings, a large, long-term, prospective multi-cen- tered clinical study is needed.
ACKNOWLEDGEMENTS
This study was funded by Yuhan Corp. in part. Yuhan Corp. had no role in study design, data collection, analysis, or decision to submit the manuscript.
REFERENCES
1. Suk KT, Baik SK, Yoon JH, Cheong JY, Paik YH, Lee CH, et al. Revi- sion and update on clinical practice guideline for liver cirrhosis.
Korean J Hepatol 2012;18:1-21.
2. Albilllos A, Garcia-Tsao G. Classification of cirrhosis: the clinical use of HVPG measurements. Dis Markers 2011;31:121-8.
3. Salerno F, Merli M, Cazzaniga M, Valeriano V, Rossi P, Lovaria A, et al. MELD score is better than Child-Pugh score in predicting 3-month survival of patients undergoing transjugular intrahepat- ic portosystemic shunt. J Hepatol 2002;36:494-500.
4. Huo TI, Wu JC, Lin HC, Lee FY, Hou MC, Lee PC, et al. Evaluation of the increase in model for end-stage liver disease (DeltaMELD) score over time as a prognostic predictor in patients with advanced cirrhosis: risk factor analysis and comparison with initial MELD and Child-Turcotte-Pugh score. J Hepatol 2005;42:826-32.
5. Bambha KM, Biggins SW. Inequities of the Model for End-Stage Liver Disease: an examination of current components and future additions. Curr Opin Organ Transplant 2008;13:227-33.
6. Lee SH, Park SH, Kim GW, Lee WJ, Hong WK, Ryu MS, et al. [Com- parison of the Model for End-stage Liver Disease and hepatic ve- nous pressure gradient for predicting survival in patients with de- compensated liver cirrhosis]. Korean J Hepatol 2009;15:350-6.
7. Cholongitas E, Papatheodoridis GV, Vangeli M, Terreni N, Patch D, Burroughs AK. Systematic review: The model for end-stage liver disease--should it replace Child-Pugh’s classification for assessing prognosis in cirrhosis? Aliment Pharmacol Ther 2005;22:1079-89.
8. Kim HJ, Lee HW. Important predictor of mortality in patients with end-stage liver disease. Clin Mol Hepatol 2013;19:105-15.
9. Suk KT. Hepatic venous pressure gradient: clinical use in chronic liver disease. Clin Mol Hepatol 2014;20:6-14.
10. Gluud C, Henriksen JH, Nielsen G. Prognostic indicators in alco- holic cirrhotic men. Hepatology 1988;8:222-7.
11. Merkel C, Bolognesi M, Bellon S, Zuin R, Noventa F, Finucci G, et al.
Prognostic usefulness of hepatic vein catheterization in patients with cirrhosis and esophageal varices. Gastroenterology 1992;102:
973-9.
12. Ripoll C, Bañares R, Rincón D, Catalina MV, Lo Iacono O, Salcedo M, et al. Influence of hepatic venous pressure gradient on the pre- diction of survival of patients with cirrhosis in the MELD Era. Hep- atology 2005;42:793-801.
13. Moitinho E, Escorsell A, Bandi JC, Salmerón JM, García-Pagán JC, Rodés J, et al. Prognostic value of early measurements of portal pres- sure in acute variceal bleeding. Gastroenterology 1999;117:626-31.
14. Zipprich A, Garcia-Tsao G, Rogowski S, Fleig WE, Seufferlein T, Dollinger MM. Prognostic indicators of survival in patients with
compensated and decompensated cirrhosis. Liver Int 2012;32:
1407-14.
15. Suk KT, Kim CH, Park SH, Sung HT, Choi JY, Han KH, et al. Com- parison of hepatic venous pressure gradient and two models of end-stage liver disease for predicting the survival in patients with decompensated liver cirrhosis. J Clin Gastroenterol 2012;46:880-6.
16. Park SH, Park HY, Kang JW, Park JS, Shin KJ, Kim CH, et al. Identi- fication of patients with decompensated cirrhosis at high risk for death: improving the prediction by hepatic venous pressure gra- dient? Hepatogastroenterology 2012;59:2548-51.
17. D’Amico G, Garcia-Tsao G, Pagliaro L. Natural history and prognos- tic indicators of survival in cirrhosis: a systematic review of 118 studies. J Hepatol 2006;44:217-31.
18. Intraobserver and interobserver variations in liver biopsy inter- pretation in patients with chronic hepatitis C. The French META-
VIR Cooperative Study Group. Hepatology 1994;20(1 Pt 1):15-20.
19. Sanyal AJ, Brunt EM, Kleiner DE, Kowdley KV, Chalasani N, Lavine JE, et al. Endpoints and clinical trial design for nonalcoholic ste- atohepatitis. Hepatology 2011;54:344-53.
20. Korean Liver Cancer Study Group and National Cancer Center, Ko- rea. [Practice guidelines for management of hepatocellular carci- noma 2009]. Korean J Hepatol 2009;15:391-423.
21. D’Amico G, Garcia-Pagan JC, Luca A, Bosch J. Hepatic vein pres- sure gradient reduction and prevention of variceal bleeding in cir- rhosis: a systematic review. Gastroenterology 2006;131:1611-24.
22. Albillos A, Bañares R, González M, Ripoll C, Gonzalez R, Catalina MV, et al. Value of the hepatic venous pressure gradient to monitor drug therapy for portal hypertension: a meta-analysis. Am J Gas- troenterol 2007;102:1116-26.