Corresponding author: Seung-Ae Yang, College of Nursing, Sungshin Women's University, 249-1, Dongseon-dong 3-ga, Seongbuk- gu, Seoul 136-742, Korea
Tel: +82-2-920-7728, E-mail: [email protected] Received August 13, 2010, Revised September 3, 2010
Accepted September 17, 2010
Association of Methylenetetrahydrofolate Reductase (MTHFR) Gene Polymorphisms with Obesity in Korean Population
*Kohwang Medical Research Institute, Kyung Hee University,
†
College of Nursing, Sungshin Women's University, Seoul, Korea
Su Kang Kim*, Seung-Ae Yang
†The methylenetetrahydrofolate reductase (MTHFR) is a key enzyme in metabolism of folate. To examine MTHFR gene and its relation to obesity in Korean population, 209 overweight/obese and 160 healthy control subjects were enrolled in this study.
Three single nucleotide polymorphisms (SNPs, rs1537514, rs11559040, and rs1801133) in exon region and seven SNPs (rs3818762, rs12121543, rs1994798, rs6541003, rs4846052, rs17037396, and rs17367504) in intron region of MTHFR gene were selected. Genomic DNA was extracted from peripheral blood, and the genotyping was performed using Affymetrix targeted genotyping chip array. For analysis of genetic data, SNPStats, HelixTree, SNPAnalyzer, and Haploview version 4.2 softwares were used. Multiple logistic regression models (codominant 1, codominant 2, dominant, and recessive models) were performed for odds ratio (OR), 95% confidence interval (CI), and p value. To obtain the defined results, p values were recalculated by Bonferroni correction. After Bonferroni correction, genotype distributions of two SNPs showed significant associations with overweight/obese (rs1537514, OR=2.73, 95% CI=1.36∼5.47, p=0.030 in dominant model) (rs17367504, OR=2.63, 95% CI=1.39∼4.98, p=0.030 in codominant 1 model; OR=2.84, 95% CI=1.51-5.34, p=0.010 in dominant model). Alleles of rs1537514 and rs17367504 were associated with overweight/obese (rs1537514, OR=2.76, 95% CI=1.43∼5.36, p=0.030; rs17367504, OR=2.84, 95% CI=1.57∼5.15, p=0.010). Haplotype (CGACGCT) was also correlated with overweight/obese (chi square=9.312, p=0.002). These results indicate that MTHFR gene may be associated with obesity in Korean population. (Korean J Str Res
2010;18:237∼243)Key Words: Methylenetetrahydrofolate reductase, Obesity, Overweight, Single nucleotide polymorphism, Association study
INTRODUCTION
Obesity is a medical status in which excess body fat has accumulated. It may have an adverse effect on health, leading to
reduction of expected lifespan and/or increasing health problems (Haslam et al., 2005). Obesity is well recognized as one of the most important underlying risk factors for a wide variety of diseases. It is associated with increased risk of heart disease (Burke et al., 2008), diabetes (Gomes et al., 2010), and breast cancer (Lorincz et al., 2006). Obesity is commonly caused by a combination of excessive dietary calories, lack of physical activity, and genetic factors (Barness et al., 2007).
Methylenetetrahydrofolate reductase (MTHFR) is a key enzyme
in the metabolism of folate (Guenther et al., 1999). MTHFR
Fig. 1. Gene map and linkage disequilibrium (LD) in methylenetetrahy- drofolate reductase (MTHFR) gene. (A) Gene map and single nucleotide polymorphisms (SNPs) in the MTHFR gene. Exons are marked with boxes. The coding regions are black boxes and untranslation regions are white boxes. Arrow indicates the location of each SNP. (B) LD coefficient (│D'│) and LD blocks among MTHFR SNPs. Block 1 consists of rs11559040, rs3818762, rs12121543, rs1994798, rs6541003, rs1801133, and rs4846052.
catalyzes the biologically irreversible reduction of 5,10- methy- lenetetrahydrofolate (5,10-methylene-THF) to 5-methyltetrahydro- folate (5-methyl-THF), as the methyl donor for methionine syn- thesis from homocysteine (Guenther et al., 1999). MTHFR mutant from a bacterial expression system suggests that the thermolabile form of MTHFR may lose activity by facile loss of its flavin adenine dinucleotide (FAD) coenzyme (Matthews et al., 1998).
The actual metabolic consequences of MTHFR gene polymor- phism (rs180133, Ala222Val) can be inferred by observing analy- sis of cellular metabolites (Bagley et al., 1998). They suggested that the production of 5-methyl-THF was reduced by MTHFR gene polymorphism. Several studies between MTHFR polymor- phisms and obesity were previously reported (Lambrinoudaki et al., 2008; Settin et al., 2009; Takeshima, 2009).
In this study, we examined the association between single nu- cleotide polymorphisms (SNPs) of MTHFR gene and obesity in Korean population.
MATERIALS AND METHODS
1. Subjects
Body mass index (BMI) of each subject is calculated by di- viding the subject's mass by the square of his or her height (BMI=kg/m
2). According to the classification of Korean Society for the Study of Obesity, subjects in this study were divided (underweight, BMI<18; normal, BMI 18 to <23; moderately obese, BMI 23 to<25; obesity I, BMI 25 to <30; obesity II, BMI≥30). We finally divided two groups to overweight/obese (BMI≥23, n=209) and normal control (BMI 18 to <23, n=
160). Subjects with diabetes, stoke, and/or cardiac diseases were excluded. This study was performed according to the Declaration of Helsinki guidelines. Written informed consent was given to all subjects. This study was approved by the Ethics Review Committee of the Medical Research Institute, School of Medicine, Kyung Hee University. Blood of subjects was tested for biochemical measurements: systolic blood pressure (SBP), diastolic blood pressure (DBP), fasting plasma glucose, total cholesterol (TC), hemoglobin A1c (HBA1c), triglyceride (TG), low-density lipoprotein cholesterol (LDL-C), and high-density lipoprotein cholesterol (HDL-C). DNA samples were extracted by using DNA isolation kit for blood (Roche, Indianapolis, IN, USA).
2. SNP Selection and Genotyping
We examined the association between three SNPs [rs1537514 (3’untranslated region, 3’UTR), rs11559040 (3’UTR), and rs1801133 (Ala222Val)] in exon region and seven SNPs (rs3818762, rs12121543, rs1994798, rs6541003, rs4846052, rs17037396, and rs17367504) in intron region of MTHFR gene and obesity. Ten SNPs of MTHFR gene in were selected using the following criteria: (1) known heterozygosity and minor allele frequency (MAF)>0.05; (2) reported validation on the basis of SNP databases (http://www.hapmap.org and http://ncbi.nlm.nih.
gov/SNP); (3) In previous studies, polymorphisms were shown
Table 1. Clinical and biochemical characteristics in overweight/obese and control subjects.
Overweight/obese Control p (n=209) (n=160) Age (years)
BMI (kg/m2) SBP (mmHg) DBP (mmHg)
Fasting plasma glucose (mg/dl) TC (mg/dl)
HBA1c (%) TG (mg/dl) LDL-C (mg/dl) HDL-C (mg/dl)
44.7±6.4 25.6±2.0 124.1±17.7 77.8±11.3 93.6±14.8 196.9±34.2 5.5±0.7 140.3±118.4 118.9±32.2 49.9±11.3
43.7±6.2 21.1±1.2 115.4±16.1 71.9±10.3 89.8±11.5 186.4±30.0 5.3±0.4 97.5±56.7 109.4±28.8 56.9±13.2
0.115 0.001 0.001 0.001 0.009 0.002 0.031 0.001 0.003 0.001 Data are mean±standard deviation. n: number of subjects, BMI: body mass index, SBP: systolic blood pressure, DBP: diastolic blood pressure, TC: total cholesterol, HBA1c: hemoglobin A1c, TG: triglyceride, LDL-C:
low-density lipoprotein cholesterol, HDL-C: high-density lipoprotein cholesterol.
association with various diseases. The position of selected SNPs is shown in Fig. 1A.
The genotyping was performed using Affymetrix targeted genotyping chip array (Affymetrix, CA, USA), according to the manufacturer protocol. This chip uses molecular inversion probe technology with gene chip universal microarrays to provide a method that is capable of analyzing thousands of variants in a single reaction. In brief, DNA was digested with Xba I (New England Biolabs, Beverly, MA), and was subjected to PCR using primers specific to the adaptor sequence (P/N 900409, Affymetrix). PCR products were purified and the fragmented DNA was then end-labeled with biotin using terminal deoxynucleotidyl transferase. Labeled DNA was then hybridized onto the Mapping Array. The hybridized array was washed, stained, and scanned according to the manufacturer's instructions.
The image was analyzed using GCOS software (Affymetrix).
3. Statistical Analysis
For analysis of genetic data, SNPStats (http://bioinfo.iconcologi a. net/index.php), HelixTree (Golden Helix Inc., Bozeman, MT, USA), and SNPAnalyzer (ISTECH Inc., Goyang, Korea) were used. Multiple logistic regression models were used for OR, 95%
CI, and p value, adjusting for age and gender as covariables. For the defined results, p values were recalculated by Bonferroni correction. A linkage disequilibrium (LD) block of polymorphisms was tested using Haploview 4.2. Clinical and biochemical cha- racteristics in overweight/obese and control subjects were analyzed using SPSS 18.0 (SPSS Inc., Chicago, IL, USA). The level of significance was set at 0.05.
RESULTS
Table 1 presents the clinical and biochemical characteristics in overweight/obese and control subjects. The subjects were cate- gorized using BMI values (overweight/obese, BMI<23, n=209;
control, BMI<23, n=160). The average of BMI in the over- weight/obese group was significantly higher than that in the control group (p=0.001). The levels of SBP, DBP, fasting plasma glucose, TC, HBA1c, TG, and LDL-C in overweight/obese were higher compared to those of control subjects (p<0.05). The level of HDL-C in the overweight/obese subjects was lower than that
in the control group (p=0.001).
Two hundred nine overweight/obese subjects and 160 control healthy subjects were genotyped in order to evaluate whether MTHFR polymorphisms were associated with obesity. Genotype distributions of MTHFR SNPs were consistent with the Hardy- Weinberg equilibrium in the control group (data not shown).
Genotype and allele frequencies of MTHFR SNPs in overweight/
obese and control subjects are displayed in Table 2 and Table 3.
The genetic data were analyzed by logistic regression analyses controlling age and sex (codominant 1, codominant 2, dominant, and recessive models).
In genotype frequency analyses, seven SNPs showed asso- ciations with overweight/obese [rs1537514, p=0.009 in codo- minant 1 model (C/C versus CG), p=0.003 in dominant model;
rs12121543, p=0.036 in dominant model; rs1994798, p=0.043
in dominant model; rs1801133, p=0.045 in codominant 1 model
(T/T versus T/C), p=0.046 in codominant 2 model (T/T versus
C/C), p=0.028 in dominant model; rs4846052, p=0.043 in
codominant 1 model (C/C versus C/T); rs17037396, p=0.013 in
codominant 1 model (C/C versus C/T), p=0.007 in dominant
model; rs17367504, p=0.003 in codominant 1 model (A/A
versus A/G), p=0.001 in dominant model] (Table 2). After
Bonferroni correction, two SNPs (rs1537514 and rs17367504)
were significant (rs1537514, OR=2.73, 95% CI=1.36∼.47,
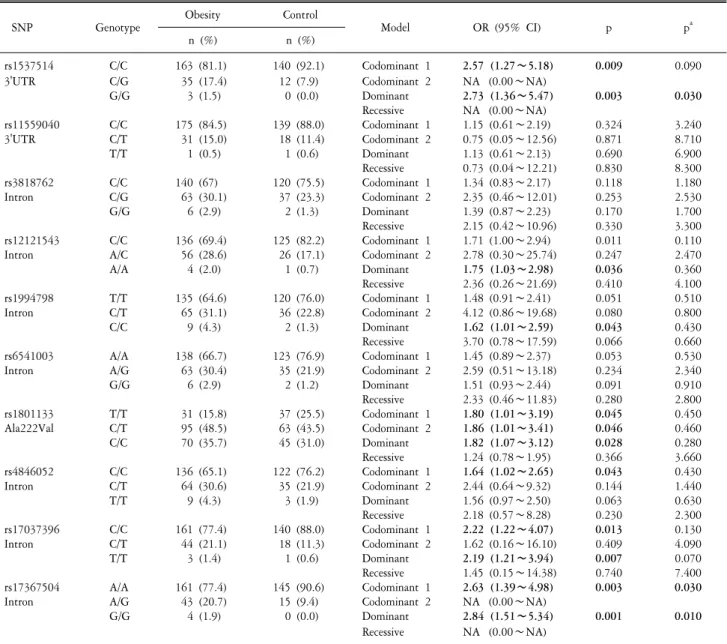
Table 2. Genotype frequencies of single nucleotide polymorphisms of MTHFR gene in overweigh/obese and control subjects.
SNP Genotype Obesity Control
Model OR (95% CI) p pa
n (%) n (%)
rs1537514 C/C 163 (81.1) 140 (92.1) Codominant 1 2.57 (1.27∼5.18) 0.009 0.090
3'UTR C/G 35 (17.4) 12 (7.9) Codominant 2 NA (0.00∼NA)
G/G 3 (1.5) 0 (0.0) Dominant 2.73 (1.36∼5.47) 0.003 0.030
Recessive NA (0.00∼NA)
rs11559040 C/C 175 (84.5) 139 (88.0) Codominant 1 1.15 (0.61∼2.19) 0.324 3.240
3'UTR C/T 31 (15.0) 18 (11.4) Codominant 2 0.75 (0.05∼12.56) 0.871 8.710
T/T 1 (0.5) 1 (0.6) Dominant 1.13 (0.61∼2.13) 0.690 6.900
Recessive 0.73 (0.04∼12.21) 0.830 8.300
rs3818762 C/C 140 (67) 120 (75.5) Codominant 1 1.34 (0.83∼2.17) 0.118 1.180
Intron C/G 63 (30.1) 37 (23.3) Codominant 2 2.35 (0.46∼12.01) 0.253 2.530
G/G 6 (2.9) 2 (1.3) Dominant 1.39 (0.87∼2.23) 0.170 1.700
Recessive 2.15 (0.42∼10.96) 0.330 3.300
rs12121543 C/C 136 (69.4) 125 (82.2) Codominant 1 1.71 (1.00∼2.94) 0.011 0.110
Intron A/C 56 (28.6) 26 (17.1) Codominant 2 2.78 (0.30∼25.74) 0.247 2.470
A/A 4 (2.0) 1 (0.7) Dominant 1.75 (1.03∼2.98) 0.036 0.360
Recessive 2.36 (0.26∼21.69) 0.410 4.100
rs1994798 T/T 135 (64.6) 120 (76.0) Codominant 1 1.48 (0.91∼2.41) 0.051 0.510
Intron C/T 65 (31.1) 36 (22.8) Codominant 2 4.12 (0.86∼19.68) 0.080 0.800
C/C 9 (4.3) 2 (1.3) Dominant 1.62 (1.01∼2.59) 0.043 0.430
Recessive 3.70 (0.78∼17.59) 0.066 0.660
rs6541003 A/A 138 (66.7) 123 (76.9) Codominant 1 1.45 (0.89∼2.37) 0.053 0.530
Intron A/G 63 (30.4) 35 (21.9) Codominant 2 2.59 (0.51∼13.18) 0.234 2.340
G/G 6 (2.9) 2 (1.2) Dominant 1.51 (0.93∼2.44) 0.091 0.910
Recessive 2.33 (0.46∼11.83) 0.280 2.800
rs1801133 T/T 31 (15.8) 37 (25.5) Codominant 1 1.80 (1.01∼3.19) 0.045 0.450
Ala222Val C/T 95 (48.5) 63 (43.5) Codominant 2 1.86 (1.01∼3.41) 0.046 0.460
C/C 70 (35.7) 45 (31.0) Dominant 1.82 (1.07∼3.12) 0.028 0.280
Recessive 1.24 (0.78∼1.95) 0.366 3.660
rs4846052 C/C 136 (65.1) 122 (76.2) Codominant 1 1.64 (1.02∼2.65) 0.043 0.430
Intron C/T 64 (30.6) 35 (21.9) Codominant 2 2.44 (0.64∼9.32) 0.144 1.440
T/T 9 (4.3) 3 (1.9) Dominant 1.56 (0.97∼2.50) 0.063 0.630
Recessive 2.18 (0.57∼8.28) 0.230 2.300
rs17037396 C/C 161 (77.4) 140 (88.0) Codominant 1 2.22 (1.22∼4.07) 0.013 0.130
Intron C/T 44 (21.1) 18 (11.3) Codominant 2 1.62 (0.16∼16.10) 0.409 4.090
T/T 3 (1.4) 1 (0.6) Dominant 2.19 (1.21∼3.94) 0.007 0.070
Recessive 1.45 (0.15∼14.38) 0.740 7.400
rs17367504 A/A 161 (77.4) 145 (90.6) Codominant 1 2.63 (1.39∼4.98) 0.003 0.030
Intron A/G 43 (20.7) 15 (9.4) Codominant 2 NA (0.00∼NA)
G/G 4 (1.9) 0 (0.0) Dominant 2.84 (1.51∼5.34) 0.001 0.010
Recessive NA (0.00∼NA)
Genotype distributions are shown as number (%). p values were from logistic regression analyses with the codominant 1, codominant 2, dominant, and recessive models controlling age and gender as covariates. ap values were calculated using Bonferroni correction. Total numbers of 3 genotypes in each SNP were different because genotypes with missing data were omitted. Bold numbers mean significant associations. MTHFR: methylenetetrahydrofolate reductase, UTR: untranslated region, OR: odds ratio, CI: confidence interval, n: number of subjects, SNP: single nucleotide polymorphism, NA: not applicable.
p=0.030 in dominant model) (rs17367504, OR=2.63, 95%
CI=1.39∼4.98, p=0.030 in codominant 1 model; OR=2.84, 95% CI=1.51-5.34, p=0.010 in dominant model) (Table 2).
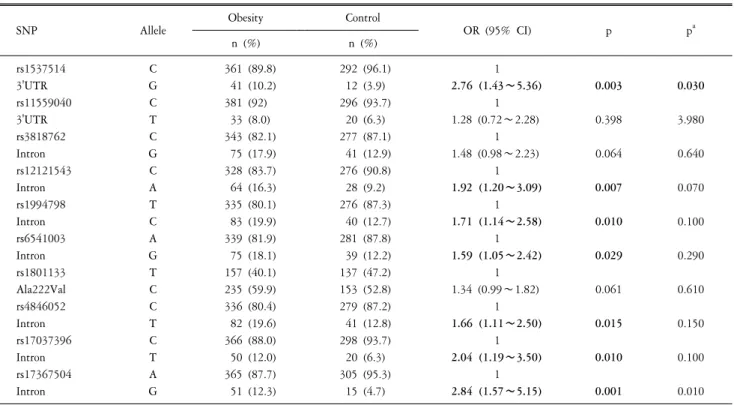
In allele distribution analysis, allele of seven SNPs of MTHFR gene was associated with overweight/obese (rs1537514, p=0.003;
rs12121543, p=0.007; rs1994798, p=0.010; rs6541003, p=
0.029; rs4846052, p=0.015; rs17037396, p=0.010; rs17367504,
p=0.001) (Table 3). However, allele frequencies of three SNPs
(rs11559040, rs3818762, and rs1801133) of MTHFR gene did
not show any significant differences. After Bonferroni correction,
alleles of rs1537514 and rs17367504 were associated with
overweight/obese (rs1537514, OR=2.76, 95% CI=1.43∼5.36,
Table 3. Allele frequencies of single nucleotide polymorphisms of MTHFR gene in overweigh/obese and control subjects.
SNP Allele Obesity Control
OR (95% CI) p pa
n (%) n (%)
rs1537514 C 361 (89.8) 292 (96.1) 1
3'UTR G 41 (10.2) 12 (3.9) 2.76 (1.43∼5.36) 0.003 0.030
rs11559040 C 381 (92) 296 (93.7) 1
3'UTR T 33 (8.0) 20 (6.3) 1.28 (0.72∼2.28) 0.398 3.980
rs3818762 C 343 (82.1) 277 (87.1) 1
Intron G 75 (17.9) 41 (12.9) 1.48 (0.98∼2.23) 0.064 0.640
rs12121543 C 328 (83.7) 276 (90.8) 1
Intron A 64 (16.3) 28 (9.2) 1.92 (1.20∼3.09) 0.007 0.070
rs1994798 T 335 (80.1) 276 (87.3) 1
Intron C 83 (19.9) 40 (12.7) 1.71 (1.14∼2.58) 0.010 0.100
rs6541003 A 339 (81.9) 281 (87.8) 1
Intron G 75 (18.1) 39 (12.2) 1.59 (1.05∼2.42) 0.029 0.290
rs1801133 T 157 (40.1) 137 (47.2) 1
Ala222Val C 235 (59.9) 153 (52.8) 1.34 (0.99∼1.82) 0.061 0.610
rs4846052 C 336 (80.4) 279 (87.2) 1
Intron T 82 (19.6) 41 (12.8) 1.66 (1.11∼2.50) 0.015 0.150
rs17037396 C 366 (88.0) 298 (93.7) 1
Intron T 50 (12.0) 20 (6.3) 2.04 (1.19∼3.50) 0.010 0.100
rs17367504 A 365 (87.7) 305 (95.3) 1
Intron G 51 (12.3) 15 (4.7) 2.84 (1.57∼5.15) 0.001 0.010
Allele distributions are shown as number (%). p values were from regression analyses. ap values were calculated using Bonferroni correction. Total numbers of two alleles in each SNP were different because genotypes with missing data were omitted. Bold numbers mean significant associations. MTHFR:
methylenetetrahydrofolate reductase, UTR: untranslated region, OR: odds ratio, CI: confidence interval, n: number of subjects, SNP: single nucleotide polymorphism.
Table 4. Frequencies of haplotypes in overweight/obese and control subjects.
Haplotype Frequency Overweight/obese Control
Chi square p
+ − + −
CCCTATC CCCTACC CGACGCT TGACGCT
0.425 0.392 0.076 0.067
167.2 162.7 42.5 29.9
250.8 255.3 375.5 388.1
146.3 126.5 13.4 19.4
173.7 193.5 306.6 300.6
2.435 0.026 9.312 0.352
0.119 0.871 0.002 0.553 Haplotypes consist of rs11559040, rs3818762, rs12121543, rs1994798, rs6541003, rs1801133, and rs4846052. Bold number means significant association.
p=0.030; rs17367504, OR=2.84, 95% CI=1.57∼5.15, p=
0.010) (Table 3).
Ten SNPs of MTHFR gene were analyzed for LD and ha- plotypes using Haploview 4.2 (Barrett, 2009). The LD block was composed of rs11559040, rs3818762, rs12121543, rs1994798, rs6541003, rs1801133, and rs4846052 (Fig. 1B). There were four haplotypes in LD block (haplotype CCCTATC, frequency=0.425;
CCCTACC, frequency=0.392; CGACGCT, frequency=0.076;
TGACGCT, frequency=0.067) (Table 4). Haplotype (CGACGCT) in LD block was associated with overweight/obese (chi square=
9.312, p=0.002) (Table 4).
DISCUSSION
In recent, obesity and its connection to genetics especially
using SNPs are actively studied. A potentially promising approach
toward the scientists finding the genetic factors with its susceptibility to obesity has been suggested in previous studies (Selby et al., 1989; Ortega-Alonso et al., 2009; Cheung CY, et al., 2010). More recently, several studies were reported to have associations between obesity and polymorphisms of various genes, such as leptin receptor (LEPR) (Ben Ali et al., 2010), toll-like receptor 4 (TLR4) (Jermendy et al., 2010), and fat mass and obesity associated (FTO) (Rodriguez-Lopez et al., 2010). Ben et al.
(2010) presented that G3057A (rs62589000) LEPR polymorphism is associated with obesity in Tunisian women (Ben Ali et al., 2010). Jermendy et al.(2010) reported that serum levels of tumor necrosis factor (TNF)-alpha and its soluble receptors are increased and associated with BMI values in obese children, suggesting that serum cytokine levels, as modifying factors of insulin resistance, may be influenced by TLR4 gene polymorphisms in obese children. The allele of rs9939609 in FTO gene was shown significant association with severe obesity starting in childhood among the Spanish population, and haplotype composed of rs1861868 and rs9939609 of FTO gene was also contributed to severe obesity (Rodriguez-Lopez et al., 2010).
In this study, we observed SNPs in MTHFR gene were correlated with obesity in Korean population. The MTHFR association with susceptibility to various diseases including congenital heart defects (Garcia-Fragoso et al., 2010) and hepatocellular carcinoma (Jin et al., 2009) has been studied.
García-Fragoso et al.(2010) showed that mothers of children with congenital heart defects were likely to be compound heterozygotes of MTHFR polymorphism (rs1801133). MTHFR C677T poly- morphism (rs1801133) was increased the risk of hepatocellular carcinoma and might be a risk factor for hepatocellular carcinoma occurrence, especially in chronic liver disease patients (Jin et al., 2009). The allele of rs1801133 (C677T, Ala222Val) is charac- terized by a point change at position 677 of coding region in the MTHFR gene that converts a cytosine (C) into a thymine (T).
This leads to in an amino acid substitution (alanine to valine) (Frosst et al., 1995).
Lambrinoudaki et al.(2008) showed that MTHFR Ala222Val polymorphism were associated with increased androgenicity and elevated BMI in healthy postmenopausal women. However, Settin et al.(2009) reported that there was no correlation between MTHFR polymorphisms and non-complicated overweight or
obesity among Saudi population. In present study, rs1801133 SNP (Ala222Val) was displayed lack of association with obesity.
However, other SNPs (rs1537514 and 17367504) of MTHFR gene were correlated to obesity. G allele frequency of rs1537514 in overweight/obese subjects was higher than that in control subjects (10.2% versus 3.9%). G allele frequency of rs17367504 in overweight/obese subjects was also increased, compared to control subjects (12.3% versus 4.7%). The results suggest that G alleles of rs1537514 and rs17367504 may be risk factors to obesity.
In conclusion, we investigated whether SNPs of MTHFR gene are related to overweight/obese in Korean population. The genotypes and alleles of SNPs (rs1537514 and 17367504) showed significant differences between overweight/obese and control subjects. Haplotype (CGACGCT) was also associated with overweight/obese. These results indicate that MTHFR gene may be related to the susceptibility to obesity in Korean population.
REFERENCES
Bagley PJ, Selhub J (1998) A common mutation in the methylenetetrahydrofolate reductase gene is associated with an accumulation of formylated tetrahydrofolates in red blood cells.
Proc. Natl. Acad. Sci. USA. 95:13217-13220.
Barness LA, Opitz JM, Gilbert-Barness E (2007) Obesity: genetic, molecular, and environmental aspects. Am. J. Med. Genet. A.
143:3016-3034.
Barrett JC (2009) Haploview: visualization and analysis of SNP genotype data. Cold. Spring. Harb. Protoc. pdb ip71.
Ben Ali S, Sediri Y, Kallel A et al. (2010) The G3057A LEPR polymorphism is associated with obesity in Tunisian women.
Nutr. Metab. Cardiovasc. Dis. [Epub ahead of print].
Burke GL, Bertoni AG, Shea S et al. (2008) The impact of obesity on cardiovascular disease risk factors and subclinical vascular disease: the Multi-Ethnic Study of Atherosclerosis. Arch. Intern.
Med. 168:928-935.
Cheung CY, Tso AW, Cheung BM et al. (2010) Obesity susceptibility genetic variants identified from recent genome-wide association studies: implications in a Chinese population. J. Clin.
Endocrinol. Metab. 95:1395-1403.
Frosst P, Blom HJ, Milos R et al. (1995) A candidate genetic risk factor for vascular disease: a common mutation in methylenetet- rahydrofolate reductase. Nat. Genet. 10:111-113.
Garcia-Fragoso L, Garcia-Garcia I, Leavitt G et al. (2010) MTHFR
= 국문초록 =
최근 비만의 병인에 대한 유전자의 single nucleotide polymorphism (단일염기다형성)에 관한 연구가 활발히 이루어지고 있다. Methylenetetrahydrofolate reductase (MTHFR)은 folate 대사에 관여하는 효소이다. 본 연구에서는 MTHFR 유전자의 다형성과 비만과의 관련성을 보기 위하여, 209명의 비만/과체중 환자와 160명의 정상체중인 사람을 비교하였다.
MTHFR 유전자의 액손 부분에서 3개(rs1537514, rs11559040 및 rs1801133)의 단일염기다형성과 인트론 부분에서 7개 (rs3818762, rs12121543, rs1994798, rs6541003, rs4846052, rs17037396 및 rs17367504)의 단일염기다형성을 선정하였다.
염기서열 분석 방법은 Affymetrix 사의 타깃 칩을 이용하여 염기서열을 분석하였다. 유전자 분석은 SNPStats, HelixTree, SNPAnalyzer 및 Haploview version 4.2 소프트웨어를 이용하였고, Bonferroni correction을 하였다. 분석결과, rs1537514과 rs17367504의 genotype이 비만/과체중 그룹과 유의성이 있었다(rs1537514, OR=2.73, 95% CI=1.36∼5.47, p=0.030 in dominant model) (rs17367504, OR=2.63, 95% CI=1.39∼4.98, p=0.030 in codominant 1 model; OR=2.84, 95%
CI=1.51∼5.34, p=0.010 in dominant model). 또한. rs1537514과 rs17367504의 allele가 비만/과체중 그룹과 관련을 보였다 (rs1537514, OR=2.76, 95% CI=1.43∼5.36, p=0.030; rs17367504, OR=2.84, 95% CI=1.57∼5.15, p=0.010). Haplotype (일 배체형) 분석에서도 MTHFR의 7개의 단일염기다형성이 이루는 일배체형(CGACGCT)이 유의성을 보였다(chi square=
9.312, p=0.002). 이러한 결과는 MTHFR 유전자가 비만과 관련이 있음을 시사한다.
중심단어: Methylenetetrahydrofolate reductase, 비만, 과체중, 단일염기다형성, 연관연구
polymorphisms in Puerto Rican children with isolated congenitalheart disease and their mothers. Int. J. Genet. Mol. Biol. 2:43-47.
Gomes F, Telo DF, Souza HP et al. (2010) Obesity and coronary artery disease: role of vascular inflammation. Arq. Bras. Cardiol.
94:255-261.
Guenther BD, Sheppard CA, Tran P et al. (1999) The structure and properties of methylenetetrahydrofolate reductase from Escheri- chia coli suggest how folate ameliorates human hyperhomocystei- nemia. Nat. Struct. Biol. 6:359-365.
Haslam DW, James WP (2005) Obesity. Lancet 366:1197-1209.
Jermendy A, Korner A, Kovacs M et al. (2010) Association between toll-like receptor polymorphisms and serum levels of tumor necrosis factor-alpha and its soluble receptors in obese children.
Med. Sci. Monit. 16:CR180-185.
Jin F, Qu LS, Shen XZ (2009) Association between the methylenete- trahydrofolate reductase C677T polymorphism and hepatocellular carcinoma risk: a meta-analysis. Diagn. Pathol. 4:39.
Lambrinoudaki I, Kaparos G, Papadimitriou D et al. (2008) Methyle- netetrahydrofolate reductase C677T polymorphism is associated with central adiposity and increased androgenicity in healthy postmenopausal women. Eur. J. Endocrinol. 159:233-241.
Lorincz AM, Sukumar S (2006) Molecular links between obesity and
breast cancer. Endocr. Relat. Cancer. 13:279-292.
Matthews RG, Sheppard C, Goulding C (1998) Methylenetetrahydro- folate reductase and methionine synthase: biochemistry and molecular biology. Eur. J. Pediatr. 157(Suppl 2):S54-59.
Ortega-Alonso A, Sipila S, Kujala UM et al. (2009) Genetic influences on adult body mass index followed over 29 years and their effects on late-life mobility: a study of twin sisters. J.
Epidemiol. Community. Health. 63:651-658.
Rodriguez-Lopez R, Gonzalez-Carpio M, Serrano MV et al. (2010) Association of FTO gene polymorphisms and morbid obesity in the population of Extremadura (Spain). Endocrinol. Nutr.
57:203-209.
Selby JV, Newman B, Quesenberry CP et al. (1989) Evidence of genetic influence on central body fat in middle-aged twins. Hum.
Biol. 61:179-194.
Settin AA, Algasham A, Dowaidar M et al. (2009) Methylene tetrahydrofolate reductase and angiotensin converting enzyme gene polymorphisms related to overweight/obesity among Saudi subjects from Qassim Region. Dis. Markers 27:97-102.
Takeshima T (2009) Metabolic syndrome and prevention of migraine headache. Brain Nerve. 61:1143-1153.