hpm
Evaluating the Performance of the Emergency Medical Services Index
Sang Jun Eun1, Jin-Seok Lee2, Yoon Kim2, Koo Young Jung3, Sue Kyung Park4, Jin Yong Lee5
1Regional Cardiocerebrovascular Center, Seoul National University Bundang Hospital, Seongnam; 2Department of Health Policy and Management, Seoul National University College of Medicine, Institute of Health Policy and Management, Seoul National University Medical Research Center; 3Department of Emergency Medicine, Ewha Womans University School of Medicine; 4Department of Preventive Medicine, Seoul National University College of Medicine;
5Public Health Medical Service, Seoul Metropolitan Government Seoul National University Boramae Medical Center, Seoul, Korea
Background: In 2006 Emergency Medical Services Index (EMSI), which summarizes the performance of regional emergency medi- cal services system, was developed. This study assesses the performance of the EMSI to help determine whether EMSI can be used as evaluation tool.
Methods: To build a composite score of the EMSI from predefined 24 indicators, 3 normalized values were calculated for each indi- cator, the normalized values of each indicator were weighted using 4 weighting methods, and the weighted values were aggre- gated into the final composite score using 2 aggregation schemes. The performance of EMSI was evaluated using 3 criteria: discrimi- nation, construct validity, and sensitivity. Discrimination was the proportion of regions that did not include the overall median rank in the 5th to 95th percentiles rank interval, which was calculated from Monte Carlo simulation. Construct validity was a correlation among the alternative EMSIs. Sensitivity of EMSIs was evaluated by total shift of quartile membership and changes of 5th to 95th percentile intervals.
Results: The total discrimination performance of the EMSI was 50.0%. Correlation coefficients between EMSIs using standardized values and those using rescaled values ranged from 0.621 to 0.997. Variation of the quartile membership of regions ranged from 0.0% to 75.0%. The total change in the 5th to 95th percentile intervals ranged from -19 to +17 places.
Conclusion: The results suggested that the EMSI could be used as a tool for evaluating quality of regional EMS system and for iden- tifying the areas for quality improvement.
Keywords: Emergency medical services; Quality assurance; Quality indicators, health care; Methods
INTRODUCTION
Improving the quality of the regional emergency medical ser- vices (EMS) system and promoting the accountability of its repre- sentatives are critical in advancing the EMS system’s overall per- formance. The regionalization of the EMS system has generally re- sulted in improved patient care, reduced mortality rates for trau- ma patients, and lower costs, but a lack of accountability has con- tributed to poor problem identification and few improvements in quality [1,2]. Thus, the American College of Emergency Physicians evaluated their EMS system on a state by state basis to promote government policies for improving emergency care [3,4].
In Korea the EMS systems of different regions display a wide range of performance differences including trauma mortality
rates and pre-hospital times [5,6]. To address some of the problems associated with these differences, the Ministry of Health and Wel- fare (MOHW) and the National Emergency Medical Center (NEMC) have evaluated the quality of emergency medical centers.
However, because these programs focused only on emergency care at the hospital stage, other important aspects of the EMS systems, such as care at the pre-hospital stage and accountability of the re- gional governments, were not evaluated. Hence, in 2006, MOHW developed the Emergency Medical Services Index (EMSI) as a composite indicator to comprehensively evaluate the regional EMS system on a province by province basis [7]. The EMSI was ex- pected to influence providers to focus on the quality of their EMS systems and to promote the accountability of the provincial gov- ernments in managing their EMS systems. The EMSI, however,
Correspondence to: Yoon Kim
Department of Health Policy and Management, Seoul National University College of Medicine, 103 Daehak-ro, Jongno-gu, Seoul 110-799, Korea Tel: +82-2-2072-3124, Fax: +82-2-743-2009, E-mail: [email protected]
Received: March 8, 2013 / Accepted after revision: May 20, 2013 © Korean Academy of Health Policy and Management http://dx.doi.org/10.4332/KJHPA.2013.23.2.176
was not validated for its own performance in the developing pro- cess by the MOHW.
Unlike individual indicators, composite indicators can summa- rize complex or multidimensional issues and are typically easier to interpret than attempting to determine a trend among many sepa- rate indicators. Additionally, composite indicators can place re- gional issues of performance and progress at the forefront of the policy arena, facilitate communication with ordinary citizens, and promote accountability. The construction of composite indicators, however, involves subjective judgments, such as the choice of an aggregation model or the weighting of the various indicators.
These choices could bias policy messages and lend themselves to instrumental abuse [8-10].
Therefore, the purpose of this study was to assess the perfor- mance of the EMSI in terms of discrimination, construct validity, and sensitivity to help determine whether composite indicators can be used to evaluate the performance of regional EMS systems objectively and reliably.
METHODS
1. Evaluation Fields and Indicators of the Emergency Medical Services Index
The quality of 16 different regional EMS systems, including 9 provinces and 7 metropolitan regions, were evaluated using the
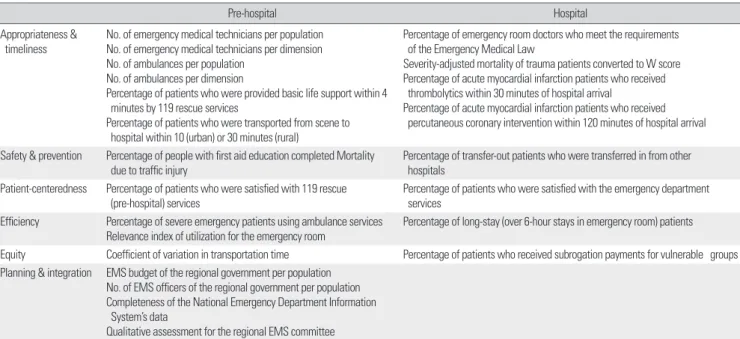
EMSI. Evaluation fields of the EMSI consisted of six quality im- provement areas: appropriateness and timeliness, safety and pre- vention, patient-centeredness, efficiency, equity, and planning and integration. Each of the six quality improvement areas were evalu- ated at the pre-hospital and hospital level for each EMS system.
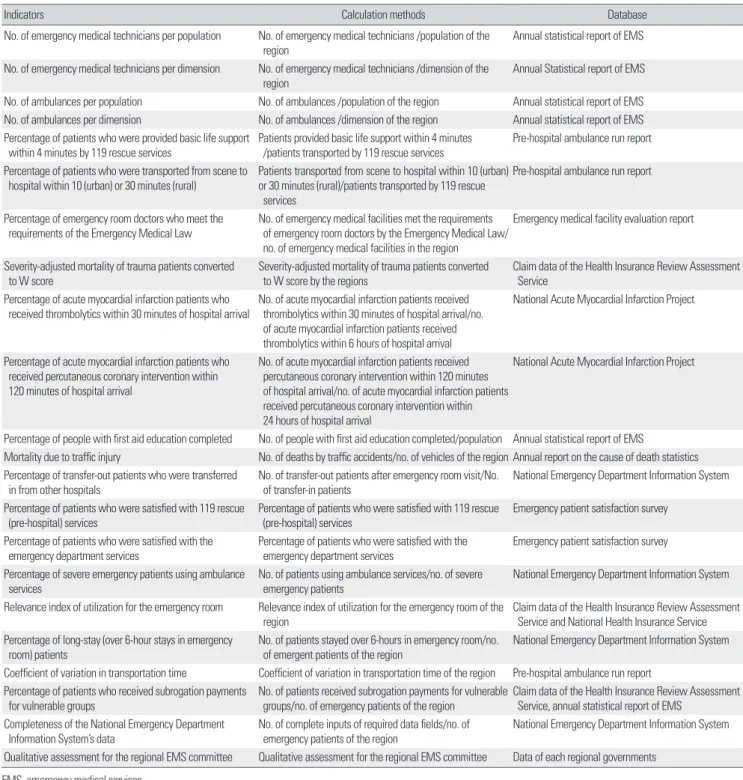
An EMS meeting of experts using a Delphi panel selected the 24 indicators based on their perceived importance, scientific accept- ability, usability, feasibility [11], and their ability to promote the ac- countability of the regional government managing each EMS sys- tem (Table 1). The EMS expert meeting was made up of 5 specialists in emergency medicine and quality improvement. The Delphi panel was composed of 10 members recommended by the Korean Society of Emergency Medicine, 5 consumer group representatives, 14 civil servants from the regional government, MOHW, NEMC, and the National Emergency Management Agency (NEMA). Each indica- tor was measured using a standard information form that included the definition of the indicator, available data sources, and calcula- tion formulas. Multiple data sets were used to yield the value of in- dicators: data from the National Emergency Department Informa- tion System, claim data of the Health Insurance Review Assessment Service and National Health Insurance Service, annual statistical report of EMS of the NEMC, pre-hospital ambulance run report, National Acute Myocardial Infarction Project, emergency medical facility evaluation report, annual report on the cause of death statis- tics and emergency patient satisfaction survey. Table 2 shows calcu-
Table 1. Evaluation fields and indicators of Emergency Medical Services Index
Pre-hospital Hospital
Appropriateness &
timeliness No. of emergency medical technicians per population No. of emergency medical technicians per dimension No. of ambulances per population
No. of ambulances per dimension
Percentage of patients who were provided basic life support within 4 minutes by 119 rescue services
Percentage of patients who were transported from scene to hospital within 10 (urban) or 30 minutes (rural)
Percentage of emergency room doctors who meet the requirements of the Emergency Medical Law
Severity-adjusted mortality of trauma patients converted to W score Percentage of acute myocardial infarction patients who received thrombolytics within 30 minutes of hospital arrival
Percentage of acute myocardial infarction patients who received percutaneous coronary intervention within 120 minutes of hospital arrival Safety & prevention Percentage of people with first aid education completed Mortality
due to traffic injury Percentage of transfer-out patients who were transferred in from other hospitals
Patient-centeredness Percentage of patients who were satisfied with 119 rescue
(pre-hospital) services Percentage of patients who were satisfied with the emergency department services
Efficiency Percentage of severe emergency patients using ambulance services
Relevance index of utilization for the emergency room Percentage of long-stay (over 6-hour stays in emergency room) patients Equity Coefficient of variation in transportation time Percentage of patients who received subrogation payments for vulnerable groups Planning & integration EMS budget of the regional government per population
No. of EMS officers of the regional government per population Completeness of the National Emergency Department Information System’s data
Qualitative assessment for the regional EMS committee EMS, emergency medical services.
lation methods and database used by each individual indicator.1)
2. Construction of the Emergency Medical Services Index No single, standard methodology exists for constructing a com- posite score for a group of quality indicators [12,13]. Therefore, we
followed the construction methodology suggested by the Joint Re- search Centre of the European Commission [8,9]. To build a com- posite score from 24 indicators, 3 normalized values were calculat- ed for each indicator, the normalized values of each indicator were weighted, and the weighted values were aggregated into the final
1) The report presented by Kim et al. [7] contains detail information about the selection process and calculation methods of EMSI indicators developed by MOHW.
Table 2. Information of indicators
Indicators Calculation methods Database
No. of emergency medical technicians per population No. of emergency medical technicians /population of the
region Annual statistical report of EMS
No. of emergency medical technicians per dimension No. of emergency medical technicians /dimension of the
region Annual Statistical report of EMS
No. of ambulances per population No. of ambulances /population of the region Annual statistical report of EMS No. of ambulances per dimension No. of ambulances /dimension of the region Annual statistical report of EMS Percentage of patients who were provided basic life support
within 4 minutes by 119 rescue services Patients provided basic life support within 4 minutes
/patients transported by 119 rescue services Pre-hospital ambulance run report Percentage of patients who were transported from scene to
hospital within 10 (urban) or 30 minutes (rural) Patients transported from scene to hospital within 10 (urban) or 30 minutes (rural)/patients transported by 119 rescue services
Pre-hospital ambulance run report
Percentage of emergency room doctors who meet the
requirements of the Emergency Medical Law No. of emergency medical facilities met the requirements of emergency room doctors by the Emergency Medical Law/
no. of emergency medical facilities in the region
Emergency medical facility evaluation report
Severity-adjusted mortality of trauma patients converted
to W score Severity-adjusted mortality of trauma patients converted
to W score by the regions Claim data of the Health Insurance Review Assessment Service
Percentage of acute myocardial infarction patients who
received thrombolytics within 30 minutes of hospital arrival No. of acute myocardial infarction patients received thrombolytics within 30 minutes of hospital arrival/no.
of acute myocardial infarction patients received thrombolytics within 6 hours of hospital arrival
National Acute Myocardial Infarction Project
Percentage of acute myocardial infarction patients who received percutaneous coronary intervention within 120 minutes of hospital arrival
No. of acute myocardial infarction patients received percutaneous coronary intervention within 120 minutes of hospital arrival/no. of acute myocardial infarction patients received percutaneous coronary intervention within 24 hours of hospital arrival
National Acute Myocardial Infarction Project
Percentage of people with first aid education completed No. of people with first aid education completed/population Annual statistical report of EMS
Mortality due to traffic injury No. of deaths by traffic accidents/no. of vehicles of the region Annual report on the cause of death statistics Percentage of transfer-out patients who were transferred
in from other hospitals No. of transfer-out patients after emergency room visit/No.
of transfer-in patients National Emergency Department Information System Percentage of patients who were satisfied with 119 rescue
(pre-hospital) services Percentage of patients who were satisfied with 119 rescue
(pre-hospital) services Emergency patient satisfaction survey Percentage of patients who were satisfied with the
emergency department services Percentage of patients who were satisfied with the
emergency department services Emergency patient satisfaction survey Percentage of severe emergency patients using ambulance
services No. of patients using ambulance services/no. of severe
emergency patients National Emergency Department Information System
Relevance index of utilization for the emergency room Relevance index of utilization for the emergency room of the
region Claim data of the Health Insurance Review Assessment
Service and National Health Insurance Service Percentage of long-stay (over 6-hour stays in emergency
room) patients No. of patients stayed over 6-hours in emergency room/no.
of emergent patients of the region National Emergency Department Information System Coefficient of variation in transportation time Coefficient of variation in transportation time of the region Pre-hospital ambulance run report
Percentage of patients who received subrogation payments
for vulnerable groups No. of patients received subrogation payments for vulnerable
groups/no. of emergency patients of the region Claim data of the Health Insurance Review Assessment Service, annual statistical report of EMS
Completeness of the National Emergency Department
Information System’s data No. of complete inputs of required data fields/no. of
emergency patients of the region National Emergency Department Information System Qualitative assessment for the regional EMS committee Qualitative assessment for the regional EMS committee Data of each regional governments
EMS, emergency medical services.
composite score.
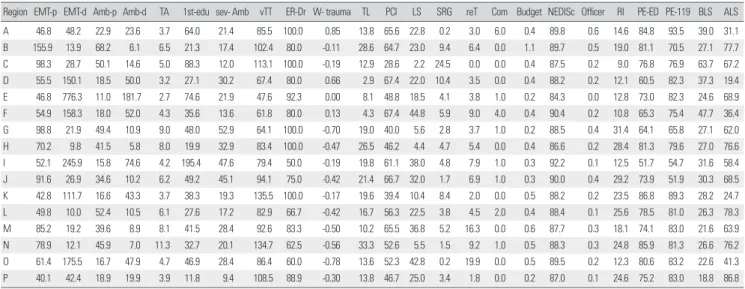
First, for the normalizations, real values of indicators were trans- formed to dimensionless numbers using 3 normalization methods including standardization, rescaling, and ranking. Table 3 shows real values of indicators. In the standardization method, indicators were converted to a common scale with a mean of zero and stan- dard deviation of 1 (Equation 1) so that all the standardized values had similar dispersion across the regions.
(Equation 1)
In the rescaling method, real values of indicators were normal- ized to have an identical range (0; 1) (Equation 2).
(Equation 2)
When geometrically aggregating, to avoid negative or zero val- ues of indicators, a constant greater than the negative standard- ized or rescaled value, three or one for each, was added to the for- mer value [14]. In the ranking method, the highest score was as- signed to the best performer, and the lowest score was assigned to the worst performer. If two or more regions were ranked to the
same position, all of those same ranks were given a better score that was very close to the highest score. All indicators were trans- formed when necessary to “more is better” variables [15].
Second, to reflect the relative importance of each indicator to the EMSI, weights were assigned to each normalized value of the indicators using four different weighting methods: equal weight- ing, expert weighting, weighting by factor analysis, and weighting by area under the receiver operating characteristic curve (AUC).
Expert weighting was calculated by multiplying an average score of importance of an indicator by a score of relative importance among the six evaluation areas that resulted from two rounds of the Delphi survey (Appendix 1). Weighting by factor analysis was calculated by multiplying the factor loading by proportion of the explained variance. For weighting by AUC, a simple logistic re- gression analysis was repeatedly performed for each indicator us- ing rescaled values of indicators as independent variables and W statistics calculated from the severity-adjusted mortality of emer- gency patients as the dependent variable. The W statistic is the dif- ference between the actual and the predicted numbers of survi- vors, divided by the total number of patients per 100 patients.
Usually, weights based on regression approach were calculated from multiple regression models. However, instead of using coeffi- cients of the regression model as weighting scores, AUCs were Standardized value= real value of province-average across provinces
standard deviation across provinces
Rescaled value=real value of province - minimum value across all the provinces maximum value across all the provinces
- minimum value across all the provinces
Table 3. Measured values of indicators
Region EMT-p EMT-d Amb-p Amb-d TA 1st-edu sev- Amb vTT ER-Dr W- trauma TL PCI LS SRG reT Com Budget NEDISc Officer RI PE-ED PE-119 BLS ALS A 46.8 48.2 22.9 23.6 3.7 64.0 21.4 85.5 100.0 0.85 13.8 65.6 22.8 0.2 3.0 6.0 0.4 89.8 0.6 14.6 84.8 93.5 39.0 31.1 B 155.9 13.9 68.2 6.1 6.5 21.3 17.4 102.4 80.0 -0.11 28.6 64.7 23.0 9.4 6.4 0.0 1.1 89.7 0.5 19.0 81.1 70.5 27.1 77.7 C 98.3 28.7 50.1 14.6 5.0 88.3 12.0 113.1 100.0 -0.19 12.9 28.6 2.2 24.5 0.0 0.0 0.4 87.5 0.2 9.0 76.8 76.9 63.7 67.2 D 55.5 150.1 18.5 50.0 3.2 27.1 30.2 67.4 80.0 0.66 2.9 67.4 22.0 10.4 3.5 0.0 0.4 88.2 0.2 12.1 60.5 82.3 37.3 19.4 E 46.8 776.3 11.0 181.7 2.7 74.6 21.9 47.6 92.3 0.00 8.1 48.8 18.5 4.1 3.8 1.0 0.2 84.3 0.0 12.8 73.0 82.3 24.6 68.9 F 54.9 158.3 18.0 52.0 4.3 35.6 13.6 61.8 80.0 0.13 4.3 67.4 44.8 5.9 9.0 4.0 0.4 90.4 0.2 10.8 65.3 75.4 47.7 36.4 G 98.8 21.9 49.4 10.9 9.0 48.0 52.9 64.1 100.0 -0.70 19.0 40.0 5.6 2.8 3.7 1.0 0.2 88.5 0.4 31.4 64.1 65.8 27.1 62.0 H 70.2 9.8 41.5 5.8 8.0 19.9 32.9 83.4 100.0 -0.47 26.5 46.2 4.4 4.7 5.4 0.0 0.4 86.6 0.2 28.4 81.3 79.6 27.0 76.6 I 52.1 245.9 15.8 74.6 4.2 195.4 47.6 79.4 50.0 -0.19 19.8 61.1 38.0 4.8 7.9 1.0 0.3 92.2 0.1 12.5 51.7 54.7 31.6 58.4 J 91.6 26.9 34.6 10.2 6.2 49.2 45.1 94.1 75.0 -0.42 21.4 66.7 32.0 1.7 6.9 1.0 0.3 90.0 0.4 29.2 73.9 51.9 30.3 68.5 K 42.8 111.7 16.6 43.3 3.7 38.3 19.3 135.5 100.0 -0.17 19.6 39.4 10.4 8.4 2.0 0.0 0.5 88.2 0.2 23.5 86.8 89.3 28.2 24.7 L 49.8 10.0 52.4 10.5 6.1 27.6 17.2 82.9 66.7 -0.42 16.7 56.3 22.5 3.8 4.5 2.0 0.4 88.4 0.1 25.6 78.5 81.0 26.3 78.3 M 85.2 19.2 39.6 8.9 8.1 41.5 28.4 92.6 83.3 -0.50 10.2 65.5 36.8 5.2 16.3 0.0 0.6 87.7 0.3 18.1 74.1 83.0 21.6 63.9 N 78.9 12.1 45.9 7.0 11.3 32.7 20.1 134.7 62.5 -0.56 33.3 52.6 5.5 1.5 9.2 1.0 0.5 88.3 0.3 24.8 85.9 81.3 26.6 76.2 O 61.4 175.5 16.7 47.9 4.7 46.9 28.4 86.4 60.0 -0.78 13.6 52.3 42.8 0.2 19.9 0.0 0.5 89.5 0.2 12.3 80.6 83.2 22.6 41.3 P 40.1 42.4 18.9 19.9 3.9 11.8 9.4 108.5 88.9 -0.30 13.8 46.7 25.0 3.4 1.8 0.0 0.2 87.0 0.1 24.6 75.2 83.0 18.8 86.8 EMT-p, no. of emergency medical technician per population; EMT-d, no. of emergency medical technician per dimension; Amb-p, no. of ambulance per population; Amb-d, no. of am- bulance per dimension; TA, mortality due to traffic injury; 1st-edu, percentage of first aid education completed; sev-Amb, percentage of severe emergent patients using ambulance services; vTT, variations in transportation time; ER-Dr, percentage of emergency room doctors that meet the requirements; W-trauma, severity adjusted mortality of trauma patients;
TL, thrombolytics received within 30 minutes of hospital arrival; PCI, percutaneous coronary intervention (PCI received within 120 minutes of hospital arrival); LS, percentage of long- stay patients; SRG, subrogation payments for vulnerable groups; reT, percentage of retransfer; Com, regional EMS committee; Budget, EMS budget of regional government; NEDISc, National Emergency Department Information System (completeness of NEDIS data); Officer, no. of EMS officer of regional government; RI, regional relevance index; PE-ED, patients’
experiences evaluation for the emergency departments; PE-119, patients’ experiences evaluation for the 119 rescue services; BLS, elapsed time to providing basic life supports; ALS, elapsed time to providing advanced life supports.
used for weighting because when correlations among the indica- tors are strong, and regression coefficients cannot estimate the ef- fect of indicators on the index due to multicollinearity [8]. Because of the statistically significant correlation among the indicators of the EMSI in this study, the AUC derived using a simple logistic re- gression analysis was used to weight each indicator. It was regard- ed as an event when rescaled W statistics were ≥0.5 but not an event when <0.5.
Finally, weighted normalized values of indicators were aggregat- ed using linear (Equation 3) and geometric schemes (Equation 4).
(Equation 3)
EMSI = normalized value × weight (Equation 4)
EMSI = normalized valueweight
3. Evaluating the performance of the Emergency Medical Services Index
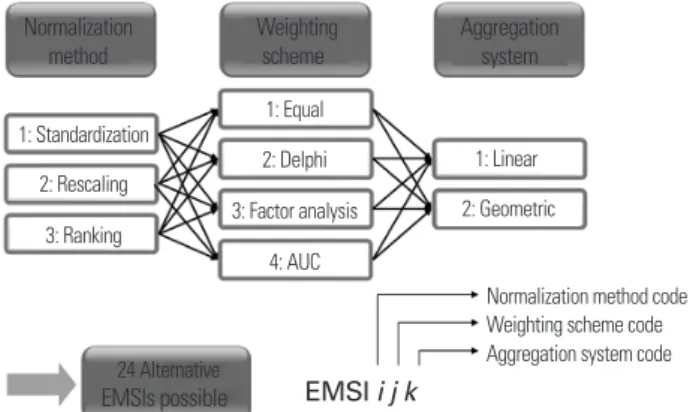
Twenty-four alternative EMSIs could be constructed and were expressed as “EMSIijk,” where i is the type of normalization, j is the type of weighting scheme, and k is the type of aggregation system (Figure 1). The performance of EMSI was evaluated using three criteria: discrimination, construct validity, and sensitivity. Dis- crimination is the ability of the EMSI to differentiate performance as measured by statistically significant deviations from the medi- an performance [16,17]. Considering the uncertainties in EMSI building, a Monte Carlo simulation was conducted. The output variable was the EMSI rank for a region and the input factors were the type of normalization for the indicators (standardization, res- caling, and ranking), the weighting scheme (equal weights, expert weights, weights by factor analysis, and weights by AUC), and the aggregation methods (linear and geometric). Uncertain input fac-
tors (k) were sampled from a discrete uniform distribution in a quasi-random sampling scheme using a base sample of size n=512. EMSI ranks per region were calculated by performing 2n (k + 1) = 4096 simulations [10]. Regions were classified into a high performer group when the 95th percentile of the EMSI ranks for the region was equal to or better than median, a low performer group when the 5th percentile of the EMSI ranks was equal to or worse than the median, or a middle performer group if otherwise.
The measure of discrimination of performance was expressed as the sum of the percentages of the high and low performers.
Construct validity is the degree of association between the com- posite and other aggregate measures of quality [16-18]. In this study, for looking primarily at the consistency among the alternative EM- SIs, construct validity was operationally defined as a correlation among the alternative EMSIs.
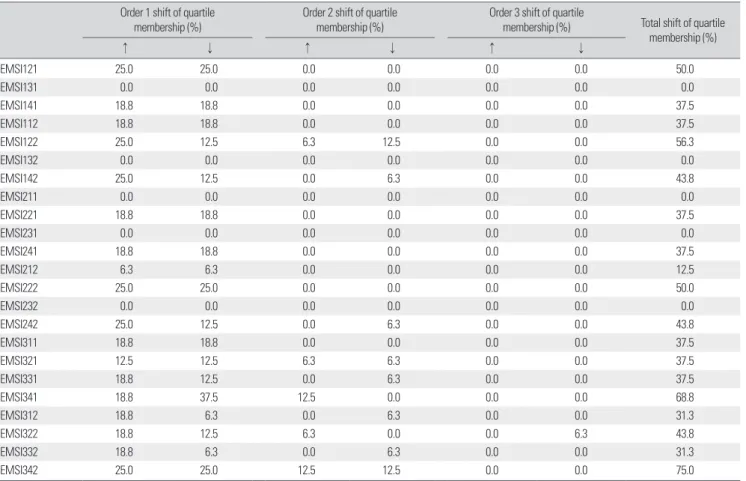
Sensitivity of ranks due to different construction rules was as- sessed based on the total shift of the quartile membership. The re- gions were classified into quartiles, and thus ranking variations that provoked a shift from one quartile to another were reported [19]. In addition, the influence of each component of the construc- tion method was assessed by total change in the 5th to 95th percen- tile intervals of the EMSI ranks when any one method (e.g., stan- dardization or equal weights) was excluded from the EMSI con- struction methodology. The analysis was undertaken in SimLab ver. 2.2.1 (Joint Research Centre of the European Commission, Brssels, Belgium), SAS ver. 9.1 (SAS Institute Inc., Cary, NC, USA), SPSS ver. 12.0 (SPSS Inc., Chicago, IL, USA), and Microsoft Excel 2003.
RESULTS
1. Discrimination Performance
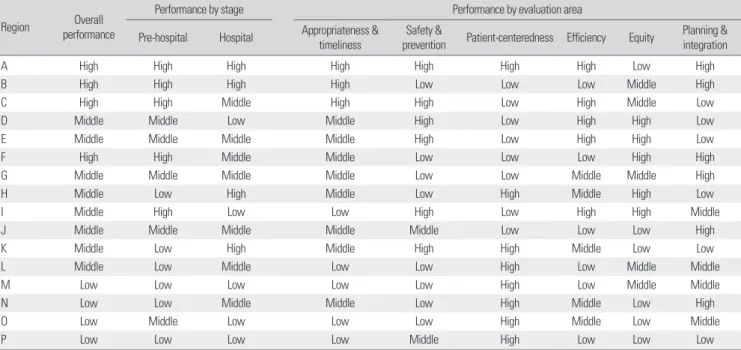
Four high performers and four low performers were detected among the 16 regions and thus the total discrimination perfor- mance of the overall EMSI was 50.0%. For the EMSI based on the stages of the EMS system, the total discrimination performance of the pre-hospital stage EMSI was 68.8% and that of the hospital stage EMSI was 56.3%. For the EMSI based on the evaluation ar- eas, the total discrimination performance was 50.0% for the ap- propriateness and timeliness area, 87.5% for the safety and preven- tion area, 100.0% in the patient-centeredness area, 68.8% in both the efficiency and equity areas, and 75.0% in the planning and in- tegration area (Figure 2).
∑
∏
Figure 1. Alternative EMSIs. AUC, area under the receiver operating characteristic curve; EMSI, Emergency Medical Services Index.
Normalization method
1: Standardization 1: Equal
1: Linear 2: Geometric
Normalization method code Weighting scheme code Aggregation system code 2: Delphi
3: Factor analysis 4: AUC 2: Rescaling
3: Ranking
24 Alternative
EMSIs possible EMSI i j k Weighting
scheme Aggregation
system
2. Construct Validity
Spearman’s rank correlation coefficients among the alternative EMSIs ranged from 0.309 to 0.997. Correlation coefficients be- tween EMSIs using standardized values and those using rescaled values ranged from 0.621 to 0.997. However, correlation coeffi- cients between EMSIs using ranked values and those using stan- dardized or rescaled values were of relatively lower levels that ranged from 0.309 to 0.879 (Table 4).
3. Sensitivity
The EMSI111 rank was used as reference value for each region.
Variation of the quartile membership of regions ranged from 0.0%
to 75.0% such that the placements of the regions did not remain in the same quartile with the EMSI111 reference rank. For EMSI us- ing standardized (EMSI1jk) and rescaled values (EMSI2jk), total shift in quartile membership ranged from 0.0% to 56.3% and from 0.0% to 50.0%, respectively. However, in the case of the EMSI us-
ing ranked values (EMSI3jk), percentages of the quartile member- ship shift were relatively higher (range, 31.3% to 75.0%) than for the other EMSIs. Additionally, the order of two or more shifts in the quartile membership was higher in EMSI3jk than in EMSI1jk or EMSI2jk (Table 5).
The total change in the 5th to 95th percentile intervals ranged from -19 to +17 places and when the ranked values were excluded from the uncertainty analysis, the uncertainty interval exhibited the greatest reduction (-18 places). When either the expert weights or the geometric aggregation was removed from the analysis, the uncertainty interval was reduced by one place or five places, re- spectively (Table 6).
DISCUSSION
We evaluated the performance of the EMS systems of 16 regions in Korea based on terms of discrimination, construct validity, and Figure 2. Results of uncertainty analysis on Emergency Medical Services Index (EMSI) ranks. The median (■) and the corresponding 5th and 95th percentiles (bounds) of the EMSIs for 16 regions.
Table 4. Correlation of alternative EMSIs EMSI111EMSI121EMSI131EMSI141EMSI112EMSI122EMSI132EMSI142EMSI211EMSI221EMSI231EMSI241EMSI212EMSI222EMSI232EMSI242EMSI311EMSI321EMSI331EMSI341EMSI312EMSI322EMSI332EMSI342 EMSI1111.0000.909†0.976†0.909†0.894†0.726†0.974†0.782†0.991†0.871†0.968†0.865†0.979†0.832†0.979†0.806†0.873†0.812†0.853†0.747†0.776†0.712†0.812†0.524* EMSI1210.909†1.0000.879†0.824†0.912†0.891†0.909†0.759†0.921†0.968†0.874†0.806†0.929†0.974†0.876†0.756†0.735†0.724†0.703†0.553*0.612*0.653†0.656†0.382 EMSI1310.976†0.879†1.0000.874†0.879†0.735†0.982†0.774†0.976†0.865†0.997†0.844†0.968†0.821†0.997†0.776†0.837†0.776†0.871†0.697†0.756†0.679†0.812†0.476 EMSI1410.909†0.824†0.874†1.0000.874†0.621*0.874†0.906†0.912†0.797†0.856†0.982†0.900†0.738†0.876†0.944†0.879†0.815†0.765†0.829†0.785†0.712†0.768†0.697† EMSI1120.894†0.912†0.879†0.874†1.0000.859†0.915†0.912†0.926†0.897†0.871†0.888†0.950†0.879†0.876†0.882†0.754†0.741†0.724†0.621*0.741†0.685†0.729†0.585* EMSI1220.726†0.891†0.735†0.621*0.859†1.0000.774†0.685†0.768†0.909†0.744†0.659†0.806†0.953†0.732†0.638†0.515*0.603*0.565*0.3090.532*0.618*0.553*0.312 EMSI1320.974†0.909†0.982†0.874†0.915†0.774†1.0000.809†0.982†0.874†0.976†0.847†0.974†0.850†0.979†0.806†0.844†0.803†0.865†0.709†0.785†0.709†0.829†0.518* EMSI1420.782†0.759†0.774†0.906†0.912†0.685†0.809†1.0000.821†0.768†0.756†0.944†0.835†0.715†0.768†0.979†0.742†0.712†0.647†0.703†0.756†0.641†0.712†0.747† EMSI2110.991†0.921†0.976†0.912†0.926†0.768†0.982†0.821†1.0000.894†0.971†0.888†0.994†0.862†0.979†0.829†0.873†0.824†0.865†0.747†0.785†0.732†0.821†0.547* EMSI2210.871†0.968†0.865†0.797†0.897†0.909†0.874†0.768†0.894†1.0000.868†0.806†0.918†0.974†0.862†0.756†0.649†0.641†0.647†0.4710.532*0.574*0.574*0.321 EMSI2310.968†0.874†0.997†0.856†0.871†0.744†0.976†0.756†0.971†0.868†1.0000.829†0.962†0.824†0.994†0.756†0.816†0.765†0.865†0.674†0.741†0.671†0.797†0.447 EMSI2410.865†0.806†0.844†0.982†0.888†0.659†0.847†0.944†0.888†0.806†0.829†1.0000.888†0.747†0.847†0.962†0.837†0.788†0.729†0.791†0.765†0.706†0.744†0.721† EMSI2120.979†0.929†0.968†0.900†0.950†0.806†0.974†0.835†0.994†0.918†0.962†0.888†1.0000.882†0.971†0.835†0.835†0.788†0.832†0.700†0.756†0.706†0.785†0.532* EMSI2220.832†0.974†0.821†0.738†0.879†0.953†0.850†0.715†0.862†0.974†0.824†0.747†0.882†1.0000.818†0.697†0.649†0.685†0.665†0.4530.562*0.650†0.606*0.326 EMSI2320.979†0.876†0.997†0.876†0.876†0.732†0.979†0.768†0.979†0.862†0.994†0.847†0.971†0.818†1.0000.779†0.848†0.779†0.879†0.718†0.759†0.682†0.815†0.497 EMSI2420.806†0.756†0.776†0.944†0.882†0.638†0.806†0.979†0.829†0.756†0.756†0.962†0.835†0.697†0.779†1.0000.779†0.729†0.671†0.771†0.776†0.644†0.721†0.788† EMSI3110.873†0.735†0.837†0.879†0.754†0.515*0.844†0.742†0.873†0.649†0.816†0.837†0.835†0.649†0.848†0.779†1.0000.931†0.923†0.940†0.872†0.844†0.919†0.719† EMSI3210.812†0.724†0.776†0.815†0.741†0.603*0.803†0.712†0.824†0.641†0.765†0.788†0.788†0.685†0.779†0.729†0.931†1.0000.879†0.824†0.909†0.974†0.932†0.659† EMSI3310.853†0.703†0.871†0.765†0.724†0.565*0.865†0.647†0.865†0.647†0.865†0.729†0.832†0.665†0.879†0.671†0.923†0.879†1.0000.844†0.874†0.812†0.938†0.621* EMSI3410.747†0.553*0.697†0.829†0.621*0.3090.709†0.703†0.747†0.4710.674†0.791†0.700†0.4530.718†0.771†0.940†0.824†0.844†1.0000.847†0.724†0.847†0.844† EMSI3120.776†0.612*0.756†0.785†0.741†0.532*0.785†0.756†0.785†0.532*0.741†0.765†0.756†0.562†0.759†0.776†0.872†0.909†0.874†0.847†1.0000.885†0.965†0.824† EMSI3220.712†0.653†0.679†0.712†0.685†0.618*0.709†0.641†0.732†0.574*0.671†0.706†0.706†0.650†0.682†0.644†0.844†0.974†0.812†0.724†0.885†1.0000.897†0.635† EMSI3320.812†0.656†0.812†0.768†0.729†0.5530.829†0.712†0.821†0.574*0.797†0.744†0.785†0.606*0.815†0.721†0.919†0.932†0.938†0.847†0.965†0.897†1.0000.735† EMSI3420.524*0.3820.4760.697†0.585*0.3120.518*0.747†0.547*0.3210.4470.721†0.532*0.3260.4970.788†0.719†0.659†0.621*0.844†0.824†0.635†0.735†1.000 Spearman’s rank correlation coefficients. Correlation coefficients in boldface are not good correlation (<0.6).
EMSI, Emergency Medical Services Index. *p†<0.05. p<0.01.
sensitivity. With regard to uncertainty of the EMSI rankings, the Monte Carlo simulation showed that the 5th to 95th percentile in- tervals of the EMSI ranks ranged from 1 to 10 places and exhibited 5 places or more in 11 of the regions. Regions D and E were not in- cluded in the high performer group although their medians were at a better level than that of region F. Such an uncertainty of the EMSI rank order suggested that using only the median rank of a
region for reporting the performance of the regional EMS system is not appropriate. When uncertainty intervals around the EMSI ranks are estimated by repeated simulations, considerable overlap can exist among the distribution of EMSI ranks [15]. Therefore, in this study, the performance of the regional EMS system was pre- sented as the “better or worse than the median” rank across re- gions. However, other cutoff criteria might be considered such as Table 5. Sensitivity of ranks due to different computation rules compared to EMSI111
Order 1 shift of quartile
membership (%) Order 2 shift of quartile
membership (%) Order 3 shift of quartile
membership (%) Total shift of quartile membership (%)
↑ ↓ ↑ ↓ ↑ ↓
EMSI121 25.0 25.0 0.0 0.0 0.0 0.0 50.0
EMSI131 0.0 0.0 0.0 0.0 0.0 0.0 0.0
EMSI141 18.8 18.8 0.0 0.0 0.0 0.0 37.5
EMSI112 18.8 18.8 0.0 0.0 0.0 0.0 37.5
EMSI122 25.0 12.5 6.3 12.5 0.0 0.0 56.3
EMSI132 0.0 0.0 0.0 0.0 0.0 0.0 0.0
EMSI142 25.0 12.5 0.0 6.3 0.0 0.0 43.8
EMSI211 0.0 0.0 0.0 0.0 0.0 0.0 0.0
EMSI221 18.8 18.8 0.0 0.0 0.0 0.0 37.5
EMSI231 0.0 0.0 0.0 0.0 0.0 0.0 0.0
EMSI241 18.8 18.8 0.0 0.0 0.0 0.0 37.5
EMSI212 6.3 6.3 0.0 0.0 0.0 0.0 12.5
EMSI222 25.0 25.0 0.0 0.0 0.0 0.0 50.0
EMSI232 0.0 0.0 0.0 0.0 0.0 0.0 0.0
EMSI242 25.0 12.5 0.0 6.3 0.0 0.0 43.8
EMSI311 18.8 18.8 0.0 0.0 0.0 0.0 37.5
EMSI321 12.5 12.5 6.3 6.3 0.0 0.0 37.5
EMSI331 18.8 12.5 0.0 6.3 0.0 0.0 37.5
EMSI341 18.8 37.5 12.5 0.0 0.0 0.0 68.8
EMSI312 18.8 6.3 0.0 6.3 0.0 0.0 31.3
EMSI322 18.8 12.5 6.3 0.0 0.0 6.3 43.8
EMSI332 18.8 6.3 0.0 6.3 0.0 0.0 31.3
EMSI342 25.0 25.0 12.5 12.5 0.0 0.0 75.0
EMSI, Emergency Medical Services Index.
Table 6. Change in the 5th–95th percentile intervals after excluding any one method from the Emergency Medical Services Index construction methodology
Excluded method Change in the 5th-95th percentile intervals by region Total change in the 5th-
95th percentile interval
A B C D E F G H I J K L M N O P
Standardization 0 -1 +1 +3 +1 0 +1 +2 0 +1 0 0 +2 +1 0 0 +11
Rescaling 0 0 +1 +3 +2 0 +1 +1 +3 +2 0 0 +2 0 0 +1 +16
Ranking 0 -3 -3 -2 -2 0 0 -2 +3 +1 -3 -3 0 +1 -6 +1 -18
Equal weights 0 0 +1 +3 +2 0 +1 +2 +2 +2 0 0 +2 +1 0 +1 +17
Expert weights 0 0 -2 0 -2 0 +1 0 +3 -3 -2 0 +2 +1 0 +1 -1
Weights by factor analysis -1 0 -1 +3 +1 -1 -1 +2 +3 +2 0 0 +2 +1 0 +1 +11
Weights by AUC 0 0 +1 +3 +2 0 -1 +1 0 -1 0 0 0 0 -3 0 +2
Linear aggregation 0 0 0 +3 +2 0 -1 0 +2 +2 0 -3 +2 0 0 +1 +8
Geometric aggregation 0 -1 0 0 0 0 0 +1 0 -1 0 -3 -2 +1 0 0 -5
AUC, area under the receiver operating characteristic curve.
Table 7. Quality differences in the regional EMS systems
Region Overall
performance
Performance by stage Performance by evaluation area
Pre-hospital Hospital Appropriateness &
timeliness Safety &
prevention Patient-centeredness Efficiency Equity Planning &
integration
A High High High High High High High Low High
B High High High High Low Low Low Middle High
C High High Middle High High Low High Middle Low
D Middle Middle Low Middle High Low High High Low
E Middle Middle Middle Middle High Low High High Low
F High High Middle Middle Low Low Low High High
G Middle Middle Middle Middle Low Low Middle Middle High
H Middle Low High Middle Low High Middle High Low
I Middle High Low Low High Low High High Middle
J Middle Middle Middle Middle Middle Low Low Low High
K Middle Low High Middle High High Middle Low Low
L Middle Low Middle Low Low High Low Middle Middle
M Low Low Low Low Low High Low Middle Middle
N Low Low Middle Middle Low High Middle Low High
O Low Middle Low Low Low High Middle Low Middle
P Low Low Low Low Middle High Low Low Low
EMS, emergency medical services; High, high performer; Middle, middle performer; Low, low performer.
grouping by regions of which the uncertainty intervals overlap with each other.
Discrimination performance of the overall EMSI was 50.0%
and those of the stage and evaluation area EMSI ranged from 56.3% to 68.8% and from 50.0% to 100.0%, respectively. For con- struct validity, correlation between the EMSIs using standardized and rescaled values was strong (Spearman’s rho= 0.621-0.997).
For the cases including the patient safety indicators (PSIs) and in- patient quality indicators (IQIs), the composite measure developed by the Agency for Healthcare Research and Quality (AHRQ), the discrimination performance of PSIs ranged from 11.6% to 40.9%;
that of IQIs ranged from 2.9% to 14.1% for selected procedures and from 6.7% to 29.7% for selected conditions. Correlation coeffi- cients of PSIs ranged from 0.517 to 0.962; those of IQIs ranged from 0.159 to 0.846 for selected procedures and from 0.559 to 0.999 for selected conditions [16,17]. As above, these results suggest that discrimination performance and construct validity of the EMSI were reasonable.
Total shift in the quartile membership was less than 60% with the exception of EMSI34k. The stability of EMSI rankings was better than some other composite measures developed for evaluat- ing the quality of life in Italy [19], but the variations in the EMSI rankings were considerable. When excluding the ranked values, expert weights, or geometric aggregation, the total change in the 5th to 95th percentile intervals decreased, although rank variation
decreased only slightly with regard to expert weights and geomet- ric aggregation. However, excluding the latter two methods from the construction methodology for the EMSI might not be appro- priate because expert weights typically reflect the directions of EMS policies and improve the legitimacy of the overall perfor- mance evaluation. Moreover, geometric aggregation can be a solu- tion for full compensability of additive aggregation: “poor perfor- mance in some indicators can be compensated by sufficiently high values of other indicators” [8,9]. Among the normalization meth- ods, normalization by ranking had the greatest effect on reducing the rank variations and exhibited the lowest construct validity.
Ranking was not affected by outliers, but lost information on ab- solute levels such that no conclusion could be drawn about differ- ences in performance [8,9]. Accordingly, using ranked values in constructing the EMSI may not be appropriate. The 5th to 95th percentile intervals of the EMSI ranks was most increased when re-scaling, equal weights, and linear aggregation methods were excluded. This yielding method could be used a representative technique for constructing EMSI because it can minimize the un- certainty of regional EMSI ranks through constructing EMSI us- ing various methods. However, it could not be the absolute golden standard for constructing EMSI. Therefore, it will be an ideal pro- cess that all stakeholders participate in the process of constructing EMSI and make consensus regarding yielding method.
Using the results of discrimination performance, the quality
differences in the regional EMS systems are summarized in Table 7. The overall high performer group of regions A, B, C, and F showed by and large, better performance at the pre-hospital and hospital stages than either the middle or low performer group.
This overall performance result was similar to the performance result for the appropriateness and timeliness area, probably be- cause this area was regarded as more important than other areas to EMSI developers, with more indicators consequently being in- cluded. EMSI developed by MOHW equally weighted each indi- vidual indicator and weighted differently among evaluation fields:
appropriateness and timeliness area (40%); safety and prevention area (10%); patient-centeredness area (10%); efficiency (10%); equi- ty area (10%); and planning and integration area (20%) [7]. That is, the field of appropriateness and timeliness is being considered as more important policy priority in EMS.
The performance at the planning and integration area, however, was not consistent with the overall performance because of little variation in performance for this area. Yet, the absolute values of indicators in this area were very poor except for completeness of the National Emergency Department Information System’s data.
This suggests that the absolute values of indicators should be con- sidered in addition to the relative differences among the regions when evaluating the performance of regional EMS systems.
The EMSI has an inherent limitation, namely, a lack of data for measuring the quality indicators of the EMSI. The lack of relevant data is the greatest problem when constructing a composite indi- cator [20] and the major barrier to quality improvement of the EMS system [2,21,22]. Here, for developing the EMSI, nine differ- ent indicators (e.g., preventable trauma death rate) were not in- cluded among the final indicators of the EMSI simply because no data were available. In Korea the development of information sys- tems for the evaluation of EMS systems are now in progress and should contribute to the construction of more stable and valid EMSIs for the quality improvement of EMS systems in the future.
This is the first study to investigate the performance of compos- ite indicators for evaluating EMS systems. We presented the meth- odology for evaluating the performance of composite indicators and reported the results of this performance. Our findings should be useful to establish policies for the quality improvement of EMS systems as well as to support and promote the accountability of the regional governments for managing their EMS systems both fi- nancially and technically.
ACKNOWLEDGMENTS
This study was funded by the Ministry of Health and Welfare (announcement 192). The views expressed in the article are those of the authors and do not represent the views of the funding body.
REFERENCES
1. Holroyd BR, Nabors MD. Changing the system. In: Polsky SS; American College of Emergency Physicians, editors. Continuous quality improve- ment in EMS. Dallas (TX): American College of Emergency Physicians;
1992. p. 248-250
2. Institute of Medicine; Committee on the Future of Emergency Care in the United States Health System. Emergency medical services at the crossroads. Washington (DC): National Academies Press; 2006.
3. American College of Emergency Physicians. The national report card on the state of emergency medicine [Internet]. Dallas (TX): American Col- lege of Emergency Physicians; 2006 [cited 2006 May 8].
4. Becher JW Jr. The national report card on the state of emergency medi- cine. J Am Osteopath Assoc 2006;106(5):254-255.
5. Kang CH, Kim Y, Lee PS, Kwon YD, Kim CY, Shin YS. Performance evaluation of emergency medical center. Korean J Prev Med 1997;30(4):
884-892.
6. Im JS, Lee G, Kang KH, Nah BJ, Im YS, Seo HJ, et al. Status of and plans for emergency medical services in rural regions. Seoul: National Emer- gency Medical Center, Gachon University of Medicine and Science; 2007.
7. Kim Y, Jung KY, Kim H, Shin SD, Lee JS. Study on the development of the Emergency Medical Services Index and evaluation methodology.
Seoul: Ministry of Health and Welfare; 2006.
8. Nardo M, Saisana M, Saltelli A, Tarantola S. Tools for composite indica- tors building. Ispra: European Commission, Joint Research Centre; 2005.
9. Nardo M, Saisana M, Saltelli A, Tarantola S, Hoffman A. Handbook on constructing composite indicators: methodology and user guide. Paris:
Organization for Economic Cooperation and Development Publishing;
2005.
10. Saisana M, Saltelli A, Tarantola S. Uncertainty and sensitivity analysis techniques as tools for the quality assessment of composite indicators. J R Stat Soc Series A 2005;168(2):307-323.
11. McGlynn EA, Asch SM. Developing a clinical performance measure. Am J Prev Med 1998;14(3 Suppl):14-21.
12. Reeves D, Campbell SM, Adams J, Shekelle PG, Kontopantelis E, Roland MO. Combining multiple indicators of clinical quality: an evaluation of different analytic approaches. Med Care 2007;45(6):489-496.
13. Cherchye L, Moesen W, Rogge N, Van Puyenbroeck T. An introduction to ‘benefit of the doubt’ composite indicators. Soc Indic Res 2007;82(1):
111-145.
14. Mononen E. Uncertainty and sensitivity analysis on technology barome- ter composite indicator [Internet]. Helsinki: Helsinki University of Tech- nology; 2007 [cited 2007 May 14].
15. Jacobs R, Goddard M, Smith PC. How robust are hospital ranks based on composite performance measures? Med Care 2005;43(12):1177-1184.
16. Agency for Healthcare Research and Quality. AHRQ quality indicators:
patient safety indicators (PSI) composite measure draft technical report [Internet]. Rockville (MD): Agency for Healthcare Research and Quality;
2006 [cited 2007 Aug 28].
17. Agency for Healthcare Research and Quality. AHRQ quality indicators:
inpatient quality indicators (IQI) composite measure draft technical re- port [Internet]. Rockville (MD): Agency for Healthcare Research and Quality; 2006 [cited 2007 Aug 28].
18. Daley J, Ash AS, Iezzoni LI. Validity and reliability of risk adjusters. In:
Iezzoni LI, editor. Risk adjustment for measuring health care outcomes.
3rd ed. Chicago: Health Administration Press; 2003. p. 207-215.
19. Lun G, Holzer D, Tappeiner G, Tappeiner U. The stability of rankings de- rived from composite indicators: analysis of the “Il Sole 24 Ore” quality of life report. Soc Indic Res 2006;77(2):307-331.
20. Freudenberg M. Composite indicators of country performance: a critical assessment. OECD Science, Technology and Industry Working Papers 2003/16 [Internet]. Paris: Organization for Economic Cooperation and Development Publishing; 2003 [cited 2007 Aug 27].
21. Graff L, Stevens C, Spaite D, Foody J. Measuring and improving quality in emergency medicine. Acad Emerg Med 2002;9(11):1091-1107.
22. Kizer KW. The emerging imperative for health care quality improvement.
Acad Emerg Med 2002;9(11):1078-1084.
Appendix 1. Weighting method by Delphi survey
The Delphi panel was composed of 10 members recommended by the Korean Society of Emergency Medicine, 5 consumer group representatives, 14 civil servants from the regional government, the Ministry of Health and Welfare, the National Emergency Medical Center, and the National Emergency Management Agen- cy. Panel members independently answered two main questions with 9 point Likert scale: 1) whether individual indicator can ap- propriately evaluate regional emergency medical services (EMS) quality and 2) whether improvement of indicator means enhance- ment of regional EMS status (Figure 3). Also, weights of each eval- uation field were measured.
The survey was performed from November, 2006 to January, 2007 with 2 rounds. The results of 1st round were presented ac- cording to each indicator during the 2nd round survey. The re- sponse rates of individual question were distributed between 85.2% and 88.9%. Weighting by Delphi method was calculated by multiplying an average score of importance of an indicator by a score of relative importance among the six evaluation areas that resulted from two rounds of the Delphi survey.
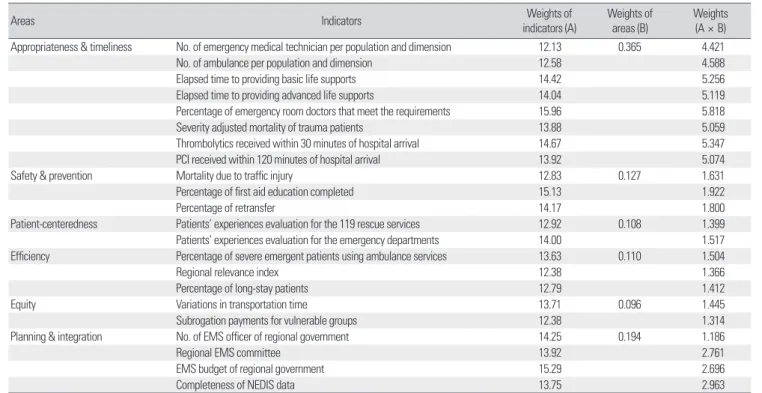
The results of Delphi shows that the weights of individual indica- tor (A) ranged between 12.13 and 15.96; and the weights of evalua- tion fields (B) distributed between 0.096 and 0.365. Weights by
Figure 3. Example of questionnaire for Delphi survey.
Table 8. Weights of indicators by Delphi method
Areas Indicators Weights of
indicators (A) Weights of
areas (B) Weights (A × B) Appropriateness & timeliness No. of emergency medical technician per population and dimension 12.13 0.365 4.421
No. of ambulance per population and dimension 12.58 4.588
Elapsed time to providing basic life supports 14.42 5.256
Elapsed time to providing advanced life supports 14.04 5.119
Percentage of emergency room doctors that meet the requirements 15.96 5.818
Severity adjusted mortality of trauma patients 13.88 5.059
Thrombolytics received within 30 minutes of hospital arrival 14.67 5.347
PCI received within 120 minutes of hospital arrival 13.92 5.074
Safety & prevention Mortality due to traffic injury 12.83 0.127 1.631
Percentage of first aid education completed 15.13 1.922
Percentage of retransfer 14.17 1.800
Patient-centeredness Patients’ experiences evaluation for the 119 rescue services 12.92 0.108 1.399
Patients’ experiences evaluation for the emergency departments 14.00 1.517
Efficiency Percentage of severe emergent patients using ambulance services 13.63 0.110 1.504
Regional relevance index 12.38 1.366
Percentage of long-stay patients 12.79 1.412
Equity Variations in transportation time 13.71 0.096 1.445
Subrogation payments for vulnerable groups 12.38 1.314
Planning & integration No. of EMS officer of regional government 14.25 0.194 1.186
Regional EMS committee 13.92 2.761
EMS budget of regional government 15.29 2.696
Completeness of NEDIS data 13.75 2.963
PCI, percutaneous coronary intervention; EMS, emergency medical services; NEDIS, National Emergency Department Information System.
Delphi method were 1.186 to 5.818 calculated by multiplying (A) and (B) (Table 8).