Introduction
Eleutherococcus senticosus, commonly known as “Siberian ginseng,” is distributed widely in northeast Asia, including in China, Japan, and Korea, where its shoots and roots have been used as traditional medicine. Various studies have searched for bioactive substances in this crop. Davydov and Krikorian (2000) reported on the use of E. senticosus as an adaptogen to relieve stress and fatigue. A crude E. senticosus extract has also been found to contain diverse bioactive compounds, such as phenolic compounds, polysaccharides, and lignans (Fang et al., 1985; Lee et al., 2004; Nishibe et al., 1990).
Molecular evaluation tools can provide information on genetic variation and population structure, which can then be applied to sustainable conservation and use strategies.
However, such tools are currently lacking for E. senticosus.
Therefore, it is necessary to identify polymorphisms at the molecular level in E. senticosus. Simple sequence repeats (SSRs, or microsatellites) are an effective molecular marker system by which to understand the genetic variation of germplasm with co-dominant, reproducible, polymorphic, and easily detectable characteristics (Ishii and McCouch, 2001). To use SSR markers in genetic studies, sequence information from regions flanking the SSR region is needed to design primer pairs. While extensive databases exist for many crops, the amount of useful data has been limited in E.
senticosus.
In a survey of the Web of Science (Institute of Scientific Information, Thomson Scientific) using the keywords
‘Eleutherococcus senticosus’ and ‘microsatellite,’ we found only one study (Kim and Chung, 2007) that isolated 239 new microsatellite-containing sequences. In this study, the distribution and variation in size of microsatellites within the DNA sequence of the E. senticosus genome were characterized.
Our goal was to develop new SSR markers to assess genetic
Development of Microsatellite Markers and their Use in Genetic Diversity and Population Analysis in Eleutherococcus senticosus
Kyung Jun Lee
1, Yong-Jin An
2, Jin-Kwan Ham
2, Kyung-Ho Ma
1, Jung-Ro Lee
1, Yang-Hee Cho
1and Gi-An Lee
1*
1
National Agrobiodiversity Center, National Institute of Agricultural Sciences, RDA, Jeonju-Si 54874, Korea
2
Ginseng & Medicinal Herb Experiment Station, Chuncheon-si 24226, Korea
Abstract - Eleutherococcus senticosus (Siberian ginseng) is an important medicinal tree found in northeast Asia. In this study, we analyzed the genome-wide distribution of microsatellites in E. senticosus. By sequencing 711 clones from an SSR-enriched genomic DNA library, we obtained 12 polymorphic SSR markers, which also revealed successful amplicons in E. senticosus accessions. Using the developed SSR markers, we estimated genetic diversity and population structure among 131 E. senticosus accessions in Korea and China. The number of alleles ranged from 2 to 11, with an average of 7.4 alleles. The mean values of observed heterozygosity (H
O) and expected heterozygosity (H
E) were 0.59 and 0.56, respectively. The average polymorphism information content (PIC) was 0.51 in all 131 E. senticosus accessions. E.
senticosus accessions in Korea and China showed a close genetic similarity. Significantly low pairwise genetic divergence was observed between the two regions, suggesting a relatively narrow level of genetic basis among E. senticosus accessions.
Our results not only provide molecular tools for genetic studies in E. senticosus but are also helpful for conservation and E.
senticosus breeding programs.
Key words - Eleutherococcus senticosus, Genetic diversity, Population structure, SSR
*Corresponding author. E-mail : [email protected] Tel. +82-63-238-4873
ⓒ 2017 by The Plant Resources Society of Korea
Original Research Article
relationships among E. senticosus accessions in Korea and China. Our study not only provides a means of understanding the genetic relatedness and structure of E. senticosus accessions, but is also helpful for E. senticosus breeding and germplasm conservation.
Materials and Methods
Plant materials
The 131 E. senticosus accessions used in this study were obtained from the Korea Genebank Rural Development Administration. Of the 131 accessions, 97 were from Korea and 34 were from China. Leaf samples were randomly collected from the field. Genomic DNA was extracted from leaves using the modified CTAB method, and the final DNA concentration was adjusted to 20 ng/㎕ with a NanoDrop ND-1000 spectrometer (Wilmington, DE, USA).
Construction of an SSR motif-enriched library
A microsatellite-motif enrichment library was constructed using the modified biotin-streptavidin capture method with genomic DNA from E. senticosus (Ma et al., 2009). Briefly, genomic DNA was digested using six restriction enzymes, AluI, DraI, HaeIII, RsaI, EcoRV, and NruI. The digested DNA was size-fractionated on a 1.2% agarose gel and the fragments ranging from 300 bp to 1,500 bp were eluted from the gel. After adaptor ligation and PCR amplification, the DNA fragments were hybridized with a mixture of the following biotin-labeled SSR probes: (GA)
20, (CA)
20, (AT)
20, (GC)
20, (AGC)
15, (GGC)
15, (AAG)
15, (AAC)
15, and (AGG)
15. The hybridized DNA fragments were captured with streptavidin- coated magnetic beads (Promega, Madison, WI, USA) and were cloned into the pGEM-T Easy vector (Promega). In total, 711 white colonies were randomly picked and sequenced in an ABI 3100 DNA sequencer (Applied Biosystems, Foster City, CA, USA), and SSR MANAGER was used to find SSR motifs and design primer pairs (Kim, 2004).
PCR amplification
The “M13 tail at its 5’ end” PCR method was used to measure the size of the PCR products (Schuelke, 2000). PCR amplification was carried out in a total volume of 20 ㎕
containing 2 ㎕ of genomic DNA (10 ng/㎕), 0.2 ㎕ of the specific primer (10 pmol/㎕), 0.4 ㎕ of M13 universal primer (10 pmol/ ㎕), 0.6 µl of normal reverse primer, 2.0 ㎕ of 10×
PCR buffer (Takara, Tokyo, Japan), 1.6 ㎕ of dNTPs (2.5 mM), and 0.2 ㎕ of Taq polymerase (5 unit/㎕; Takara). The conditions used for the PCR amplification were as follows:
94 ℃ (3 min), followed by 30–33 cycles at 94℃ (30 s), 50–5 5 ℃ (45 s), and 72℃ (45 s), then 15 cycles at 94℃ (30 s), 5 3℃ (45 s), and 72℃ (45 s), and a final extension at 72℃ for 20 min. PCR was carried out in PTC-220 thermocyclers (MJ Research, Waltham, MA, USA). The PCR products of three microsatellites were mixed together in a ratio of 6-FAM:
HEX:NED (fluorescent dyes) = 1:3:4, which was varied depending on the amplification intensity of the individual markers as determined on an ABI PRISM 3130xl Genetic Analyzer (Applied Biosystems). PCR products labeled with HEX and NED were added in higher amounts and those labeled with FAM were added in lower amounts because of the different signal intensities of the three fluorescent dyes.
The mixed PCR product (1.5 ㎕) was combined with 9.2 ㎕ of Hi-Di formamide and 0.3 ㎕ of an internal size standard, Genescan-500 ROX (6-carbon-X-rhodamine) as a molecular size standard (35–500 bp). The samples were denatured at 9 4 ℃ for 3 min and analyzed with an ABI PRISM 3130xl Genetic Analyzer (Applied Biosystems). The molecular weights, in base pairs, of the microsatellite products were estimated with Genescan software ver. 3.7 (Applied Bio- systems) using the local Southern method. Individual fragments were assigned as alleles of the appropriate microsatellite loci with Genotyper software ver. 3.7 (Applied Biosystems).
Analysis of genetic diversity
The total number of alleles, allele frequency, genetic
diversity, and polymorphism information content (PIC) per
individual SSR locus were calculated with PowerMarker
version 3.25 (Liu and Muse, 2005). An unweighted pair
group method with an arithmetic mean (UPGMA) dendrogram
was constructed to visualize the phylogenetic distribution of
accessions using MEGA version 5.03 software (Tamura et
al., 2007). Principal co-ordinate analysis (PCoA) in GenAlEx
6.5 was used to further examine the genetic relationships
among the detected populations on the basis of the SSR data
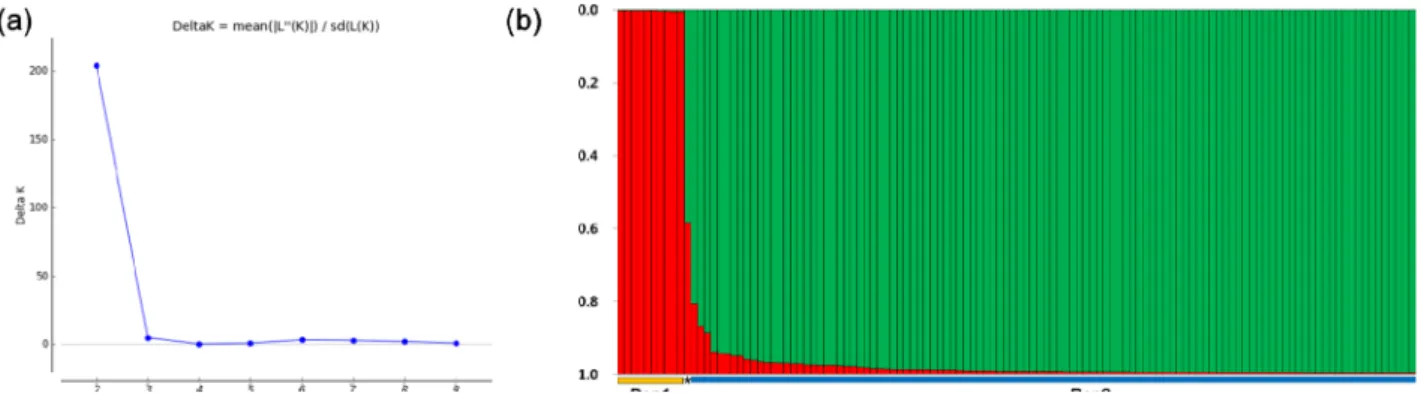
(Peakall and Smouse, 2012). STRUCTURE software (v 2.3.4) was used to detect possible subpopulations (K=1 to K=10) with a model allowing for admixture and correlated allele frequencies using a burn-in period of 50,000 and MCMC repeats of 50,000 followed by three iterations (Pritchard et al., 2000). The optimal number of populations corresponded to the highest peak in the ΔK graph and accessions with membership probabilities ≥ 70% were assigned to sub- populations (Evanno et al., 2005).
Results
Simple sequence repeats in the E. senticosus genome A total of 711 clones from an SSR-enriched genomic DNA library were sequenced, of which 47 clones (6.6%) were redundant. Of the 664 independent clones, 470 (70.8%) revealed
SSR motifs (Table 1). Di-nucleotide repeats (DNRs) were the most abundant, accounting for 64% of all SSRs (Table 1).
Tri-nucleotide repeats (TNRs), penta-nucleotide repeats (PNRs), and hexa-nucleotide repeats (HNRs) accounted for 35.3, 0.2, and 0.4% of all SSRs, respectively. Among the DNRs, TG/GT was the most abundant (39.2%), followed by AC/CA (25.9%) and AG/GA (20.6%). In contrast, AT/TA repeats were rather rare, only accounting for 2.7% of all DNRs. Of the TNRs, CAA/ACA/AAC was the most abundant (62.7%), followed by TTG/TGT/GTT (18.7%) and GAA/AGA/AAG (7.2%). GGGGA and GCACC and GGCGGA were the most abundant PNRs and HNRs, respectively. In addition, TG/GT was the most predominant motif overall, accounting for 25.1% of all SSRs.
Validation and polymorphism assessment of SSRs For the 470 unique SSR clones, we designed 190 primer pairs flanking SSR motifs; the others were incompatible with the primer design process. We finally acquired 12 polymorphic SSR markers in diverse E. senticosus accessions. The number of alleles for each SSR ranged from 2 to 13, with an average of 7.4 alleles per SSR (Table 2). To measure the infor- mativeness of these markers, the polymorphism information content (PIC) for each SSR locus was calculated. The PIC values varied from 0.22 to 0.77, with an average of 0.51 (Table 2). Based on the PIC value, GB-ES-146, GB-ES-175, and GB-ES-109 were the most informative, with values of 0.77, 0.75, and 0.73, respectively. The average number of effective alleles per SSR ranged from 1.29 to 5.03, with a mean of 2.77 alleles per SSR. The Shannon index ranged from 0.51 to 1.83, with an average of 1.14. The expected heterozygosity ranged from 0.23 for GB-ES-148 to 0.80 for GB-ES-146, with an average of 0.56. The observed hetero- zygosity varied from 0.15 for GB-ES-080 to 0.87 for GB-ES- 146, with a mean of 0.59.
Genetic structure and subdivision of E. senticosus between Korean and Chinese accessions
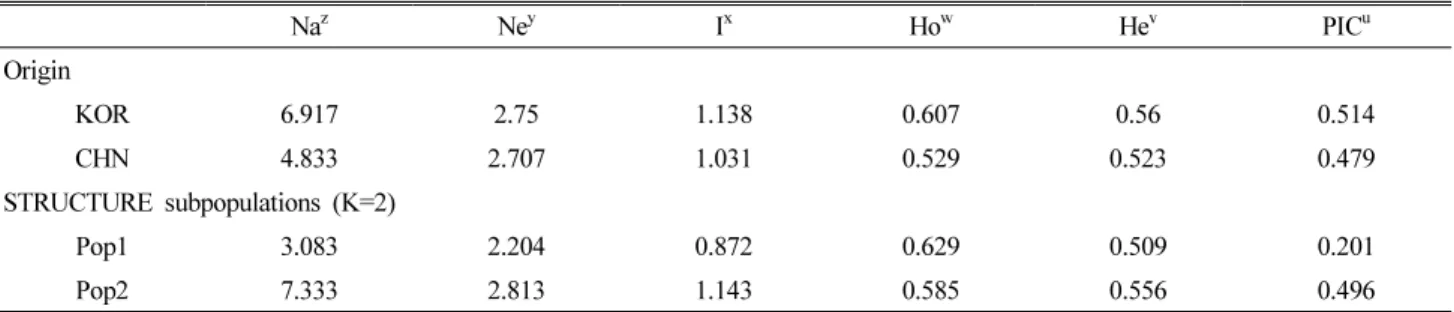
The number of alleles (Na) was 6.917 and 4.833 in Korean (KOR) and Chinese (CHN) accessions, respectively (Table 3). The Shannon indexes (I) of KOR and CHN were 1.138 and 1.030, respectively. The observed heterozygosity (Ho) Table. 1. Distribution of the major SSR motifs identified in E.
senticosus
Repeat unit Motif type No of clones Frequency (%)
Dimer AC/CA 78 16.6
TG/GT 118 25.1
AG/GA 62 13.2
TC/TC 35 7.4
AT/TA 8 1.7
Total 301 64.0
Trimer TTG/TGT/GTT 31 6.6
CAA/ACA/AAC 104 22.1
GGT/GTG/TGG 2 0.4
GAA/AGA/AAG 12 2.6
TTC/TCT/CTT 3 0.6
CCT/CTC/TCC 3 0.6
AGG/GAG/GGA 3 0.6
GCT/CTG/TGC 2 0.4
AGC/GCA/CAG 3 0.6
AAT/ATA/TAA 2 0.4
TGA/GAT/ATG 1 0.2
Total 166 35.3
Pentamer GGGGA 1 0.2
Total 1 0.2
Hexamer GCACCA 1 0.2
GGCGGA 1 0.2
Total 2 0.4
and expected heterozygosity (He) of KOR and CHN were 0.607 and 0.529 and 0.560 and 0.523, respectively. The PIC values of KOR and CHN were 0.514 and 0.479, respectively.
Between the two STRUCTURE subpopulations, all population
2 (Pop2) parameters were higher than those of population 1 (Pop1), except Ho. Analysis of molecular variance (AMOVA) showed that 1% of the observed variation was due to variation among populations (Table 4). Approximately 96% of the total Table 2. SSR markers assayed in the characterization of E. senticosus
Name R.motif Forward primer Reverse primer Na
z yNe
xI
wHo
vHe PIC
uGB-ES-025 (GT)13 GCAACTAAAGATGTTCAATCAA TAGAGCAGACAGAGTTTAGGGT 11 2.54 1.35 0.73 0.61 0.58 GB-ES-080 (AAC)4 GAGAAGAGGAATTTGAGTGAAG TTGTTGCTTCTGTTATTGTTGT 6 1.29 0.52 0.15 0.22 0.22 GB-ES-104 (TTC)9 GAGAGAGAAGGTAGAGATGGTG TCTTCTTTTACGTGGTGAAAAT 9 3.26 1.42 0.63 0.69 0.65 GB-ES-109 (GT)9,
(TC)13 AGAAGAGAAAAGAGAGTGTGGA GATAAGGTGAAGGGAGTGATAA 10 4.23 1.70 0.66 0.76 0.73 GB-ES-112 (TC)8 ATATAGGATAGGCATGACAAGG TCAATCGTAATGAAGACATGAT 2 1.40 0.46 0.18 0.28 0.24 GB-ES-133 (TGC)9 TGATGAACACTTGCATACAATA AAAGCTATGTTTCAGGGAAG 5 2.03 0.80 0.85 0.51 0.40 GB-ES-143 (GCA)6 GATGTGTTTGTGTTGGAAGTTA ATGGTATGAAAATGGAGTGATT 5 2.07 0.79 0.68 0.52 0.40 GB-ES-146 (TC)7,
(CA)16 TATATTTCAGGAAGAGGTATGC CCCATTTGATCTTATCTTCACT 13 5.03 1.83 0.87 0.80 0.77 GB-ES-148 (TC)19 ACTCTAATTGCTTCAACTCCAT GTCTTGTGTGTGATTCGTAAAG 4 1.31 0.51 0.21 0.23 0.22 GB-ES-161 (TG)13 CTTTCTGTTTGCTCACTCTGTA ATCTTTTCCAATTTCCTGACTA 9 3.28 1.51 0.68 0.70 0.66 GB-ES-175 (CT)13 TACCACATACTGCAGTCCTTTA TCAATAGAGTGGAAACATGAGA 11 4.61 1.80 0.76 0.78 0.75 GB-ES-181 (CA)11 AGTTGGCTACTAAACATTCCAT CTAATACCCAATAATGCCTAGC 4 2.25 0.95 0.65 0.56 0.47
Mean 7.4 2.77 1.14 0.59 0.56 0.51
z
Na, no. of alleles;
yNe, no. of effective alleles,
xI, Shannon's information index,
wHo = observed heterozygosity,
vHe = expected heterozygosity;
uPIC, polymorphism information content.
Table 3. Genetic diversity analyses of E. senticosus populations
Na
zNe
yI
xHo
wHe
vPIC
uOrigin
KOR 6.917 2.75 1.138 0.607 0.56 0.514
CHN 4.833 2.707 1.031 0.529 0.523 0.479
STRUCTURE subpopulations (K=2)
Pop1 3.083 2.204 0.872 0.629 0.509 0.201
Pop2 7.333 2.813 1.143 0.585 0.556 0.496
z
Na, no. of alleles;
yNe, no. of effective alleles,
xI, Shannon's information index,
wHo = observed heterozygosity,
vHe = expected heterozygosity;
uPIC, polymorphism information content.
Table 4. Summary of analysis of molecular variance (AMOVA) results
Source df
zSS
yMS
xEst. Var.
w%
vFst
uP value
Among Pops 1 8.645 8.645 0.050 1% 0.014 <0.01
Among Indiv 129 460.653 3.571 0.085 2%
Within Indiv 131 445.500 3.401 3.401 96%
Total 261 914.798 3.536 100%
z