https://doi.org/10.7848/ksgpc.2019.37.5.389
A Study on Urban Change Detection Using D-DSM from Stereo Satellite Data
Jang, Yeong Jae
1)·Oh, Kwan Young
2)· Lee, Kwang Jae
3)·Oh, Jae Hong
4)Abstract
Unlike aerial images covering small region, satellite data show high potential to detect urban scale geospatial changes. The change detection using satellite images can be carried out using single image or stereo images.
The single image approach is based on radiometric differences between two images of different times. It has limitations to detect building level changes when the significant occlusion and relief displacement appear in the images. In contrast, stereo satellite data can be used to generate DSM (Digital Surface Model) that contain information of relief-corrected objects. Therefore, they have high potential for the object change detection.
Therefore, we carried out a study for the change detection over an urban area using stereo satellite data of two different times. First, the RPC correction was performed for two DSMs generation via stereo image matching.
Then, D-DSM (Differential DSM) was generated by differentiating two DSMs. The D-DSM was used for the topographic change detection and the performance was checked by applying different height thresholds to D-DSM.
Keywords : Stereo Satellite Data, Change Detection, DSM, Differential-DSM
Original article
1. Introduction
The rapid urbanization has occurred such that numerous buildings are constructed or demolished every year. Hence, monitoring of rapidly changing urban area is important for the urban planning. However, these works often require time-consuming and expensive manual work in the current practices. Therefore, an automated or semi-automated change detection that locates changed buildings can greatly improve the monitoring process, thus being a great interest in the field of remote sensing (Du et al ., 2016).
Aerial and drone photogrammetry as well as LiDAR (Light Detection And Ranging) have become useful in small area monitoring as D-DSM (Differential DSM) was generated
using aerial images to detect urban changes (Kwon et al ., 2011) and LIDAR data were used to detect changes in urban areas (Choi and Lee, 2008).
Satellite images show high potential to detect geographic changes for wide range regions because of their large swath width. The change detection methods using satellite images can be classified into single image and stereo image approaches. The single image approach is usually based on the simple differencing between the orthorectified images of two times (Kang et al ., 2003). This approach shows limitations to detect building level changes because of the occlusion and relief displacement due to the acquisition angle differences at two different times. But the stereo image approach can correct the building relief in DSM that can be
Received 2019. 10. 06, Revised 2019. 10. 14, Accepted 2019. 10. 17
1) Member, Dept. of Civil Engineering, Korea Maritime and Ocean University (E-mail: [email protected]) 2) Korea Aerospace Research Institute (E-mail: [email protected])
3) Korea Aerospace Research Institute (E-mail: [email protected])
4) Corresponding Author, Member, Dept. of Civil Engineering, Korea Maritime and Ocean University (E-mail: [email protected])
This is an Open Access article distributed under the terms of the Creative Commons Attribution Non-Commercial License (http://
further used for the change detection(Dini et al ., 2012).
Th change detection based on DSM generation and the height differencing with help of orthoimages has been carried out. Varade (2011) generated DSMs from IKONOS and WorldView-2 to detect building changes based on the height difference. Bris and Chehata (2011) generated DSM and building boundary from GIS database for urban and rural area change detection. Tian et al . (2014) generated DSMs from stereo satellite data and carried out the change detection with vegetation removal and shadow classification.
Krauß et al . (2013) conducted topographic change detection for urban and mountainous area via DSM geneation from satellite data. Mészáros et al . (2012) also used DSM from stereo data to provide landslide information. However, in Korea, this stereo satellite based change detection needs to be tested over Korean urban environment.
Therefore, in this study, we carried out an experiment for a Korean urban area to investigate the performance of change detection using stereo satellite data acquired at two different times. First the RPC (Rational Polynomial Coefficients) correction was carried out to ensure the geometric consistency between the data. Then the dense stereo matching was conducted for two DSMs generation after the epipolar image resampling. Second D-DSM was obtained by differentiating the DSMs. Applying height thresholds to D-DSM, the performance of the change detection was investigated.
The paper is structured as follows: In Section 2, the proposed method is explained including the flowchart, RPC- compensation, DSM generation, and D-DSM computation for the change detection. The experimental results are presented in Section 3, followed by conclusions in Section 4.
2. Method
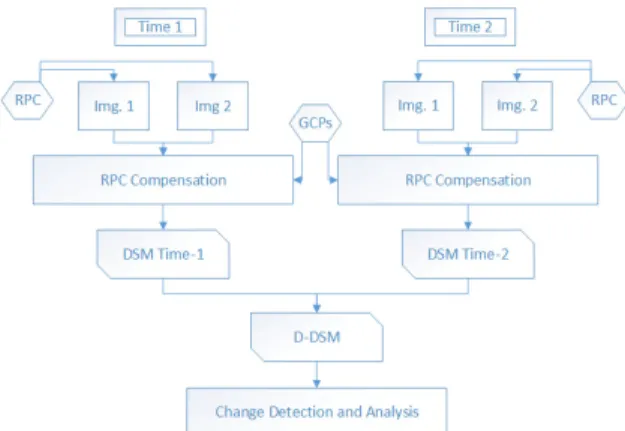
The flowchart of the study is presented in Fig. 1. Two sets of stereo satellite data are acquired over the same target. Firstly, errors of the four RPCs are corrected using GCPs (Ground Control Points). Then each set is stereo matched for DSM generation. Two DSMs are differentiated for D-DSM that is further used for the change detection with height threshold.
Fig. 1. Flowchart of the study
2.1 RPC compensation
The provided RPCs from the image vendors are not accurate enough for the object level change detection.
Therefore positional errors of them must be corrected. The bias-compensated RPCs model is expressed as Eq. (1) by incorporating shift and drift parameters ( ) into the RPC equation. The parameters are estimated using GCPs (Oh and Lee, 2018).
(1)
where, are RPC coefficients. ( ) are the geodetic latitude, longitude, and ellipsoidal height, respectively. ( ) are the image row and column coordinates, respectively. ( ) are the normalized ground
coordinates. ( ) and ( ) are
the offset and scale factors, respectively, for the latitude, longitude, height, column, and row. are affine transformation parameters.
2.2 DSM and D-DSM generation
Stereo satellite data acquired in single track show very
small spectral differences between the images. Therefore,
sophisticated and computationally expensive feature matching methods are usually not required. Therefore, fast and simple NCC (Normalized Cross Correlation) is widely used for the dense stereo matching using Eq. (2). Note that the epipolar image resampling and the pyramid image approach significantly reduce the search space along the line and sample directions, respectively for faster speed. Other more complex matching method such as SGM (Semi-Global Matching) may be used but it is not used in this study because of its high computational cost.
(2)
is the transformed image patch in the left epipolar image, and is the right image patch within the search region, both are in the size of ; average of all intensity value in the patches.
D-DSM is simple computed by differentiating the two DSMs as Eq.(3). Therefore for a pixel (i,j) in D-DSM, the positive and negative differences higher than a threshold correspond to newly constructed and demolished structures, respectively.
(3)
3. Experiment
3.1 Data acquisition and sensor modeling The stereo satellite images of two different times were acquired for the target area, Yangsan-si, Korea, as shown in Fig. 1. Stereo images of 2006 IKONOS satellite and stereo images of 2013 Kompsat-3A were used with intervals of 7 years. The specification of the satellites are listed in Table 1.
The RPC correction ensures the geometric accuracy of satellite images of two periods. To this end, we used GCPs for the bias-compensation. 6 GCPs were used for IKONOS and Kompsat-3A. The horizontal accuracy of IKONOS satellite images in 2006 was about x=0.77, y=0.79 m and the vertical accuracy was about 1.1m. And the horizontal accuracy of
Kompsat-3A was about x=1.77 m, y=1.09 m and the vertical accuracy was about 1.8 m. In the study, we did not separate GCPs and check points because GCPs cover well over the small target area.
(a) (b)
Fig. 2. Tested images with GCPs distribution (a) 2006 IKONOS, (b) 2013 Kompsat-3A
Table 1. Tested satellite data specification
2006 2013
Satellite IKONOS Kompsat-3A
GSD (Ground Sampling
Distance) 1m 0.7m
Resolution 7001x7001 24060x18304
Bit Level 8bit 16bit
Area Yangsan-si, Gyeongsangnam-do, Korea
Table 2. Sensor modeling accuracy at GCPs unit: meters RMSE 2006 IKONOS 2013 Kompsat-
3A
Horizontal 0.77/0.79 1.77/1.09
Vertical 1.09 1.83
3.2 DSM generation
Dense stereo matching of the stereo data produced two
DSMs with GSD 2 meters as shown in Fig. 2. Blue color
means 120 m above sea level and red means 220 m above
sea level. Since DSMs are automatically generated by
stereo matching, it should contain the vertical errors due to
the matching errors. Therefore, we checked the elevation
accuracy of the DSMs as shown in the Fig. 3 and Table 3. The
difference between the manually derived height of buildings and the DSM elevation was about 2 ~ 2.5 m in both data.
Also, the elevation difference between 2006 and 2013 for the unchanged site was found to be less than 2 m.
(a) 120m 220m (b)
Fig. 3. Generated DSMs (a) 2006 IKONOS, (b) 2013 Kompsat-3A
Fig. 4. Manually selected points for elevation check
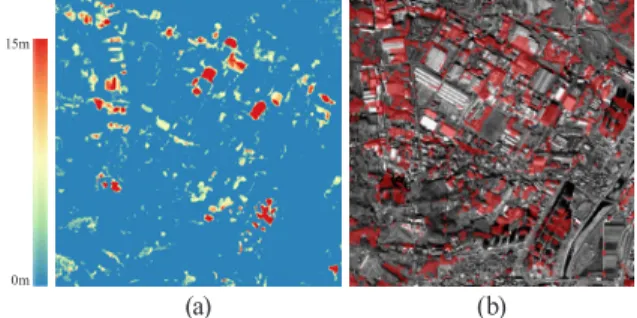
3.3 D-DSM generation and thresholding We differentiated the two DSMs for D-DSM generation as shown in Fig. 4. In Fig. 4(a), the red color indicates the area with elevation increased. Then, we applied an elevation threshold to D-DSM for change detection. Fig. 4(b) shows the detected area with higher elevation changes over 1.5 meters.
0m 15m
(a) (b)
Fig. 5. Generated D-DSM (a) colored D-DSM, (b) overlaid on orthoimage
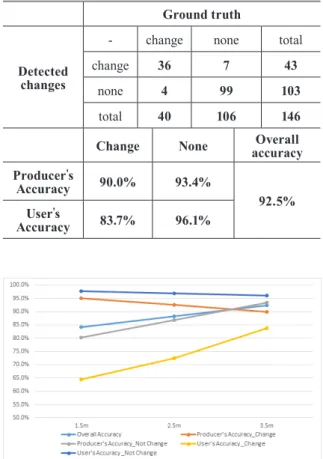
To check the change detection accuracy in the building area, we selected the performance assessment site as Fig. 5 where large and small structures are observed. We generated the ground truth data of 146 buildings from manual operation as red buildings are newly constructed. Comparing to the manual change detection produced the confusion matrices for different elevation thresholds such as 1.5 m, 2.5 m, and 3.5 m as shown in Tables 4-6 with Fig. 6. The overall accuracy increased from 84.2 % to 92.5 % as the threshold increases.
For the first case of 1.5m, the user’s accuracy was relatively low because many unchanged buildings are detected as changed buildings for the low threshold. In other words, there was high false alarm. The user’s accuracy improved as the threshold increases. But, producer’s accuracy was decreased as the threshold increase because higher threshold suppresses the lower elevation changes. When we applied 3.5 m for the elevation threshold, we could see the overall accuracy of 92.5
% with producer’s and user’s accuracy 90.0 % and 83.7 %, respectively.
unit: meters 2006 IKONOS DSM 2013 Kompsat-3A DSM Difference between 2006 and 2013 DSMs
Mean -1.08 -1.05 -1.07
RMSE 2.44 2.20 1.49
Table 3. DSM vertical accuracy compared to manually derived elevation
(a) (b) Fig. 6. Performance check area (a) ground truth (red:newly constructed, yellow: unchanged), (b) detected
changes(red:D-DSM, blue:change building in D-DSM) Table 4. Building detection accuracy (threshold 1.5 m)
Ground truth
Detected changes
- change none total
change 38 21 59
none 2 85 87
total 40 106 146
Change None Overall
accuracy Producer’s
Accuracy 95.0% 80.2%
84.2%
User’s
Accuracy 64.4% 97.7%
Table 5. Building detection accuracy (threshold 2.5 m) Ground truth
Detected changes
- change none total
change 37 14 51
none 3 92 95
total 40 106 146
Change None Overall
accuracy Producer’s
Accuracy 92.5% 86.8%
88.4%
User’s
Accuracy 72.5% 96.8%
Table 6. Building detection accuracy (threshold 3.5 m) Ground truth
Detected changes
- change none total
change 36 7 43
none 4 99 103
total 40 106 146
Change None Overall
accuracy Producer’s
Accuracy 90.0% 93.4%
92.5%
User’s
Accuracy 83.7% 96.1%
Fig. 7. Accuracy for elevation thresholds
3.4 Profile analysis
The profile of DSMs are analyzed for the potential of
change detection based on DSMs. Figs. 7-10 depict the profile
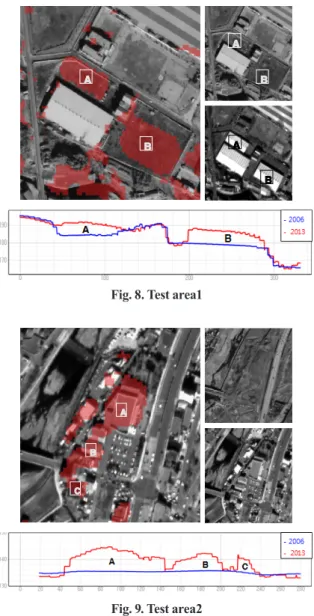
of several samples. In Fig. 7, newly constructed buildings A
and B are presented. In profile, two medium size structures
are well depicted with high elevation differences such that the
area was well detected. Fig. 8 shows rather small buildings
that were constructed. The profile also shows the distinct
elevation difference between the times. But the detection was
not able to separate each building because the structures are
close to each other.
A
B
A
A B
B
Fig. 8. Test area1
A
B
C
Fig. 9. Test area2
Figs. 9 and 10 show the change detection over high rise building such as apartments. Fig. 8 shows the newly constructed apartment complex. In the satellite images, the buildings has large relief displacement with shadows but the DSM was able to describe the building structure as can be seen in the profile. Fig. 9 shows an example of unchanged apartment complexes where the approach highlighted the area as change. This is because DSM generation from Kompsat-3A was not precise enough to describe the high rise building boundaries such as the dense and high rise apartment area. Therefore the boundary differences are
detected as terrain changes in D-DSM. To avoid these problems, higher resolution stereo data would be preferred.
Also, multi-overlapping images rather than a stereo set would be required.
A
B
C
Fig. 10. Test area3
A
C B