∙ Received: June 29, 2011. Accepted: July 5, 2011.
∙ Corresponding author: Seung Yong Park
Department of Nuclear Medicine, Asan Medical Center, 88, Olympic-ro 43-gil, SongPa-gu, Seoul 138-736, Korea Tel: +82-2-3010-5421, Fax: +82-2-3010-5425 E-mail: [email protected]
Original Article
PET/CT 장비 별 mini PACS에서 측정한 표준섭취계수(SUV)의 유용성 평가서울아산병원 핵의학과
박승용⋅고현수⋅김정선⋅정우영
Evaluation of SUV Which was Estimated Using Mini PACS by PET/CT Scanners
Seung Yong Park, Hyun Soo Ko, Jung Sun Kim and Woo Young Jung Department of Nuclear Medicine, Asan Medical Center, Seoul, Korea
Purpose: Facilities use own sever or mini PACS system for storage and analysis of the PET/CT data. Mini PACS can storage scan data as well as measuring SUV. Therefore, the study was performed to confirm whether or not measured SUV on mini PACS is measured equally on PET/CT workstation. Materials and Methods: In February 2011, 30 patients who were performed 18F-FDG wholebody PET/CT scan in Biograph 16, Biograph 40 and Discovery Ste 8 were enrolled. First, using each workstation, SUV in liver and aorta of mediastinum level was measured. Second, using mini PACS, SUV was measured by same method. Result: The correlation coefficient of SUV in liver between PET/CT scanner and min PACS in Biograph 16, Biograph 40, Discovery Ste 8 was 0.99, 0.98, 0.64 respectably, the correlation coefficient of SUV in aorta was 0.98, 0.98, 0.66, and these were showed positive correlation coefficient. Difference of SUV between Biograph workstation and mini PACS was not showed statistical significant difference at 5% level of significance. Difference of SUV between Discovery Ste 8 workstation and mini PACS was showed statistical significant difference at 5% level of significance.
Conclusion: In case that patient was scanned by the other scanner, if the correction of SUV formula in mini PACS for each scanners is performed, mini PACS will be usefully used to provide consistently quantitative assessment. (Korean J Nucl Med Technol 2011;15(2):47-52)
Key Words : mini PACS, SUV, Liver, Aorta
서 론
각 병원에서 시행된 PET/CT 검사는 장비 자체에 설치 된 workstation을 이용하여 영상 자료를 저장하고 정량 분석을 시행한다. 그러나 장비 별 PET/CT 검사의 데이터는 서로 호 환 되지 않기 때문에, 병원 자체 서버를 이용하거나 mini PACS를 구비하여 영상분석을 시행하고 있다. 기존 PACS는 단순히 영상을 볼 수 있는 기능으로만 사용되었으나 최근에
설치되고 있는 mini PACS는 영상을 보고, 또 검사 자료를 저장 할 수 있을 뿐만 아니라 각 회사의 PET/CT 장비에서만 측정할 수 있었던 표준섭취계수(standardized uptake value, 이하 SUV)를 측정 할 수 있도록 개발 되었다.1) 본 논문의 목 적은 각 PET/CT 장비에서 측정 된 SUV가 mini PACS에서 도 동일하게 측정되는지를 확인하고자 하였다.
대상 및 방법
1. 대상
Workstation과 mini PACS에서의 SUV 비교를 위해 사용된 PET/CT 장비는 Biograph Sensation 16 (SIEMENS, GERMANY,
Table 1. Standardized uptake value of Bio 16 and mini PACS
Liver Aorta
mean SD t mean SD t
Bio 16 1.65 0.21
0.57 1.09 0.13
1.44
mini PACS 1.65 0.21 1.08 0.14
Table 2. Standardized uptake value of Bio 40 and mini PACS
Liver Aorta
mean SD t mean SD t
Bio 40 1.82 0.30
0.00 1.31 0.21
0.81
mini PACS 1.82 0.29 1.32 0.21
Table 3. Standardized uptake value of DSTE and mini PACS
Liver Aorta
mean SD t mean SD t
DSTE 1.48 0.15
7.14** 0.96 0.12
10.43**
mini PACS 1.67 0.18 1.16 0.13
**p<0.05
Table 4. Standardized uptake value of DSTE and modified mini PACS
Liver Aorta
mean SD t mean SD t
DSTE 1.48 0.15
1.82 0.96 0.12
4.25**
modified 1.53 0.15 1.05 0.14
**p<0.05
이하 Bio 16), Biograph Truepoint 40 (SIEMENS, GERMANY, 이하 Bio 40), Discovery STE 8(GE healthcare, USA, 이하 DSTE 8)을 이고, mini PACS는 INFINITT사의 Xelis 버전 1.0.4.1을 사용하였다. 대상은 2011년 2월에 18F-FDG Whole body PET/CT 검사를 시행한 환자 중 만 18세 미만의 소아 환자를 제외한 각 장비 별 30명의 검사 자료를 대상으로 하여 SUV를 분석하였다.
2. 분석 방법
종양의 섭취는 blood pool, mediastium, liver, cerebellum 등과 같은 기준 영역의 섭취에 대한 병변의 섭취 비율을 계 산함으로써 측정이 가능한데,2) 그 중 본원에서 측정하고 있 는 liver와 aorta에서의 SUV를 측정하여 비교하였다.
Liver는 liver가 가장 넓게 보이는 slice에서 병변과 겹치지 않는 영역에 15 cm2의 Region Of Interest(ROI)를 그려 측정 하고, aorta는 mediastinum 높이에서 3 cm2의 ROI를 그려 SUV를 측정하였다. 또한 mini PACS도 이와 마찬가지로 liver와 aorta의 같은 위상의 영역에 ROI를 그려 SUV를 측정 하고, 그 값을 비교 분석하였다.3)
결 과
1. Bio 16에서 검사를 시행한 환자와 mini PACS와의 SUV 비교
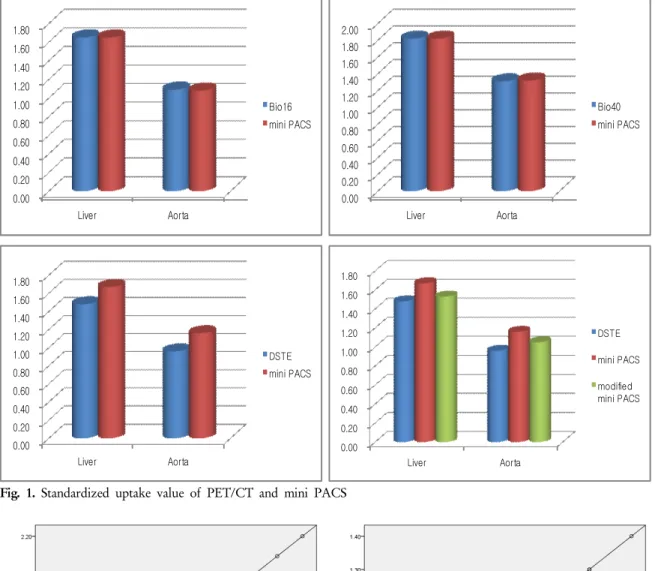
Bio 16과 mini PACS에서 측정한 liver의 평균 SUV는 모 두 1.65이었고, aorta에서의 평균 SUV는 Bio 16에서 1.09, mini PACS는 1.08이었다. 대응표본 t 검정을 시행하여 그 값 을 비교한 결과 liver, aorta 모두 유의수준 0.05로 Bio 16과 mini PACS가 통계적으로 차이가 없었다(Fig. 1, Table 1).
2. Bio 40에서 검사를 시행한 환자와 mini PACS와의 SUV 비교
Bio 40과 mini PACS에서 측정한 liver의 평균 SUV는 모 두 1.82이었고, aorta에서의 평균 SUV는 Bio 40에서 1.31, mini PACS는 1.32이었다. 대응표본 t 검정을 시행하여 그 값 을 비교한 결과 liver, aorta 모두 유의수준 0.05로 Bio 40과 mini PACS가 통계적으로 차이가 없었다(Fig. 1, Table 2).
0.00 0.20 0.40 0.60 0.80 1.00 1.20 1.40 1.60 1.80
Liver Aorta
Bio16 mini PACS
0.00 0.20 0.40 0.60 0.80 1.00 1.20 1.40 1.60 1.80 2.00
Liver Aorta
Bio40 mini PACS
0.00 0.20 0.40 0.60 0.80 1.00 1.20 1.40 1.60 1.80
Liver Aorta
DSTE mini PACS
0.00 0.20 0.40 0.60 0.80 1.00 1.20 1.40 1.60 1.80
Liver Aorta
DSTE mini PACS
modified mini PACS
Fig. 1. Standardized uptake value of PET/CT and mini PACS
Fig. 2. Scatter diagram of Bio 16 and mini PACS
3. DSTE에서 검사를 시행한 환자와 mini PACS와의 SUV 비교
DSTE와 mini PACS에서 측정한 liver의 평균 SUV는 각각 1.48, 1.67이었고, aorta에서의 평균 SUV는 DSTE에서 0.96, mini PACS는 1.16이었다. 대응표본 t 검정을 시행하여 그 값
을 비교한 결과 liver, aorta 모두 유의수준 0.05로 DSTE와 mini PACS가 통계적으로 차이가 있었다(Fig. 1, Table 3).
SUV 산출 시 DSTE 장비는 기본적으로 Acquisition Time 을 이용하여 SUV를 측정하나, mini PACS는 Series Time을 이용하여 SUV를 측정한다. 따라서 동일한 Time setting을 위 해 mini PACS 옵션에서 Series Time을 off로 하여 SUV를 재
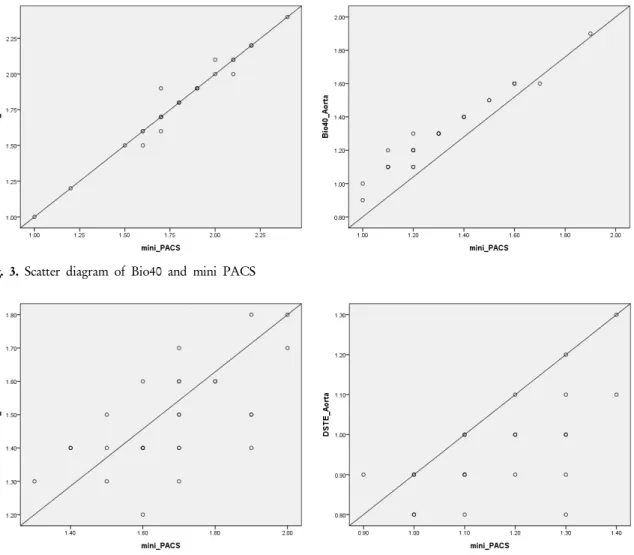
Fig. 3. Scatter diagram of Bio40 and mini PACS
Fig. 4. Scatter diagram of DSTE and mini PACS 측정하였다. 그 결과 수정된 mini PACS의 평균 SUV는 liver 에서 1.53, aorta는 1.05로 나타났고, liver는 유의수준 0.05에 서 DSTE와 수정된 mini PACS가 통계적으로 차이가 없었으 며, aorta는 통계적인 차이가 있었다(Fig. 1, Table 4).
4. PET/CT 장비와 mini PACS와의 피어슨 상관계수
다음 그래프는 liver와 aorta의 산포도이다. PET/CT와 mini PACS간의 피어슨 상관계수를 구하였다. 그 결과 Bio 16과 mini PACS의 피어슨 상관계수는 liver에서 0.99, aorta 는 0.98이었다(Fig. 2).
Bio 40과 mini PACS의 피어슨 상관계수는 liver와 aorta 모두 0.98이었다(Fig. 3).
DSTE와 mini PACS의 피어슨 상관계수는 liver에서 0.64, aorta는 0.66이었다(Fig. 4).
고 찰
PET/CT와 mini PACS간 ROI가 완벽하게 일치할 수가 없었고, Acquisition Time과 Series Time의 setting 여부에 따 라 SUV가 변동이 있었으며, 이 외에 SUV에 어떠한 항목들 이 PET/CT와 mini PACS 사이에 영향관계가 있었는지 정확 히 확인 할 수 없다는 것이 이 연구의 한계점이었다. 참고적 으로 Biograph 장비는 Series Time을 사용하고 있었고, Discovery STE 8은 Acquisition Time을 사용하여 SUV를 산 출하고 있었다. Mini PACS는 기본적으로 Series Time을 사 용하고 있었고, 옵션에서 Series Time를 off로 설정하여 SUV 를 측정할 수도 있었다.
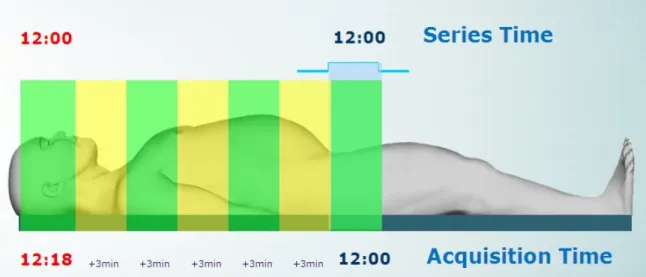
Series Time은 검사 시 Series가 생성된 시간을 말하는 것 으로, 검사 완료 후에도 시간의 변경이 없으나, Acquisition Time의 경우 각 bed 당 각각의 시간이 생성되므로, 예를 들 어 bed당 3분씩 7bed의 영상을 획득하는 경우, 처음 bed는
Fig. 5. Series Time and Acquisition Time
Series Time과 동일하나, 마지막 bed에서는 18~19분의 시간 차이가 발생을 하게 된다(Fig. 5).
결 론
본 원에 설치된 Biograph 16, Biograph 40 두 장비 모두 SUV 측정에서 mini PACS와 강한 양의 상관관계가 있었고, Discovery STE 8는 Biograph 장비에 비하여 상관관계가 낮 았다. 특히 mini PACS에서 측정한 Biograph 장비들의 SUV 는 유의수준 0.05에서 통계적으로도 차이가 없었다. 다만 mini PACS와 Discovery STE 8에서 측정된 SUV는 Liver에 서는 0.19±0.03 g/mL, Aorta에서는 0.20±0.01 g/mL로 mini PACS 값이 높게 측정되었고, 통계적으로도 유의수준 0.05에 서 차이가 있었지만 그 차이는 미세하였다. Mini PACS에서 Series Time을 off로 하여 Discovery STE 8과 다시 비교를 하 면, 평균 SUV는 liver에서 0.05±0.00 g/mL, aorta는 0.09±0.02 g/mL로 차이가 감소하였고, 통계적으로는 유의수준 0.05에 서 liver에서는 차이가 없고 Aorta에서는 차이가 있었다. 이 러한 장비 별 mini PACS의 SUV 계산식에 대한 보완이 추후 에 이루어진다면, 동일 환자가 다른 장비에서 검사한 경우 이와 같은 mini PACS 시스템을 이용한 정량적인 비교 분석 을 통해, 추적 검사를 수행하는 환자의 일관성 있는 정량분 석 자료를 제공할 수 있을 것으로 판단된다.
요 약
PET/CT 검사의 자료 저장 및 분석을 위해 장비 자체의
workstation과는 별도로 자체 서버를 이용하거나 mini PACS 를 구비하여 운영하기도 한다. mini PACS는 검사 자료의 저 장뿐만 아니라 각 회사의 PET/CT 장비에서만 측정할 수 있 었던 표준섭취계수(standardized uptake value, 이하 SUV)를 PACS 상에서도 측정이 가능하도록 개발되어 있다. 이에 PET/CT 장비 별 측정 된 SUV가 mini PACS에서도 동일하 게 측정되는지 파악하기 위해 본 논문을 쓰게 되었다. 본원 에 설치 된 Siemens사의 Biograph 16, Biograph 40 장비와 GE사의Discovery Ste 8 장비에서 각각 2011년 2월에
18F-FDG 전신 PET 검사를 시행한 환자 30명의 liver와 mediastinum 높이에서 aorta의 SUV를 측정하고, mini PACS 프로그램에서도 같은 위상의 영상에서 SUV를 측정하여 분 석하였다. PET/CT 장비와 mini PACS의 SUV의 상관계수 는, Liver에서 Biograph 16은 0.99, Biograph 40은 0.98, Discovery Ste은 8 0.64이었고, aorta에서 Biograph 16은 0.98, Biograph 40은 0.98, Discovery Ste은 8 0.66이었으며 모두 양 의 상관 관계가 있었다. Biograph 16에서의 liver와 aorta의 평균 SUV는 각각 1.65±0.21 g/mL, 1.09±0.13 g/mL이었고, mini PACS에서는 1.65±0.21 g/mL, 1.08±0.14 g/mL이었다.
Biograph 40에서는 1.82±0.30 g/mL, 1.31±0.21 g/mL, mini PACS에서는 1.82±0.29 g/mL, 1.32±0.21 g/mL이었다. Biograph 장비와 mini PACS의 SUV는 유의수준 0.05에서 통계적으로 유의한 차이가 없었다. Discovery Ste 8에서는 liver와 aorta의 평균 SUV가 1.48±0.15 g/mL, 0.96±0.12 g/mL, mini PACS에 서는 1.67±0.18 g/mL, 1.16±0.13 g/mL이었고, 유의수준 0.05 에서 통계적으로 유의한 차이가 있었다. Biograph 16, Biograph 40, Discovery Ste 8 세 장비 모두 SUV 측정에서
mini PACS와 높은 상관관계가 있었고, 특히 mini PACS에서 측정한 Biograph 장비들의 SUV는 차이가 없었다. 다만 mini PACS와 Discovery Ste 8에서 측정된 SUV는 liver에서는 0.19±0.03 g/mL, aorta에서는 0.20±0.01 g/mL로 mini PACS 값이 높게 측정되었고, 통계적으로도 차이가 있었지만 그 차 이는 미세하였다. 장비 별 mini PACS의 SUV 계산식에 대한 보완이 이루어진다면, 동일 환자가 다른 장비에서 검사한 경 우 이와 같은 mini PACS 시스템을 이용한 분석을 통해, 추 적 검사를 수행하는 환자의 일관성 있는 정량분석 자료를 제 공할 수 있을 것으로 판단된다.
REFERENCES
1. Correlation of PET/CT Standardized Uptake Value Measurements between Dedicated Workstations and a PACS-Integrated Workstation System: J Digit Imaging. 2007 Sep;20(3):307-13.
2. Procedure Guideline for Tumor Imaging with 18F-FDG PET/CT 1.0*. Dominique Delbeke et al. J Nucl Med. 2006 Jun;47(6):903.
3. Huang SC. Anatomy of SUV. Standardized uptake value. Nucl Med Biol. 2000; 27(7):643-646. doi: 10.1016/S0969-8051(00)00155-4.