http://dx.doi.org/10.14316/pmp.2015.26.4.215
This work was supported by the Radiation Technology Development Program of the National Research Foundation (NRF) funded by the Korea Ministry of Science, ICT & Future Planning under Contract No.
2015-51-0284.
Received 26 November 2015, Revised 21 December 2015, Accepted 22 December 2015
Correspondence: Hyosung Cho ([email protected]) Tel: 82-33-761-9660, Fax: 82-33-761-9664 cc This is an Open-Access article distributed under the terms of the Creative Commons Attribution Non-Commercial License (http://creativecommons.org/licenses/by-nc/4.0) which permits unrestricted non-commercial use, distribution, and reproduction in any medium, provided the original work is properly cited.
Experimental Study for Phase-contrast X-ray Imaging Based on a Single Antiscatter Grid and a Polychromatic X-ray Source
Yeonok Park, Hyosung Cho, Hyunwoo Lim, Uikyu Je, Chulkyu Park, Heemoon Cho, Kyuseok Kim, Guna Kim, Soyoung Park
Department of Radiation Convergence Engineering and iTOMO Research Group, Yonsei University, Wonju, Korea
In this work, we performed a proof-of-concept experiment for phase-contrast x-ray imaging (PCXI) based on a single antiscatter grid and a polychromatic x-ray source. We established a table-top setup which consists of a focused-linear grid having a strip density of 200 lines/inch, a microfocus x-ray tube having a focal-spot size of about 5 μm, and a CMOS-type flat-panel detector having a pixel size of 48 μm. By using our prototype PCXI system and the Fourier demodulation technique, we successfully obtained attenuation, scattering, and differential phase-contrast images of improved visibility from the raw images of several selected samples at x-ray tube conditions of 90 kVp and 0.1 mAs. Further, fusion image (e.g., the attenuation+the scattering) may have an advantage in displaying details of the sample’s structures that are not clearly visible in the conventional attenuation image. Our experimental results indicate that single-grid-based approach seems a useful method for PCXI with great simplicity and minimal requirements on the setup alignment.
Key Words: Phase-contrast x-ray imaging, Antiscatter grid, Microfocus x-ray tube, Scattering image
Introduction
Since Röntgen discovered x-rays in 1895, x-ray imaging techniques have continuously advanced from planar radiog- raphy to digital tomosynthesis (DTS), computed tomography (CT), and other approaches, having been standard imaging tools in medicine, industry, material science, biology, etc.
Those techniques have in common attenuation-based contrast according to the density and the elemental composition of the examined object. Besides attenuation contrast, other contrast mechanisms such as dark field and phase contrast, standard in optical microscopy, have also inspired parallel developments in
x-ray-based procedures.1,2) According to recent related re- searches, dark-field (sometimes called the scattering) imaging can reveal information about micro-structures invisible in con- ventional attenuation images, while phase-contrast imaging can dramatically enhance image contrast among samples of differ- ent refractive indices.3,4)
Over the years, a variety of different phase-contrast x-ray imaging (PCXI) techniques have been developed. Among them, grating-based interferometry techniques have shown scattering and phase-contrast images of high resolution and sensitivity with conventional polychromatic x-ray sources and digital detectors.5,6) However, they require the time-consuming phase- stepping procedure, limiting the imaging speed, and still re- main expensive task due to the requirement on specialized gratings. In addition, fabricating large-area gratings especially for applications in medical diagnostics is still not easy.
Recently, Wen et al. developed a variant grating-based method to obtain attenuation, scattering, and differential phase-contrast images from the raw images of the examined object.7) Here an antiscatter grid that is commonly used in radiography is placed between the x-ray source and the detector acting as a trans-
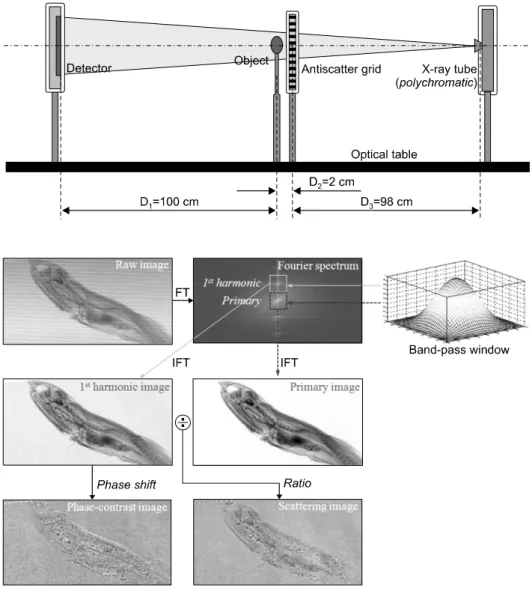
Fig. 2. Simplified single-grid-based phase-contrast x-ray imaging (PCXI) procedure. The areas surrounding the primary and the first harmonic peaks are selected with a band- pass filter separately, and then inverse-Fourier transformed to yield the primary image and the first harmonic image of the object.
Fig. 1. Schematic illustration of a system layout for the single-grid- based phase-contrast x-ray imag- ing (PCXI). Here, an antiscatter grid is placed between the x-ray tube and the detector, and an examined object is placed imme- diately behind the grid.
mission grating. Compared to the previous grating-based tech- niques, it requires only a single grid and a single exposure with great simplicity and minimal requirements on the setup alignment, which holds potential to open the way to further widespread use of PCXI into many applications. In this work, we implement to establish a table-top setup for a proof-of-con- cept PCXI experiment.
Principle of Single-grid-based PCXI
Fig. 1 shows a system layout for the single-grid-based PCXI. Here an antiscatter grid is placed between the x-ray source and the detector and an object to be examined is placed immediately behind the grid. As illustrated in Fig. 1, a cone
beam from the x-ray source is masked by the grid before ex- posing the object and thus the raw image of the object is modulated by the periodic grid strips. The grid has been origi- nally used to remove (large-angle) scattering x-rays in radiog- raphy, enhancing the image contrast. However, the role of the grid in the PCXI is different in that it acts as a frequency modulator to the Fourier contents of the object. Theoretically, Fourier spectrum of the raw image is the convolution of the object and the grid spectra. Thus it includes a strong primary peak around zero spatial frequency and the first and higher harmonic peaks corresponding to the grid periodicity in the Fourier space. Fig. 2 shows the simplified single-grid-based PCXI procedure. In Fig. 2, the areas surrounding the primary and the first harmonic peaks are selected separately with a
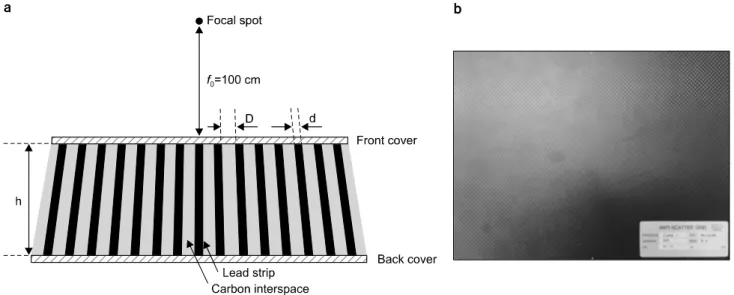
Fig. 4. (a) Schematic drawing and (b) a photograph of the grid that we used. Here, D and d are the thicknesses of the grid interspace and the lead strip, respectively, and h is the height of the grid plate; D=0.102 mm, d=0.025 mm, and h=0.510 mm (i.e., P0=D+d=127 μm). The grid has a focal distance of 100 cm and a grid ratio of 5:1.
Fig. 3. Photograph of a table-top setup we established for this work. It consists of a microfocus x-ray tube having an about 5- μm focal spot size (Hamamatsu, L7910), a focused-linear grid of a 200-lines/inch strip density (JPI Healthcare Corp.), and a CMOS image sensor of a 48-μm pixel resolution and a 2,048×
1,024 matrix (Rad-icon Imaging Corp., Shad-o-Box 2048).
band-pass filter and then inverse-Fourier transformed to yield the primary image and the first harmonic image of the object.
Considering that the primary image of the object (I0) is not modulated by the coherent scattering, a conventional attenu- ation image (Iattenu) can be retrieved by normalizing I0 with the primary image of the grid (I0g):
Iattenu=
(1)
In addition, considering that the ratio of the first harmonic image of the object (I1) to I0 is a measure of blurring of the grid shadow by the coherent scattering in the object, a scatter- ing image (Iscatter) can be retrieved by normalizing the ratio I1/I0 with the corresponding ratio of the grid (I1g/I0g):
Iscatter=
(2)
The normalization step above relative to the reference grid removes all features of the grid itself. The intensity of the scattering image depends on the size of the object’s structures, the x-ray wavelength, the grid period, and the system geo- metry. The size of the structures whose scattering can be ap- preciably detected is known to be limited to an upper thresh- old size,8) which is defined as the scattering length scale, l:
l=
(3)
where λ is the x-ray wavelength, P0 is the grid period, D1 is the object-to-detector distance, D2 is the grid-to-object distance, and D3 is the source-to-grid distance. The larger the scattering length scale, the higher the scattering signal. Further consider-
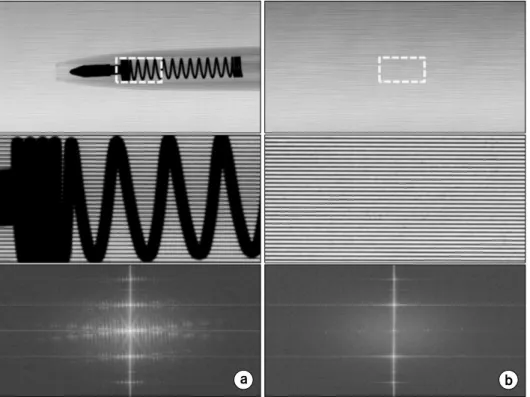
Fig. 7. Raw images (top) and the Fourier spectrums (bottom) of (a) a ball-point pen taken with the grid and (b) the grid only (note the screen moiré in the raw images). Enlarged images of the area inside the dot box are also indicated in the middle; the grid shadow is clearly visible with no screen moiré.
Fig. 5. Scattering length scale estimated as a function of the x-ray tube voltage for several grid periods. The larger the scattering length scale, the higher the scattering signal. For our system setup, the scale was estimated about l=133 nm.
Fig. 6. Some selected samples used in the PCXI experiment: (a) a ball-point pen, (b) a toothbrush, (c) a small pill container, and (d) an acorn.
ing that the phase of I1 is influenced by slight bending of x-rays by the spatial variations of the refractive index of the object, the phase shift of I1 from the first harmonic image of the grid (I1g) yields a differential phase-contrast image (ΔΦ):
ΔΦ=Φ1−Φ1g (4)
where Φ1 and Φ1g are the phase maps of I1 and I1g, res- pectively.
In the single-grid-based PCXI, detector resolution needs to be sufficient to sample the first harmonic peak of the raw image. According to the Nyquist sampling theorem, the de- tector pixel should not be larger than one-third of the period of the grid shadow on the detector surface:
p≤
P0= ×
×(μm)=86.4(μm) (5)
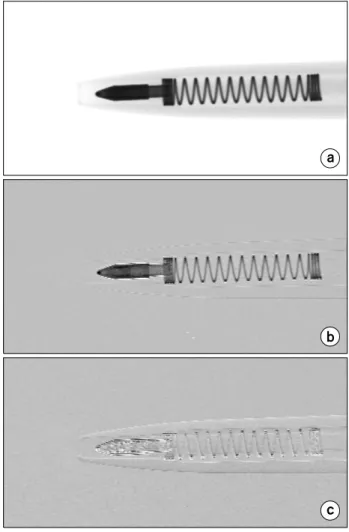
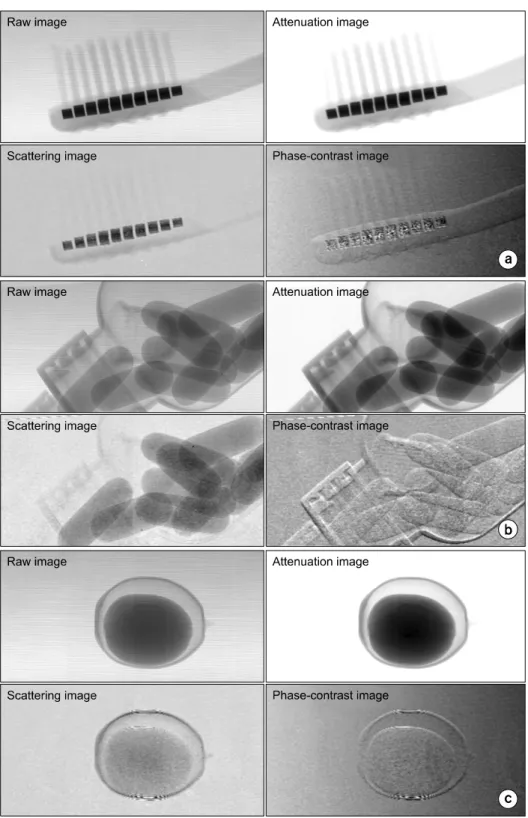
Fig. 8. Complete sets of results retrieved from a single raw image of a ball-point pen in Fig. 7 taken at x-ray tube conditions of 90 kVp and 0.1 mAs: (a) the attenuation image, (b) the scattering image, and (c) the phase-contrast image.
where p is the size of the detector pixel. In our system layout, we used a detector of a 48-μm pixel resolution, which meets this criterion for P0=127 μm.
Materials and Methods
Fig. 3 shows the table-top setup we established for the experiment. It consists of a microfocus x-ray tube having an about 5-μm focal spot size (Hamamatsu, L7910, Japan), a fo- cused-linear grid of a 200-lines/inch strip density (JPI Healthcare Corp., Korea), and a CMOS-type flat-panel detector of a 48-μm pixel size and a 2,048×1,024 matrix (Rad-icon Imaging Corp., Shad-o-Box 2048, USA). Fig. 4 shows (a) a schematic drawing, and (b) a photograph of the grid that we used in the experiment. Here D and d are the thicknesses of the grid interspace and the lead strip, respectively, and h is the height of the grid plate; D=0.102 mm, d=0.025 mm, and h=
0.510 mm (i.e., P0=D+d=127 μm). The grid has a focal dis- tance of 100 cm and a grid ratio of 5:1. As illustrated in Fig.
1, the grid was placed horizontally at D3=98 cm (close to its focal distance) from the x-ray tube, test samples at D2=2 cm behind the grid, and the detector at D1=100 cm from the object. The image characteristics of the PCXI was tested at a tube voltage of 90 kVp (average energy of ∼40 keV) and a tube current of 0.1 mAs. Fig. 5 shows the scattering length scale estimated as a function of x-ray tube voltage for several grid periods. For our system setup, the scattering length scale was estimated about l=133 nm. Fig. 6 shows some selected samples used in the PCXI experiment: (a) a ball-point pen, (b) a toothbrush, (c) a small pill container, and (d) an acorn.
Results and Discussion
Fig. 7 shows the raw images (top) and the Fourier spectra (bottom) of (a) the ball-point pen taken with the grid and (b) the grid only. Note that the screen moiré appears in the raw images in Fig. 7. Enlarged images of the area inside the dot box are also indicated in the middle; the grid shadow is clear- ly visible with no screen moiré. Fig. 8 shows the complete sets of results retrieved from a single raw image of the ball-point pen in Fig. 7: (a) the attenuation image, (b) the scat- tering image, and (c) the phase-contrast image. As shown in
Fig. 8, the attenuation and the scattering images have a little worse spatial resolution than the raw image as a result of band-pass filtering (e.g., a Hann-based filter in our case) to sample the primary and the first harmonic peaks in the Fourier space. The final spatial resolution is equal to the grid period of 127 μm. In general, a linear grid can detect small-angle scattering in only one direction perpendicular to grid strips.
Note that the segments of the sample boundary perpendicular to the grid direction are more highlighted in the differential phase-contrast image in Fig. 8. Kottler et al. showed that mea- surements in two orthogonal directions are often necessary to improve visibility and reduce artifacts in the image.9) Fig. 9 shows similar images of the other samples retrieved from their
Fig. 9. Complete sets of results for the other samples retrieved from their raw images: (a) a toothbrush, (b) a small pill container, and (c) an acorn.
raw images: (a) toothbrush, (b) small pill container, and (c) acorn. As shown in Fig. 9, both the scattering and the phase- contrast images show structures that may not be visible in conventional attenuation images.
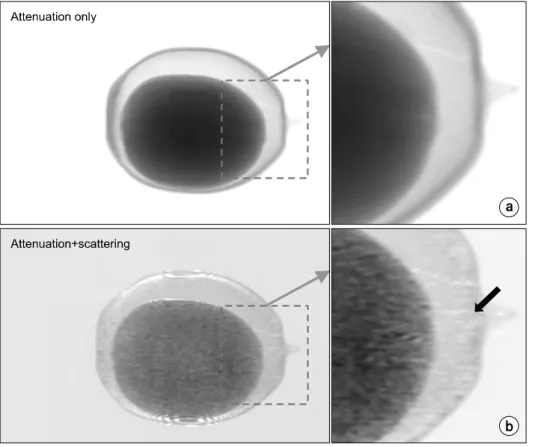
Fig. 10 shows the comparison of the image characteristics between (a) the attenuation-only image and (b) the fusion im- age (e.g., the attenuation+the scattering) in Fig. 9(c). The acorn gemmule indicated by the thick arrow in Fig. 10(b) is more
Fig. 10. Comparison of the image characteristics between (a) the attenuation-only image and (b) the fusion image (i.e., the atte- nuation+the scattering) in Fig.
9(c). Note that the acorn gemmule indicated by an arrow in (b) is more discernable in the fusion image than in the attenuation- only image.
discernable in the fusion image than in the attenuation-only image. Thus fusion image may have an advantage in display- ing details of the sample’s structures that are not clearly visi- ble in the conventional attenuation image. Consequently, we successfully obtained attenuation, scattering, and differential phase-contrast images of improved visibility from the raw im- ages of several samples, demonstrating that the single-grid- based approach seems a useful method for PCXI with great simplicity and minimal requirements on the setup alignment.
Conclusion
We investigated a simplified method to PCXI with a single antiscatter grid and a conventional polychromatic x-ray source.
We obtained concurrently attenuation, scattering, and differ- ential phase-contrast images of improved visibility from the raw images of several samples and composed the attenuation and scattering images. The fusion image may have an advant- age in displaying details of the sample’s structures that are not clearly visible in the conventional attenuation image. The sin-
gle-grid-based approach seems a useful method for PCXI with great simplicity and minimal requirements on the setup align- ment, which can open the way to further widespread use of the PCXI into the related application areas.
References
1. D. Chapman, W. Thomlinson, R. Johnston, et al:
Diffraction enhanced x-ray imaging. Phys. Med. Biol. 42(11):
2015-2025 (1997).
2. L. Levine and G. Long: X-ray imaging with ultra-small-angle x-ray scattering as a contrast mechanism. J. Appl. Crystallogr. 37:
757-765 (2004).
3. H. Wen, E. Bennett, R. Kopace, A. Stein, and V. Pai:
Single-shot x-ray differential phase-contrast and diffraction imag- ing using two-dimensional transmission gratings. Opt. Lett. 35(12):
1932–1934 (2010).
4. M. Endrizzi, P. Diemoz, T. Millard, et al: Hard X-ray dark-field imaging with incoherent sample illumination. Appl. Phys.
Lett. 104: 024106 (2014).
5. T. Davis, D. Gao, T. Gureyev, A. Stevenson, and S.
Wilkins: Phase-contrast imaging of weakly absorbing materials using hard x-rays. Nature 373: 595-598 (1995).
6. M. Ando, K. Yamasaki, F. Toyofuku, et al: Attempt at visu-
단일 비산란 그리드 및 다색광 x-선원 기반 위상대조 x-선 영상화 실험 연구
연세대학교 방사선융합공학과, iTOMO
박연옥ㆍ조효성ㆍ임현우ㆍ제의규ㆍ박철규ㆍ조희문ㆍ김규석ㆍ김건아ㆍ박소영
본 연구에서는 단일 비산란 그리드 및 다색광 x-선원을 이용하여 위상대조 x-선 영상을 용이하게 구현할 수 있는 새로 운 방법을 제안한다. 제안된 신기법의 개념 입증을 위해 집속형 선형 그리드(200 lines/inch 선 밀도), 마이크로 초점 x-선 관(∼5 μm 초점크기), CMOS형 평판형 검출기(48 μm 픽셀 크기)로 실험장치를 구성하였으며, 한 번의 x-선 촬영(90 kVp, 0.1 mAs)으로 감약대조 x-선 영상과 향상된 가시성을 지진 산란 x-선 영상 및 차분 위상대조 x-선 영상을 Fourier변 조복원 기법을 적용하여 성공적으로 분리 획득하였다. 더 나아가, 감약대조 x-선 영상과 산란 x-선 영상을 합성함으로써 일반 감약대조 x-선 영상에서는 명확하게 볼 수 없는 샘플의 미세 구조를 보다 선명하게 나타냄을 확인하였다. 본 논문 에서 제안한 단일 비산란 그리드 기반 위상대조 x-선 영상화 기법은 실험 구성 및 절차가 단순하고 새로운 대조도에 기 반한 산란 및 위상대조 x-선 영상을 동시에 제공하기 때문에 차세대 x-선 영상화 신기법으로 다양한 응용분야에서 용이 하게 적용될 수 있을 것으로 전망한다.
중심단어: 위상대조 x-선 영상, 비산란 그리드, 마이크로 초점 x-선관, 산란영상 alizing breast cancer with x-ray dark field imaging. Japan J. Appl.
Phys. 44(17): L528-L531 (2005).
7. H. Wen, E. Bennett, M. Hegedus, and S. Rapacchi:
Fourier x-ray scattering radiography yields bone structural information. Radiology 251(3): 910-918 (2009).
8. H. Wen, E. Bennett, M. Hegedus, and S. Carroll: Spatial
harmonic imaging of x-ray scattering-Initial results. IEEE Trans.
Med. Imaging 27(8): 997-1002 (2008).
9. C. Kottler, C. David, F. Pfeiffer, and O. Bunk: A two-di- rectional approach for grating based differential phase contrast imaging using hard x-rays. Opt. Express 15: 1175–1181 (2007).