Plasma Components Affect Accuracy of Circulating Cancer-Related MicroRNA Quantitation
Dong-Ja Kim,* Sarah Linnstaedt,** Jaime Palma,*
Joon Cheol Park,
‡
Evangelos Ntrivalas,§¶
Joanne Y.H. Kwak-Kim,
‡¶
Alice Gilman-Sachs,§¶
Kenneth Beaman,
§¶
Michelle L. Hastings,储
Jeffrey N. Martin,†
and Dominik M. Duelli*††
From the Department of Pathology,* Chicago Medical School, North Chicago, Illinois; the Department of Epidemiology and Biostatistics,†University of California, San Francisco, California;
the Clinical Immunology Laboratory,§Reproductive Medicine, Department of Obstetrics and Gynecology,‡and Departments of Microbiology and Immunology,¶Cell Biology and Anatomy,储and Cellular and Molecular Pharmacology,††Rosalind Franklin University of Medicine and Science, North Chicago, Illinois; and the Department of Molecular Genetics and Microbiology,ⴱⴱDuke University Medical Center, Durham, North Carolina
Circulating microRNAs (miRNAs) have emerged as candidate biomarkers of various diseases and condi- tions including malignancy and pregnancy. This ap- proach requires sensitive and accurate quantitation of miRNA concentrations in body fluids. Herein we re- port that enzyme-based miRNA quantitation, which is currently the mainstream approach for identifying differences in miRNA abundance among samples, is skewed by endogenous serum factors that co-purify with miRNAs and anticoagulant agents used during collection. Of importance, different miRNAs were af- fected to varying extent among patient samples. By developing measures to overcome these interfering activities, we increased the accuracy, and improved the sensitivity of miRNA detection up to 30-fold. Over- all, the present study outlines key factors that prevent accurate miRNA quantitation in body fluids and pro- vides approaches that enable faithful quantitation of miRNA abundance in body fluids. ( J Mol Diagn 2012, 14:71– 80; DOI: 10.1016/j.jmoldx.2011.09.002)
MicroRNAs (miRNAs) are small non-coding RNA se- quences of approximately 19 to 22 nucleotides that modu- late the activity of specific mRNA targets in development, differentiation, or disease, typically by compromising mRNA stability or interfering with translation (reviewed by Almeida et al,1Corcoran et al,2Brase et al,3Zen and Zhang,4and Kosaka et al5). Recently, miRNAs circulating in body fluids, and in blood serum in particular, have emerged as promising markers of disease and other processes (re-
viewed in references1–5). This application raises the need to accurately identify and quantitate miRNAs in samples collected from patients.
The mainstream approach to identification and quan- tification of miRNAs uses quantitative RT-PCR (RT- qPCR). With RT-qPCR, changes in plasma and serum miRNA profiles have been reported to reflect various physiologic and pathologic conditions including diagnos- tic and prognostic values for colorectal, breast, gastric, lung, oral, ovarian, pancreatic, and prostate cancers and for leukemia and lymphoma1–5 and other diseases and conditions.6 –9 The increasing use of cell-free circulating miRNA for diagnostic and prognostic purposes, as for any such marker, requires assurance that the measured con- centration represents the actual amount in the samples.
Such assurance is often lacking.10The problem is exacer- bated by the common assumption that a protocol devel- oped for one study is applicable to other studies.11Overall, few methods12and improvements13have been offered,14 and commonly used approaches lack required accuracy.15 The objective of the present study was to standardize and optimize miRNA detection for biomarker studies. We quantified two miRNAs that are implicated in distinct pro- cesses. One was miR-16, which acts as a tumor suppres- sor, is UV-inducible, is p53-regulated, and is deregulated or lost in some cancers.16MiR-16 has also been used to normalize quantitation of circulating miRNAs in breast
Supported by the US Army Medical Research and Materiel Command under award W81XWH-08-1-0641, research grant 189903 from the Amer- ican Cancer Society of Illinois (D.M.D.), NIH grant R01 CA119903 (J.N.M.), and grant T32-AI007392/AI/NIAID NIH HHS (S.D.L.).
Accepted for publication September 6, 2011.
Opinions, conclusions, interpretations, and recommendations are those of the authors and are not necessarily endorsed by the US Army.
D.M.D., D.J.K., and S.L. conceived and designed the experiments;
D.J.K., S.L., and J.C.P. performed the experiments; D.M.D., D.J.K., S.L., M.L.H., and J.C.P. analyzed the data; E.N., J.K.-K., J.N.M., K.B., and M.L.H. contributed reagents/materials/analysis tools; and D.J.K. and D.M.D. wrote the article.
Supplemental material for this manuscript can be found athttp://jmd.
amjpathol.orgor atdoi: 10.1016/j.jmoldx.2011.09.002.
Current addresses: D.J.K., Pathology Laboratory of Shin, Daegu, South Korea; J.C.P., Department of Obstetrics and Gynecology, School of Med- icine, Keimyung University, Daegu, South Korea.
Address reprint requests to Dominik M. Duelli, Ph.D., Department of Pathology, Chicago Medical School, Rosalind Franklin University of Med- icine and Science, 3333 Green Bay Rd., North Chicago, IL 60064. E-mail:
Published by Elsevier Inc. All rights reserved.
DOI: 10.1016/j.jmoldx.2011.09.002
71
cancer studies.17–19 The other miRNA, miR-223, has been implicated in pregnancy, other conditions, and ma- lignant disease.6,20,21 Devising reliable approaches for accurate quantitation of circulating miRNAs is important for assessment of their potential as biomarkers.
Materials and Methods Collection of Blood Samples
Fresh blood samples (5 mL) were either collected from healthy adults, received from the Susan G. Komen Foun- dation for the Cure Tissue Bank at the IU Simon Cancer Center (Indiana University, Indianapolis, IN), or supplied by Jeffrey Martin, MD of the AIDS Cancer and Specimen Resource (University of California, San Francisco, CA).
Blood was collected in Vacutainer tubes (BD Diagnos- tics, La Jolla, CA) containing 10 mL heparin (sodium heparin, 143 USP units), 4.0 mL EDTA (EDTA, 7.2 mg), 4.5 mL sodium citrate (sodium citrate, 0.105 mmol/L), or 2 mL sodium fluoride and potassium oxalate (NaF/KOx, 5 mg/4 mg). Serum (7.5 mL) was collected in BD SST Vacutainer tubes (BD Diagnostics). Plasma was sepa- rated from red blood cells promptly to prevent loss of com- ponents22or hemolysis.23Blood was allowed to coagulate for 15 minutes at room temperature before prompt centrif- ugation. The study was approved by the Rosalind Franklin University of Medicine and Science institutional review board under protocols 004 and 005 PATH, and all donors provided written consent.
Processing of Blood Samples
Fresh plasma and serum were obtained by centrifugation of blood samples at 200 ⫻ g for 15 minutes at 4°C.
Supernatants were removed and collected in 15-mL poly- propylene tubes. The plasma was centrifuged twice at 800⫻ g for 15 minutes at 4°C to obtain cell-free plasma.
After the second centrifugation, supernatants were col- lected and passed through 0.45-m pore-size filters (Pall Corp., Port Washington, NY). Plasma and serum were divided into 200-, 50- and 10-L samples, and total vol- umes were adjusted to 200L using water. A synthetic RNA (SYNTH, formerly INT,18250 fmol/L) was added, and samples were analyzed immediately or were flash-frozen.
Heparinase Treatment of Samples
Digestion of plasma samples using heparinase I (H2519;
Sigma-Aldrich Corp., St. Louis, MO) was performed ac- cording to the manufacturer’s protocol, as follows. Hepa- rinase I (55 units) was dissolved at 1 mg/mL in 20 mmol/L Tris-HCl (pH 7.5), 50 mmol/L NaCl, 4 mmol/L CaCl2, and 0.01% bovine serum albumin, and was added to a final concentration of 143 USP units per 10 mL of sample, which is expected to nearly completely remove hepa- rin.24All digestions were performed for 1 hour at room temperature, and heparinase was removed using phenol- chloroform extractions.
Post-Collection Treatment of Samples Using NaF/KOx
NaF (S-6776; Sigma-Aldrich Corp.) and KOx (P5311;
Aqua Solutions, Deer Park, TX) were used for the exper- iments. Five milliliters blood was collected in NaF/KOx Vacutainer tubes containing 5 mg NaF and 4 mg KOx, effecting a final concentration of 1 g/L NaF and 0.8
g/L KOx (1X). Therefore, 50-L serum and EDTA sam- ples were supplemented with NaF/KOx at 8X (8 g/L NaF/6.4g/L KOx), 4X (4 g/L NaF/3.2 g/L KOx), 2X (2g/L NaF/1.6 g/L KOx), 1X (1 g/L NaF/0.8
g/L KOx), and 0.5X (0.5 g/L NaF/0.4 g/L KOx), as indicated.
Determination of Exosomal miRNA Stability in Blood Plasma and Whole Blood
Blood was collected in EDTA Vacutainer tubes. Half was processed to produce cell-free plasma, and the other half was left intact. To test the stability in blood of miRNAs released from cells in culture, aliquots of the plasma and serum were supplemented with exosomal miRNA of BC3 cells and incubated for the indicated time at 10°C in a continuously revolving tube rotator.
RNA Isolation
SDS was added to 200-L samples of plasma or serum for a final concentration of 0.5% where indicated. This preparation was extracted using 500L or 1 mL TRIzol LS reagent (Invitrogen Corp., Carlsbad, CA) and incu- bated for 10 minutes at room temperature followed by 100 or 200L chloroform. The mixture was centrifuged at 12,000 ⫻ g for 16 minutes, and the aqueous layer was transferred to a new tube. Where indicated, this prepa- ration was extracted one to three times using acidic phe- nol/chloroform (0966; Amresco Corp., Solon, OH). The resulting aqueous phase was transferred to a new tube and applied to a PureLink miRNA isolation kit (Invitrogen Corp.) as indicated, and was processed according to the manufacturer’s recommendations. RNA was eluted with 50 L RNase-free water and stored at ⫺70°C or used immediately.
Cell Culture
Exosomes and other particulates were collected from cells in culture as described.18In brief, after 5 days of culturing, the medium was collected, centrifuged at 300⫻ g for 15 minutes, and filtered through a 0.45-m filter to remove cell debris. The supernatant was centri- fuged at 70,000 ⫻ g to collect particulates including exosomes, and was resuspended with 100 L PBS.
BeWo cells were purchased from American Type Culture Collection (CCL-98; Manassas, VA) and cultured in F-12K (Mediatech, Inc., Manassas, VA) or RPMI 1640 (HyClone Laboratories, Inc., Logan, UT) with 10% or 20% fetal bovine serum. To remove bovine particulates, including exosomes, fetal bovine serum was ultracentrifuged at
70,000 ⫻ g for 2 hours, and the collected supernatant was added to culture medium. BC3 cells were cultured as described.25
Reverse Transcription
For studies using fresh plasma, serum, and samples from the Susan G. Komen Foundation for the Cure Tissue Bank, 10 L of the 50 L extracted RNA was used as input into a reverse transcriptase reaction (Superscript III;
Invitrogen Corp.) with miRNA-specific stem-loop primers in the Duelli laboratory as described.18,26. The thermal cycles used to amplify the samples were 65°C for 5 minutes, 50°C for 60 minutes, and 70°C for 15 minutes.
Samples from AIDS Cancer and Resource and samples including miRNAs released from BC3 cells were ana- lyzed using primers obtained from Applied Biosystems, Inc. (Foster City, CA), also using miRNA-specific stem- loop primers in the Cullen laboratory as described.26,27
MicroRNA Quantitation Using Taq-Based PCR
qPCR reactions were performed as described using SYBR Green or TaqMan (Applied Biosystems, Inc.), as noted.18Four percent of the cDNA produced in the re- verse transcriptase reaction was amplified in MicroAmp Optical 96-well reaction plates in triplicate 20-L reac- tions using a thermocycler (7900HT; Applied Biosystems, Inc.) using the cycles 95°C for 10 minutes, 40 cycles at 95°C for 15 seconds, 60°C for 1 minute, and hold at 4°C.
Raw data were analyzed using SDS Relative Quantitation Software version 2.2.3 (Applied Biosystems, Inc.), in gen- eral using the automatic cycle threshold (Ct) setting for assigning baseline and threshold for Ct determination.
MiRNA abundance was measured using computing amo- les based on comparing Ct values of samples with dilu- tions of a synthetic DNA corresponding to the cDNA produced at reverse transcription for each miRNA mea- sured to make a standard curve. The amplification effi- ciency, a measure of the number of template duplications per PCR amplification cycle, was calculated using the equation (T2/T1)[1/(CT2ave-CT1ave)]⫺1.28
PCR Using Other Polymerases
GoTaq Green (Promega Corp., Madison, WI) PCR was performed in 25-L volumes according to the manufac- turer’s instructions. The initial denaturation step was 5 minutes at 95°C, followed by 40 cycles of 15 seconds at 95°C, 30 seconds at 50°C, 30 seconds at 72°C, and a final extension of 5 minutes at 73°C.
Hemo KlenTaq29 (New England BioLabs, Inc., Ips- wich, MA) PCR18 was performed in 25-L volumes ac- cording to the manufacturer’s instructions, including at- tempts to reduce nonspecific priming by assembling PCR reactions on ice and transfer of reactions to the thermocycler preheated to 95°C. PCR using cocktails containing GoTaq DNA polymerase and Hemo KlenTaq polymerase were performed using GoTaq qPCR Mastermix (Promega Corp.) for SYBR Green
quantitation or TaqMan Universal PCR Mastermix (Ap- plied Biosystems, Inc.).
Phire and Phusion enzymes were used according to supplier specifications (New England Biolabs, Inc.) for end-point PCR or were used with GoTaq qPCR Master- mix (Promega Corp.) for SYBR Green or with TaqMan Universal PCR Mastermix (Applied Biosystems, Inc.) for quantitation.
Polyacrylamide Gel Electrophoresis
Native polyacrylamide gel electrophoresis (PAGE) of PCR products was performed as described.18A 10-bp ladder (marker; Invitrogen Corp.) was used for sizing PCR products in all experiments. Typically, 8 L of each PCR sample was analyzed using PAGE.
Statistical Analysis
Statistical analysis was performed using one-way analy- sis of variance followed by Tukey’s honestly significant difference test where indicated. Column graphed data are given as mean⫾1 SD. Data points were compared using the unpaired one-tailed Student’s t-test unless oth- erwise indicated, and P values are given in the text, figures, or legends as are the number of independent experiments.
Results
NaF and KOx Improve miRNA Quantitation
Various anticoagulants and blood stabilizers are used for collection of plasma but not serum. Therefore, we tested whether the choice of collection method affected miRNA quantitation. Blood was collected in Vacutainer tubes containing either an anticoagulant (EDTA, heparin, so- dium citrate, or NaF/KOx) or no anticoagulant. Blood was collected into the Vacutainer tubes in immediate succes- sion using a single venipuncture per person (see Mate- rials and Methods) to ensure nearly identical blood com- position at the time of blood collection. Blood was drawn from four individuals of different ethnic origin, sex, and age on three separate dates.
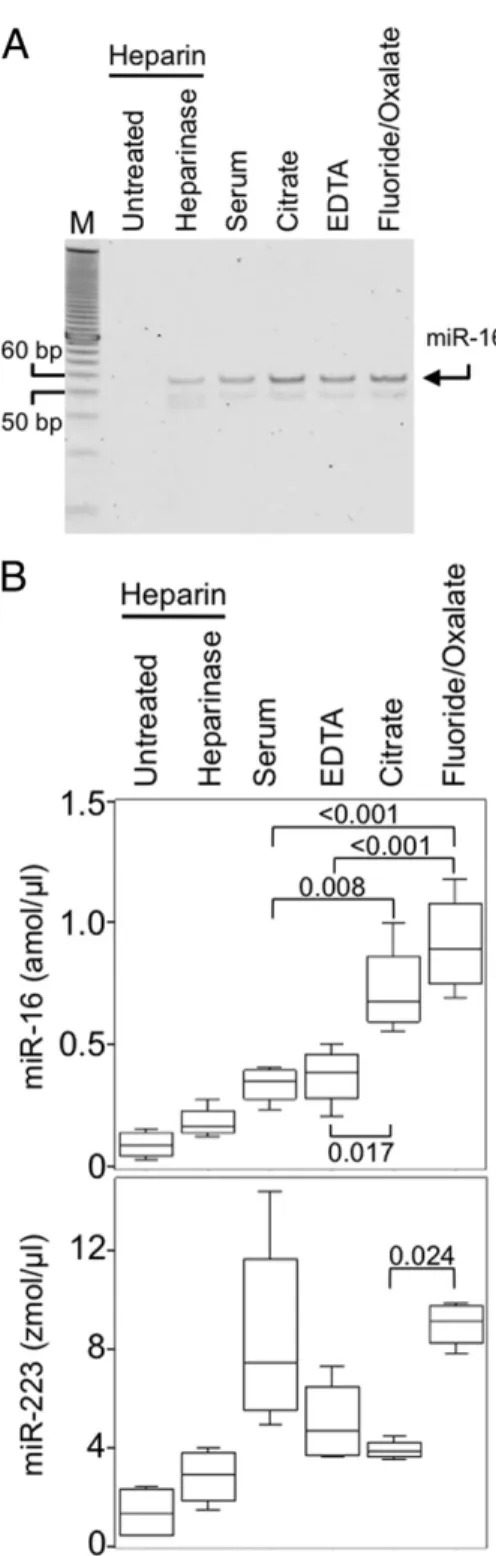
miRNA abundance was measured using RT-PCR (Figure 1A) and qPCR of reverse-transcribed miRNAs using SYBR Green (Figure 1B). Reproducibility of miRNA quantitation depended on the blood collection method, with best results obtained by collecting into tubes con- taining NaF/KOx (Figure 1B). Although in blood plasma, miR-16 is about 500-fold more abundant than miR-223, the recovery and accurate detection of both miRNAs depended on the plasma collection method. Therefore, differences in detection resulting from the choice of blood collection method likely applies to other circulating miRNAs regardless of abundance. Furthermore, quanti- tation of miR-223 in serum yielded more variable results than most other collection methods, which suggests that at least for some miRNAs, collection of blood as plasma and the choice of anticoagulant can improve detection.
NaF and KOx Improve the Sensitivity of miRNA Detection after Blood Collection
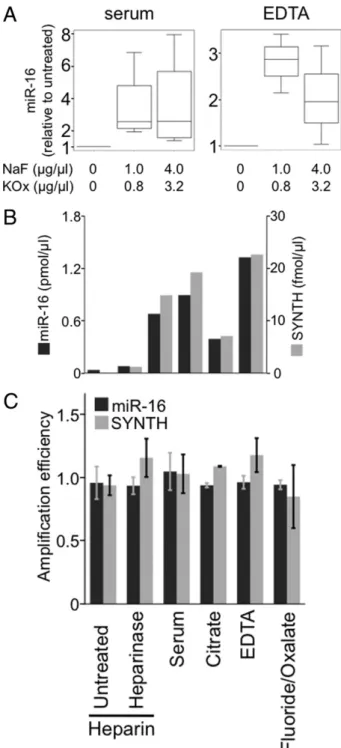
Maintenance of RNA stability during and after blood col- lection is an important factor for accurate miRNA quanti- tation and may depend on the anticoagulant used to collect the sample. For example, NaF/KOx is thought to enable greater sensitivity in the quantitation of other mol- ecules in the blood including glucose,22 alcohol, and opioids30by preventing their degradation at the time of collection and during storage.31We reasoned that the anticoagulants may differentially affect miRNA stability or detection by interfering with or promoting reactions used for quantitation. Therefore, we evaluated the ef- fect of NaF and KOx on quantitation of miRNAs col- lected using other blood-draw methods. NaF and KOx were added to frozen samples collected using two of the most common blood-draw methods, that is, serum and plasma collected into EDTA, and miR-16 was mea- sured in these samples (see Materials and Methods). It was observed that NaF and KOx increased miR-16 detection twofold in plasma collected using EDTA (P⫽ 0.037), and threefold in serum (P⫽ 0.014) (Figure 2A).
These results indicate that adding NaF and KOx en- hances miRNA quantitation even if these reagents are added after the samples are collected using other an- ticoagulants and stabilizers.
To address how NaF and KOx improve miRNA quan- titation, we assessed the effects of NaF and KOx individ- ually on miR-16 quantitation in serum. NaF increased the mean detection of miR-16 by 2.8-fold, and KOx increased sensitivity approximately 3.4-fold (see Supplemental Figure S1, A and B, athttp://jmd.amjpathol.org). However, the increases lacked statistical significance for each component alone, which suggests that NaF and KOx synergize to effectively increase detection of miRNAs or that they act differently in improvement of quantitation of miRNAs in serum.
NaF and KOx Increase Detection of Exogenous RNA
We considered that collecting plasma with NaF and KOx can improve detection by either stabilizing the RNA or increasing the amplification efficiency of the miRNAs dur- ing the PCR reaction.29,32To address the possibility that miRNAs are degraded by plasma ribonucleases,33 we quantified miRNA stability before miRNA extraction by comparing endogenous miR-16 concentrations with those of a synthetic 22-nucleotide RNA (SYNTH) added during the RNA extraction. It was observed that the quan- tity of RNA was similar for both SYNTH RNA and endog- enous miR-16 for each of the Vacutainer tubes (Figure 2B), which suggests that factors other than RNA stability in serum or plasma account for the differences in the sensitivity of RNA quantitation. Therefore, we tested whether the collection method affects PCR amplification efficiency. No significant changes were detected in the amplification efficiencies induced by the blood stabilizers or anticoagulants (Figure 2C). We concluded from this
Figure 1. Fluoride and oxalate increase quantitation efficiency of circulating miR- NAs. A: MiR-16 detection is affected by the blood collection method. Plasma and serum samples were collected from four individuals on three occasions. MiR-16 was amplified using RT-PCR, and was separated using PAGE. Arrow, miR-16 as deter- mined by sizing and sequencing. B: Collection of blood in the presence of EDTA, citrate, or NaF/KOx increases miRNA detection. MiR-16 and miR-223 were quantified using SYBR Green RT-qPCR approaches. Data were analyzed using one-way anal- ysis of variance followed by Tukey’s honestly significant difference test. Middle bar represents the median; top and bottom of the box represent the 75th and 25th percentiles, respectively. Tukey’s fences indicate the range of the values. P values are labeled above or below brackets. Chemicals listed indicate the coagulant and/or blood stabilization agents present in the particular Vacu- tainer tube used for the blood collection (see Materials and Methods).
Heparinase indicates addition of heparinase I to the sample (see Materials and Methods). Lower panel: MiR-223 detection is robust in NaF/KOx.
Detection of miR-16 or miR-223 was less in heparinized plasma than in serum. Heparinase treatment did not always improve detection of miR-16 (P⫽ 0.082) or miR-223 (P ⫽ 0.125) in heparinized plasma. DNA length of the bands in the marker is indicated by 50 and 60 bp.
result that none of the blood collection methods affect PCR amplification of reverse-transcribed miRNAs per se.
Hence, NaF and KOx may improve miRNA detection by enhancing miRNA yield during extraction by enhancing
the reverse transcriptase reaction or perhaps in general by stabilizing the extracted RNA or the cDNA.
The finding of strong parallels between SYNTH and miR-16 quantitation within each plasma and serum sam- ple supports the convention of using exogenous spiked RNAs as reference molecules for quantifying miRNA in plasma and serum. Alternatively, it was observed that quantitation of SYNTH added in a 4000-fold excess was much less affected by most collection methods (see Sup- plemental Figure S2 athttp://jmd.amjpathol.org). This re- sult suggests that high concentrations of RNA can overcome the interference of plasma components on miRNA quantitation and highlights the need to supply spiked RNA at similar concentrations as the endoge- nous RNA under investigation for accurate reference quantitation.
Inhibitors of Polymerases Present in Biological Samples Affect miRNA Detection
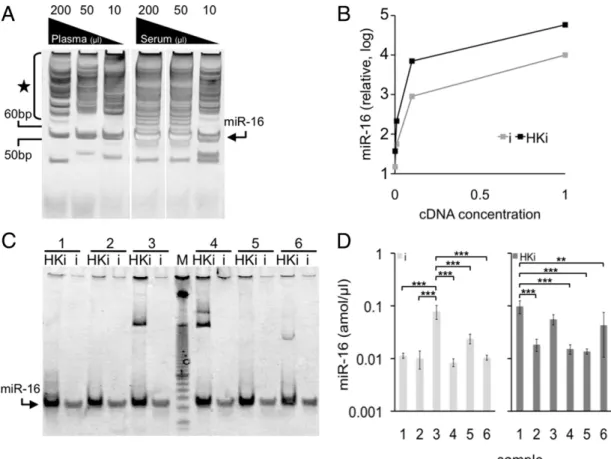
To assess the stability of miRNAs in blood, we added released miRNAs isolated from the media of cultured BC3 cells to PBS, plasma, and whole blood. It was ob- served that miR-16 could be detected up to 17 hours after addition to PBS but was undetectable in plasma after 2 hours or in whole blood after 17 hours of storage (Figure 3A). This destabilization effect could be due to miRNA degradation in the sample,34to components of blood plasma that co-purify with miRNAs and interfere with their detection,29,35–37or to both.
Therefore, we tested whether plasma RNA interferes with the detection of SYNTH RNA. SYNTH RNA was sup- plemented with TRIzol-extracted RNA preparations of plasma collected in EDTA Vacutainer tubes, and SYNTH RNA abundance was quantified (Figure 3B, left panel). It was observed that RNA extracted from blood plasma interfered with SYNTH RNA detection, indicating that in- hibitors of reverse transcriptase or PCR are present in RNA preparations extracted using TRIzol alone.
To determine the best method for removing serum and plasma inhibitors of miRNA detection, we applied ap- proaches to improve the purity of the isolated RNA. It was observed that incorporation of a single acidic phenol/
chloroform extraction step followed by adsorption of RNA on silica membranes reduced the interference by blood- borne polymerase inhibitors (Figure 3B, right panel) and effected a 4.4-fold increase in miRNA quantitation (Figure 3C). Other treatments such as addition of deter- gents38or ribonuclease inhibitors did not improve miRNA detection in serum or plasma (see Supplemental Figure S3 athttp://jmd.amjpathol.org), which suggests that com- ponents other than ribonucleases or other proteins were responsible for the interference. We concluded that en- richment of small RNAs using TRIzol and phenol/chloro- form extractions and silica adsorption effectively remove blood-borne reverse transcriptase and/or PCR inhibitors that prevent accurate quantitation of miRNAs in blood plasma.
Figure 2. Fluoride and oxalate improve detection of RNA regardless of origin. A: NaF/KOx was added at indicated concentrations to 50L-serum and plasma samples collected in EDTA. MiR-16 detection at both concentra- tions was increased (P⫽ 0.014 in serum, and P ⫽ 0.037 in EDTA plasma).
There was no statistical difference between the two concentrations of NaF/
KOx (P⫽ 0.827 for serum, and P ⫽ 0.275 for EDTA plasma) (n ⫽ 3). B:
Synthetic RNA (SYNTH) was added at 250 fmol/L during addition of TRIzol to the serum samples or plasma collected using indicated additives. The effectiveness of SYNTH quantitation was compared with that of endogenous miR-16. C: Amplification efficiency of miR-16 and SYNTH in qPCR was measured and compared with that of serum. For miR-16: heparin, P⫽ 0.58;
heparin plus heparinase, P⫽ 0.43; EDTA, P ⫽ 0.41; citrate, P ⫽ 0.52; and KOx, P⫽ 0.43. For SYNTH: heparin, P ⫽ 0.53; heparin plus heparinase, P ⫽ 0.49; EDTA, P⫽ 0.63; Citrate, P ⫽ 0.41; and KOx, P ⫽ 0.47. (All n ⫽ 3.)
Plasma Volume Affects miRNA Detection and Quantitation
The presence of inhibitors of miRNA detection in blood suggests that the greater the plasma or serum starting material used to extract the miRNA, the greater the abun- dance of co-purified blood-borne inhibitors of RT-PCR.
Thus, we tested whether dilution of starting material af- fects the efficiency of detection. To do so, we quantified miRNA extracted from 10, 50, or 200L fresh serum or plasma. It was observed that 50 L serum improved detection of miRNA by end-point PCR (Figure 3D) and yielded an 11-fold increase in the sensitivity of miRNA detection using SYBR Green or TaqMan qPCR (Figure 3E), perhaps reflecting a balance between miRNA and inhibitor abundance. To test whether similar concentration effects also apply to stored samples, we tested plasma collected in EDTA Vacutainer tubes from patients infected with HIV and Kaposi’s sarcoma–asso- ciated herpesvirus and stored for several months. It was observed that, similar to fresh samples, detection of miR-16 abundance was about threefold more sensitive at 50L than at 10 or 200 L (Figure 3E). These data are consistent with the counterintuitive idea that using more blood for detecting miRNA results in less efficient detec- tion than using less blood. Because this effect was ob- served in both plasma and serum, the latter of which is collected in the absence of additives, we concluded that inhibitors of miRNA detection are inherent in blood rather than introduced by chemicals used for collection. Of im-
portance, by reducing the starting material, inhibitors were presumed to be diluted below a threshold of inter- ference. Thus, careful titration of starting material yields more accurate miRNA quantitation.
Heparinase Treatment of Plasma Increases miRNA Detection
Heparin is an endogenous component of blood and is one of the original anticoagulants used in medicine. In some instances such as when analyzing historical sam- ples or evaluating the blood of patients receiving heparin regimens because of deep venous thrombosis, stroke, or pulmonary embolism or during organ transplantation or heart surgery, heparinized plasma may be the only source of miRNA. In these cases, it is important to eval- uate the effect of heparin on miRNA quantitation. We observed that miRNA quantified from heparinized plasma gave a poor yield (Figure 1), consistent with RT-PCR inhibition by heparin.39In testing whether reducing the starting volume could improve detection, we observed that using less starting material enabled detection of miR-16 from heparinized blood. However, greater dilu- tions were required to effect similar detection as in plasma collected using other methods (compare Figures 3D andFigure 4A). Therefore, we tested whether miRNA detection can be improved by digesting heparin with lyase heparinase I before RT-PCR.24,40 This treat- ment enabled detection and quantitation of previously
Figure 3. Removal of blood plasma and serum components that inhibit detection of circulating MiRNA using organic extraction and silica-based RNA enrichment.
A: Particulate miR-16 released from cells and added to plasma or whole blood is not detectable within 17 hours. Particulate RNAs released from BC3 cells was incubated in PBS, plasma, or blood for the indicated time, and miR-16 was quantified using TaqMan RT-qPCR. Portions of miR-16 in 2-hour blood samples are likely of whole-blood origin. B: Phenol/chloroform extraction and silica absorption of RNA remove inhibitors of miRNA detection. RNA was isolated from plasma collected in EDTA using TRIzol only (left panel) or TRIzol followed by one extraction of phenol/chloroform and enrichment of small RNAs on a silica membrane (right panel), and cDNA was added to a standard PCR reaction to quantify SYNTH RNA. RNA was added at the same concentration used in a standard RT-qPCR reaction (indicated by “1” above the gel), and 10-fold dilutions thereof (10⫺1, 10⫺2, 10⫺3). C: Enhanced detection of miR-16 in plasma extracted via phenol/chloroform and silica absorption. Plasma preparations were extracted using indicated numbers of phenol/chloroform extractions, followed by absorption to silica, or were directly assessed using RT-qPCR. D and E: Low volumes of plasma or serum effect greater detection of miRNAs. Indicated volumes of serum extracted using TRIzol were subjected to end-point PCR for miR-16, and were separated using PAGE. Solid circles indicate amplification-independent products.
MiR-16 was quantified in EDTA plasma immediately after collection or after storage at⫺80°C.
undetectable miRNAs (Figure 4, B and C). We concluded that heparinase can increase detection of miRNAs in heparinized plasma. These results suggest that, when possible, heparin tubes should not be used in miRNA analysis. Alternatively, heparinase treatment provides an approach to detection of miRNAs when use of heparin is unavoidable or when heparin is present in previously collected samples.
Mutant TaqDNA Polymerase Improves Quantitation of miRNA
An alternative approach to avert interference from blood- borne inhibitors of RT-PCR is to use different poly- merases 29,35–37,41. We tested enzymes reported to be more resistant to inhibitors: Phusion, Phire, and Hemo KlenTaq. Hemo KlenTaq is a mutant Taq DNA polymer- ase that has 100-fold lower sensitivity to blood inhibitors than does wild-type Taq.29 Our analysis indicates that Hemo KlenTaq amplified miR-16, more efficiently than did Phusion (Figure 5A; see also Supplemental Figure S4A athttp://jmd.amjpathol.org), and standard Taq DNA polymerase yielded low or no detectable PCR prod- ucts in the same samples (Figure 3D). However, initial attempts to adopt these enzymes for qPCR of miRNAs using TaqMan failed (see Supplemental Figure S4B at http://jmd.amjpathol.org). It is likely that for Hemo KlenTaq, quantitation was compromised by production of multiple spurious bands in addition to the correct band (Figure 5A; see also Supplemental Figure S4 at http://
jmd.amjpathol.org). We tested whether this lack of spec- ificity is a general property of Hemo KlenTaq by evaluat- ing the purity of amplifying miR-16 released from BeWo cells in culture. We detected only the correct miR-16 PCR product. However, supplementing such PCR reactions with blood plasma cDNA was sufficient to give rise to the
Figure 4. Heparin interference with detection of miRNA is relieved via heparinase treatment. Plasma was collected in Vacutainer tubes containing sodium heparin, and indicated volumes of plasma were assessed using end-point PCR (A). RT-PCR was performed after treatment with heparinase I (⫹) or on RNA without heparinase treatment (⫺). PCR products for miR-16 (B) and miR-223 (C) were assessed using PAGE.
Figure 5. Mutant TaqDNA polymerase, Hemo KlenTaq improves the sensitivity of miRNA detection. A: Hemo KlenTaq (HK) was used to detect miR-16 (arrows) in 200, 50, and 10L plasma and serum (seeFigure 3C). Additional PCR products are indicated by a star. B: TaqMan qPCR of dilutions of reverse-transcribed miR-16 in serum or NaF/KOx plasma and using an intact Taq polymerase (i) plus Hemo KlenTaq (HKi) as indicated. C: PAGE of miR-16 amplified with HKi or i from six individuals (1 to 6). D: Absolute quantitation of miR-16 amplification products. **P⬍ 0.01; ***P ⬍ 0.001 (Tukey-Kramer multiple comparisons test).
extra products regardless of attempts to purify cDNA further before PCR amplification (see Supplemental Fig- ure S5 athttp://jmd.amjpathol.org). This finding suggests that the complexity or other properties of blood cDNA interfere with exclusive amplification of the miRNAs of interest and cause nonspecific cDNA amplification. This phenomenon may be a consequence of lack of the edit- ing and proofreading 5=-⬎3= exonuclease domain in Hemo KlenTaq.32
Complementing Enzyme Cocktail for Effective Amplification of Products
To overcome the limitations of Hemo KlenTaq, we tested whether the reduced proof-reading activity of Hemo KlenTaq could be complemented by an intact Taq poly- merase. It was observed that Hemo KlenTaq in combi- nation with intact Taq polymerases amplified specific PCR products suitable for qPCR using SYBR Green or TaqMan (Figures 5, B and C; see also Supplemental Figure S6A at http://jmd.amjpathol.org). Of importance, the complementing Taq polymerases produced, on av- erage, approximately 30-fold more amplification prod- ucts from plasma miR-16 than did the intact polymerase alone (see Supplemental Figure S6B at http://jmd.
amjpathol.org), which suggests that overcoming blood- borne inhibitors of Taq polymerase using Hemo KlenTaq yields an overall increase in detection sensitivity and specificity of circulating miRNAs.
Mir-16 Quantitation Sensitive to Method of Detection
To test whether overcoming endogenous inhibitors with complementing polymerases provides proportionally
higher miRNA quantitation, we analyzed circulating miRNAs in the blood of six healthy individuals (see Sup- plemental Figure S7 athttp://jmd.amjpathol.org). Five of the six individuals tested demonstrated similar miR-16 plasma concentrations regardless of the approach used, thus validating the use of complementing enzymes for improved detection of circulating miRNAs. With each approach, one individual consistently exhibited higher plasma miR-16 abundance than did the others (Figure 5D). However, another individual in either approach exhibited higher miR-16 concentrations, which sug- gests that quantitation of circulating miR-16, which is used as a reference miRNA or a biomarker of some cancers,16 –19depends on the PCR conditions. These results suggest that differences in plasma composition among individual donors can yield different miRNA measurements.
Discussion
This study demonstrates that inherent differences in bio- logical samples and the methods used to collect and analyze them can dramatically affect the detection and quantitation of miRNAs. The implications of the work are that without consideration of the variables we have iden- tified, miRNA quantitation of human samples may not be reliable for the purpose of biomarker development. Our results suggest that failure to detect plasma miRNAs may be due to polymerase inhibitors rather than to the ab- sence of miRNA. Such inhibitors may include hemoglo- bin,42lactoferrin,36and IgG,43which can co-purify with nucleic acids.37 This limitation can be overcome with concomitant use of two complementing Taq poly- merases: Hemo KlenTaq, which is resistant to blood- borne inhibitors, in combination with another intact poly-
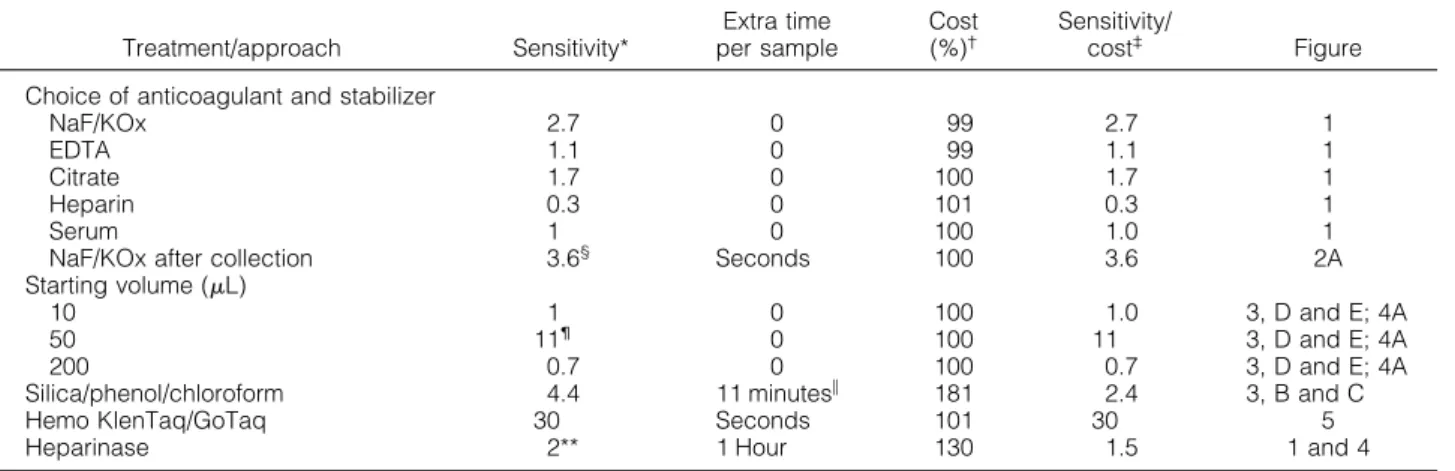
Table 1. Effectiveness of Various Treatments in miRNA Detection
Treatment/approach Sensitivity*
Extra time per sample
Cost (%)†
Sensitivity/
cost‡ Figure
Choice of anticoagulant and stabilizer
NaF/KOx 2.7 0 99 2.7 1
EDTA 1.1 0 99 1.1 1
Citrate 1.7 0 100 1.7 1
Heparin 0.3 0 101 0.3 1
Serum 1 0 100 1.0 1
NaF/KOx after collection 3.6§ Seconds 100 3.6 2A
Starting volume (L)
10 1 0 100 1.0 3, D and E; 4A
50 11¶ 0 100 11 3, D and E; 4A
200 0.7 0 100 0.7 3, D and E; 4A
Silica/phenol/chloroform 4.4 11 minutes储 181 2.4 3, B and C
Hemo KlenTaq/GoTaq 30 Seconds 101 30 5
Heparinase 2** 1 Hour 130 1.5 1 and 4
*Approximate fold difference in detected abundance compared with serum miR-16.
†Material cost per sample, calculated as percent of total cost of serum miR-16 detection using TaqMan, in $US, based on list price of materials used in the study, which was $9.25 for triplicate TaqMan.
‡Increase in sensitivity returned per material investment.
§2.4-Fold when supplemented to EDTA plasma.
¶Threefold in frozen samples.
储Extra total time spent on adsorption per sample is gained by elimination of the chilling step for precipitation of RNA (1⫹ hour) using the standard method. However, there is an increase in active labor, which, depending on the number of samples processed, may by substantial.
**Fold of plasma collected in heparin. Ranges from statistically nonsignificant changes (Figure 1) to detecting signal only after heparinase treatment (Figure 4).
merase that has effective proofreading ability. In addition, the study demonstrates that diluting out inhibitors from blood samples also provides salient improvements in miRNA detection (Table 1). Additional purification of plasma or serum miRNA preparations, using organic ex- traction and silica adsorption to remove inhibitors, also increased the detection, albeit at greater cost in labor and funds.
The inability to detect specific miRNAs in plasma or serum, in many cases, reflects the low abundance of particular miRNAs in the circulation. For example, the release of some miRNAs from cells into blood is limited or selective.18,44,45 Furthermore, depending on the nature of the complex that circulating miRNAs are associated with,18,34,46 –52 some miRNAs may be more stable than others34to the degradation by plasma ribonucleases or may be more amenable to amplification by polymerases.
When usual techniques fail, the improvements outlined herein enable quantitation of miRNAs with low abun- dance and are expected to increase the repertoire of miRNAs that can be analyzed as potential biomarkers of disease.
The mechanism by which some of the approaches, for example, use NaF/KOx, improve detection is unclear. It is possible that NaF effects higher cDNA stability during the reverse transcriptase reaction, rather than stabilizing in- put miRNA, because classic experiments identified NaF as an inhibitor of RNase H,53an enzyme that degrades RNA and DNA hybrid substrates. However, KOx may promote miRNA detection by reducing calcium, an inhib- itor of Taq, in the blood sample.41
Of interest, the absolute quantity of circulating miR-16 measured in the blood of some individuals differed de- pending on the enzyme used. These differences raise the possibility that factors including diet,54exercise,55circa- dian rhythms,56and seasons,57,58which alter the blood chemistry, might ultimately affect miRNA detection and quantitation. The disparate effectiveness of miRNA de- tection in an individual’s plasma or serum may be indic- ative of other physiologic and pathogenic properties of the blood including endogenous heparin concentra- tions59or familial disease.60Our results demonstrate that such variations in blood chemistry can affect detection of miRNAs and must be considered and neutralized to ac- curately and efficiently assess miRNA abundance in blood serum and plasma.
Acknowledgments
We thank the women who donated blood to the Susan G. Komen Foundation for the Cure Tissue Bank at the IU Simon Cancer Center and the tissue bank for mak- ing the blood samples available to us. We also thank Lorraine Ellis for performing phlebotomy, Alicia Case for assistance with statistical analysis, and Yuri Lazeb- nik and Judy Potashkin for critical review of the manuscript.
References
1. Almeida MI, Reis RM, Calin GA: MicroRNA history: discovery, recent applications, and next frontiers. Mutat Res 2011, [Epub ahead of press March 30, 2011]
2. Corcoran C, Friel AM, Duffy MJ, Crown J, O’Driscoll L: Intracellular and extracellular microRNAs in breast cancer. Clin Chem 2011, 57:
18 –32
3. Brase JC, Wuttig D, Kuner R, Sultmann H: Serum microRNAs as non-invasive biomarkers for cancer. Mol Cancer 2010, 9:306 4. Zen K, Zhang CY: Circulating MicroRNAs: a novel class of biomarkers
to diagnose and monitor human cancers. Med Res Rev 2010, [Epub ahead of press November 9, 2010] doi:10.1002/med.20215 5. Kosaka N, Iguchi H, Ochiya T: Circulating microRNA in body fluid: a
new potential biomarker for cancer diagnosis and prognosis. Cancer Sci 2010, 101:2087–2092
6. Chen X, Ba Y, Ma L, Cai X, Yin Y, Wang K, Guo J, Zhang Y, Chen J, Guo X, Li Q, Li X, Wang W, Wang J, Jiang X, Xiang Y, Xu C, Zheng P, Zhang J, Li R, Zhang H, Shang X, Gong T, Ning G, Zen K, Zhang CY:
Characterization of microRNAs in serum: a novel class of biomarkers for diagnosis of cancer and other diseases. Cell Res 2008, 18:997–
1006
7. Go AT, Visser A, van Dijk M, Mulders MA, Eijk P, Ylstra B, Blankenstein MA, van Vugt JM, Oudejans CB: A novel method to identify syncy- tiotrophoblast-derived RNA products representative of trisomy 21 placental RNA in maternal plasma. Methods Mol Biol 2008, 444:291–
302
8. Zhang Y, Jia Y, Zheng R, Guo Y, Wang Y, Guo H, Fei M, Sun S:
Plasma microRNA-122 as a biomarker for viral-, alcohol-, and chem- ical-related hepatic diseases. Clin Chem 2010, 56:1830 –1838 9. Hung EC, Chiu RW, Lo YM: Detection of circulating fetal nucleic
acids: a review of methods and applications. J Clin Pathol 2009, 62:308 –313
10. Bustin SA, Nolan T: Pitfalls of quantitative real-time reverse-transcrip- tion polymerase chain reaction. J Biomol Tech 2004, 15:155–166 11. Nolan T, Hands RE, Bustin SA: Quantification of mRNA using real-
time RT-PCR. Nat Protoc 2006, 1:1559 –1582
12. Kroh EM, Parkin RK, Mitchell PS, Tewari M: Analysis of circulating microRNA biomarkers in plasma and serum using quantitative re- verse transcription–PCR (qRT-PCR). Methods 2010, 50:298 –301 13. Andreasen D, Fog JU, Biggs W, Salomon J, Dahslveen IK, Baker A,
Mouritzen P: Improved microRNA quantification in total RNA from clinical samples. Methods 2010, 50:S6 –S9
14. Tzimagiorgis G, Michailidou EZ, Kritis A, Markopoulos AK, Kouidou S:
Recovering circulating extracellular or cell-free RNA from bodily flu- ids. Cancer Epidemiol 2011, [Epub ahead of press April 20, 2011]
doi:10.1016/j.canep.2011.02.016
15. Moltzahn F, Olshen AB, Baehner L, Peek A, Fong L, Stoppler H, Simko J, Hilton JF, Carroll P, Blelloch R: Microfluidic-based multiplex qRT-PCR identifies diagnostic and prognostic microRNA signatures in the sera of prostate cancer patients. Cancer Res 2011, 71:550 –560 16. Aqeilan RI, Calin GA, Croce CM: miR-15a and miR-16-1 in cancer:
discovery, function and future perspectives. Cell Death Differ 2010, 17:215–220
17. Davoren PA, McNeill RE, Lowery AJ, Kerin MJ, Miller N: Identification of suitable endogenous control genes for microRNA gene expression analysis in human breast cancer. BMC Mol Biol 2008, 9:76 18. Pigati L, Yaddanapudi SC, Iyengar R, Kim DJ, Hearn SA, Danforth D,
Hastings ML, Duelli DM: Selective release of microRNA species from normal and malignant mammary epithelial cells. PLoS One 2010, 5:e13515
19. Zhu W, Qin W, Atasoy U, Sauter ER: Circulating microRNAs in breast cancer and healthy subjects. BMC Res Notes 2009, 2:89
20. Montenegro D, Romero R, Pineles BL, Tarca AL, Kim YM, Draghici S, Kusanovic JP, Kim JS, Erez O, Mazaki-Tovi S, Hassan S, Espinoza J, Kim CJ: Differential expression of microRNAs with progression of gestation and inflammation in the human chorioamniotic membranes.
Am J Obstet Gynecol 2007, 197:289e1-e6
21. Pineles BL, Romero R, Montenegro D, Tarca AL, Han YM, Kim YM, Draghici S, Espinoza J, Kusanovic JP, Mittal P, Hassan SS, Kim CJ:
Distinct subsets of microRNAs are expressed differentially in the human placentas of patients with preeclampsia. Am J Obstet Gyne- col 2007, 196:261.e1-e6
22. Waring WS, Evans LE, Kirkpatrick CT: Glycolysis inhibitors negatively bias blood glucose measurements: potential impact on the reported prevalence of diabetes mellitus. J Clin Pathol 2007, 60:820 – 823 23. Oremek GM, Gerstmeier F, Sauer-Eppel H, Sapoutzis N, Wechsel
HW: Pre-analytical problems in the measurement of tumor type pyru- vate kinase (tumor M2-PK). Anticancer Res 2003, 23:1127–1130 24. Johnson ML, Navanukraw C, Grazul-Bilska AT, Reynolds LP, Redmer
DA: Heparinase treatment of RNA before quantitative real-time RT- PCR. Biotechniques 2003, 35:1140 –1142, 1144
25. Arvanitakis L, Mesri EA, Nador RG, Said JW, Asch AS, Knowles DM, Cesarman E: Establishment and characterization of a primary effu- sion (body cavity– based) lymphoma cell line (BC-3) harboring Ka- posi’s sarcoma–associated herpesvirus (KSHV/HHV-8) in the ab- sence of Epstein-Barr virus. Blood 1996, 88:2648 –2654
26. Chen C, Ridzon DA, Broomer AJ, Zhou Z, Lee DH, Nguyen JT, Barbisin M, Xu NL, Mahuvakar VR, Andersen MR, Lao KQ, Livak KJ, Guegler KJ: Real-time quantification of microRNAs by stem-loop RT- PCR. Nucleic Acids Res 2005, 33:e179
27. Linnstaedt SD, Gottwein E, Skalsky RL, Luftig MA, Cullen BR: Virally induced cellular microRNA miR-155 plays a key role in B-cell immor- talization by Epstein-Barr virus. J Virol 2010, 84:11670 –11678 28. Cikos S, Bukovska A, Koppel J: Relative quantification of mRNA:
comparison of methods currently used for real-time PCR data analy- sis. BMC Mol Biol 2007, 8:113
29. Kermekchiev MB, Kirilova LI, Vail EE, Barnes WM: Mutants of Taq DNA polymerase resistant to PCR inhibitors allow DNA amplification from whole blood and crude soil samples. Nucleic Acids Res 2009, 37:e40
30. Jones AW: Are changes in blood-ethanol concentration during stor- age analytically significant? importance of method imprecision. Clin Chem Lab Med 2007, 45:1299 –1304
31. Lopez JB, Peng CL: Can fluoride-oxalate and sodium citrate stabilise homocysteine levels after blood collection?. Clin Chem Lab Med 2003, 41:1369 –1372
32. Barnes WM: The fidelity of Taq polymerase catalyzing PCR is im- proved by an N-terminal deletion. Gene 1992, 112:29 –35 33. Rio DC, Ares M Jr, Hannon GJ, Nilsen TW: Purification of RNA using
TRIzol (TRI reagent). Cold Spring Harb Protoc 2010, pdb.prot5439 34. Arroyo JD, Chevillet JR, Kroh EM, Ruf IK, Pritchard CC, Gibson DF,
Mitchell PS, Bennett CF, Pogosova-Agadjanyan EL, Stirewalt DL, Tait JF, Tewari M: Argonaute2 complexes carry a population of circulating microRNAs independent of vesicles in human plasma. Proc Natl Acad Sci USA 2011, 108:5003–5008
35. Abu Al-Soud W, Radstrom P: Capacity of nine thermostable DNA polymerases to mediate DNA amplification in the presence of PCR- inhibiting samples. Appl Environ Microbiol 1998, 64:3748 –3753 36. Al-Soud WA, Radstrom P: Purification and characterization of PCR-
inhibitory components in blood cells. J Clin Microbiol 2001, 39:485–
493
37. de Franchis R, Cross NC, Foulkes NS, Cox TM: A potent inhibitor of Taq polymerase copurifies with human genomic DNA. Nucleic Acids Res 1988, 16:10355
38. Rio DC, Ares M Jr, Hannon GJ, Nilsen TW: Purification of RNA by SDS solubilization and phenol extraction. Cold Spring Harb Protoc 2010, pdb.prot5438
39. Taylor AC: Titration of heparinase for removal of the PCR-inhibitory effect of heparin in DNA samples. Mol Ecol 1997, 6:383–385 40. Tsai M, Miyamoto M, Tam SY, Wang ZS, Galli SJ: Detection of mouse
mast cell–associated protease mRNA: heparinase treatment greatly improves RT-PCR of tissues containing mast cell heparin. Am J Pathol 1995, 146:335–343
41. Eilert KD, Foran DR: Polymerase resistance to polymerase chain reaction inhibitors in bone. J Forensic Sci 2009, 54:1001–1007 42. Akane A, Matsubara K, Nakamura H, Takahashi S, Kimura K: Identi-
fication of the heme compound copurified with deoxyribonucleic acid
(DNA) from bloodstains, a major inhibitor of polymerase chain reaction (PCR) amplification. J Forensic Sci 1994, 39:362–372 43. Al-Soud WA, Jonsson LJ, Radstrom P: Identification and character-
ization of immunoglobulin G in blood as a major inhibitor of diagnostic PCR. J Clin Microbiol 2000, 38:345–350
44. Ohshima K, Inoue K, Fujiwara A, Hatakeyama K, Kanto K, Watanabe Y, Muramatsu K, Fukuda Y, Ogura S, Yamaguchi K, Mochizuki T:
Let-7 microRNA family is selectively secreted into the extracellular environment via exosomes in a metastatic gastric cancer cell line.
PLoS One 2010, 5:e13247
45. Collino F, Deregibus MC, Bruno S, Sterpone L, Aghemo G, Viltono L, Tetta C, Camussi G: Microvesicles derived from adult human bone marrow and tissue specific mesenchymal stem cells shuttle selected pattern of miRNAs. PLoS One 2010, 5:e11803
46. Vickers KC, Palmisano BT, Shoucri BM, Shamburek RD, Remaley AT:
MicroRNAs are transported in plasma and delivered to recipient cells by high-density lipoproteins. Nat Cell Biol 2011, 13:423– 433 47. Wang K, Zhang S, Weber J, Baxter D, Galas DJ: Export of microRNAs
and microRNA-protective protein by mammalian cells. Nucleic Acids Res 2010, 38:7248 –7259
48. Pegtel DM, Cosmopoulos K, Thorley-Lawson DA, van Eijndhoven MA, Hopmans ES, Lindenberg JL, de Gruijl TD, Wurdinger T, Middeldorp JM: Functional delivery of viral miRNAs via exosomes, Proc Natl Acad Sci USA 2010, 107:6328 – 6333
49. Valadi H, Ekstrom K, Bossios A, Sjostrand M, Lee JJ, Lotvall JO:
Exosome-mediated transfer of mRNAs and microRNAs is a novel mechanism of genetic exchange between cells. Nat Cell Biol 2007, 9:654 – 659
50. Taylor DD, Gercel-Taylor C: MicroRNA signatures of tumor-derived exosomes as diagnostic biomarkers of ovarian cancer. Gynecol On- col 2008, 110:13–21
51. Skog J, Wurdinger T, van Rijn S, Meijer DH, Gainche L, Curry WT Jr, Carter BS, Krichevsky AM, Breakefield XO: Glioblastoma mi- crovesicles transport RNA and proteins that promote tumour growth and provide diagnostic biomarkers. Nat Cell Biol 2008, 10:1470 – 1476
52. Tsui NB, Ng EK, Lo YM: Stability of endogenous and added RNA in blood specimens, serum, and plasma. Clin Chem 2002, 48:1647–
1653
53. Samuel KP, Papas TS, Chirikjian JG: DNA endonucleases associated with the avian myeloblastosis virus DNA polymerase. Proc Natl Acad Sci USA 1979, 76:2659 –2663
54. Li D: Chemistry behind vegetarianism. J Agric Food Chem 2011, 59:777–784
55. Liu S, Shi W, Li G, Jin B, Chen Y, Hu H, Liu L, Xie F, Chen K, Yin D:
Plasma reactive carbonyl species levels and risk of nonalcoholic fatty liver disease. J Gastroenterol Hepatol 2011, 26:1010 –1015 56. Vaughn LK, Denning G, Stuhr KL, de Wit H, Hill MN, Hillard CJ:
Endocannabinoid signalling: has it got rhythm? Br J Pharmacol 2010, 160:530 –543
57. Brisson J, Berube S, Diorio C, Sinotte M, Pollak M, Masse B: Syn- chronized seasonal variations of mammographic breast density and plasma 25-hydroxyvitamin D. Cancer Epidemiol Biomarkers Prev 2007, 16:929 –933
58. Radke KJ, Izzo JL Jr: Seasonal variation in haemodynamics and blood pressure-regulating hormones. J Hum Hypertens 2010, 24:
410 – 416
59. Wladyslaw S: Endogenous heparin: a protective marker in patients with myocardial infarction. Coronary Artery Dis 2002, 13:423– 426 60. Kocic G, Bjelakovic G, Saranac L, Kocic R, Jevtovic T, Sokolovic D,
Nikolic G, Pavlovic D, Stojanovic S: Altered degradation of circulating nucleic acids and oligonucleotides in diabetic patients. Diabetes Res Clin Pract 2008, 79:204 –213