The Optimal Parameter for Radiation Dose in Pediatric Low Dose Abdominal CT: Cross-sectional Dimensions versus Body Weight1
Yoon Young Jung, M.D., Hyun Woo Goo, M.D.
1Department of Radiology and Research Institute of Radiology, Asan Medical Center, University of Ulsan, College of Medicine, Seoul, 138-736, South Korea Received October 1, 2007 ; Accepted December 5, 2007
Address reprint requests to : Hyun Woo Goo, M.D., Department of Radiology, Asan Medical Center, 388-1 Poongnap-dong, Songpa-gu, Seoul, 138-736, South Korea.
Tel. 82-2-3010-4400 Fax. 82-2-476-4719 E-mail: hwgoo@amc.seoul.kr
Purpose: To investigate the best parameter between cross-sectional dimensions and body weight in pediatric low dose abdominal CT.
Materials and Methods: One hundred and thirty six children consecutively underwent weight-based abdominal CT. The subjects consisted of group 1 (79 children, weight range 10.0-19.9 kg) and group 2 (57 children, weight range 20.0-39.9 kg). Abdominal cross-sectional dimensions including circumference, area, anteroposterior diameters and transverse diameters were calculated. Image noise (standard deviation of CT den- sity) was measured by placing a region of interest in the posterior segment of the right hepatic lobe on a CT image at the celiac axis. The measured image noise was correlat- ed with the cross-sectional abdominal dimensions and body weight for subjects in each group.
Results: In group 1 subjects, area, circumference, transverse diameter, anteroposterior diameter, and body weight showed a significant positive correlation with image noise in descending order (γ= 0.63, 0.62, 0.61, 0.51, and 0.49; p<0.0001). In group 2 sub- jects, transverse diameter, circumference, area, anteroposterior diameter, and body weight showed a significant positive correlation with image noise in descending order (γ= 0.83, 0.82, 0.78, 0.71, and 0.71; p<0.0001).
Conclusion: Cross-sectional dimensions such as area, circumference, and transverse diameter showed a higher positive correlation with image noise than body weight for pediatric low dose abdominal CT.
Index words :Children Abdomen, CT
Computed tomography (CT), radiation exposure Computed tomography (CT), quality assurance Body weight
Imaging parameters in pediatric CT should be mini- mized to the level of diagnostic quality as children have greater radiosensitivity, are exposed to a greater mean radiation dose due to the small size of the body, and chil- dren have a longer life expectancy than adults (1-5).
Among strategies to minimize CT imaging parameters, setting up a body size-adaptive CT protocol is the first step. Body weight is the most commonly used body size parameter in determining the imaging parameters in pe- diatric CT. Initial attempts have been made by adjusting mA at a fixed potential of 120 or 140 kV (6, 7) and have been followed by reducing kV for lighter patients (8, 9).
We also have used a weight-based pediatric CT protocol since 2000.
Theoretically, body weight may not be an optimal pa- rameter for maintaining uniform CT image noise in pa- tients with the same body weight but a different body habitus. In this respect, cross-sectional dimensions may be better than body weight for the determination of imaging parameters in pediatric CT. In adults, a few studies describing the relationship between cross-sec- tional dimensions and CT image noise have been report- ed (10-13). However, to the best of our knowledge an evaluation has not been conducted in children despite the issue that the CT radiation dose is critical in children and the body sizes of children are much more variable than body sizes of adults. Therefore, the aim of this study was to investigate the best parameter among the use of cross-sectional dimensions and body weight that showed the best correlation with image noise on pedi- atric abdominal low dose CT.
Materials and Methods
We retrospectively reviewed 186 consecutive abdomi- nal CT studies in children weighing 10.0-39.9 kg that were performed between April 2004 and December 2004. The institutional review board approved the study and informed consents was not needed for the study.
Among six body weight groups, only two body weight groups (group 1: 10.0-19.9 kg in body weight; group 2:
20.0-39.9 kg in body weight) were included in this study as the number of patients in the other groups was not sufficient for statistical analysis. Abdominal CT was performed with a four-slice CT scanner (Lightspeed QX/i; General Electric Medical Systems, Milwaukee, WI U.S.A.) according to a weight-based CT protocol (100 kV and 120 mA for group 1, 100 kV and 140 mA for group 2) in our institution. A four-slice spiral scan was
obtained with 0.5-sec gantry rotation time, 3.75-mm col- limation, 3.75-mm slice thickness, and beam pitch 1.5.
We excluded 50 of 186 abdominal CT examinations in the two groups when the body weight within one month before or after the examination date was not available, a patient was status post right hepatectomy, or lesions occupied the right lobe of the liver. Therefore, 136 abdominal CT examinations were included in this study: 79 studies in group 1 (mean age 3.1 years, M:F = 54:25) and 57 studies in group 2 (mean age 8.6 years, M:F = 33:24).
Body weight was obtained from the medical records of the patients. The mean interval between the CT ex- amination and weight measurement was 6.3 days (range: 0-27 days) in group 1 and 6.3 days (range: 0-29 days) in group 2. Abdominal cross-sectional dimensions, including area, anteroposterior diameter, and transverse diameter, were measured on a CT image at the celiac ax- is. Abdominal circumference was estimated from the measured anteroposterior and transverse diameters.
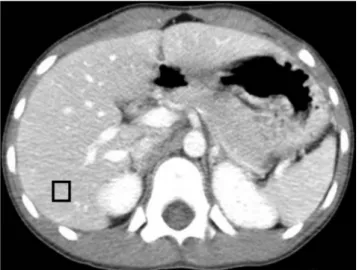
Image noise (standard deviation of CT density) was measured three times and was averaged by placing a rectangular region of interest (1.3±0.6 cm2) in the poste- rior segment of the right hepatic lobe with special atten- tion not to include the hepatic vessels on the same CT image at the celiac axis (Fig. 1).
We evaluated whether cross-sectional dimensions, body weight, and image noise showed a normal proba- bility curve. Image noise was correlated with abdominal cross-sectional dimensions and body weight for each group by the use of statistical software (MedCalc,
Fig. 1. An abdominal CT image at the level of the celiac axis shows a rectangular region of interest in the posterior segment of the right hepatic lobe used for measuring image noise (stan- dard deviation of measured CT density).
Mariakerke, Belgium). A p-value of less than 0.05 was considered to indicate a statistically significant differ- ence. Correlation coefficients (γ) were considered as weakly positive correlation for 0.1 ≤ γ< 0.3; strongly positive correlation for 0.3 ≤ γ< 0.7; perfectly positive correlation for 0.7 ≤ γ< 1.0.
Results
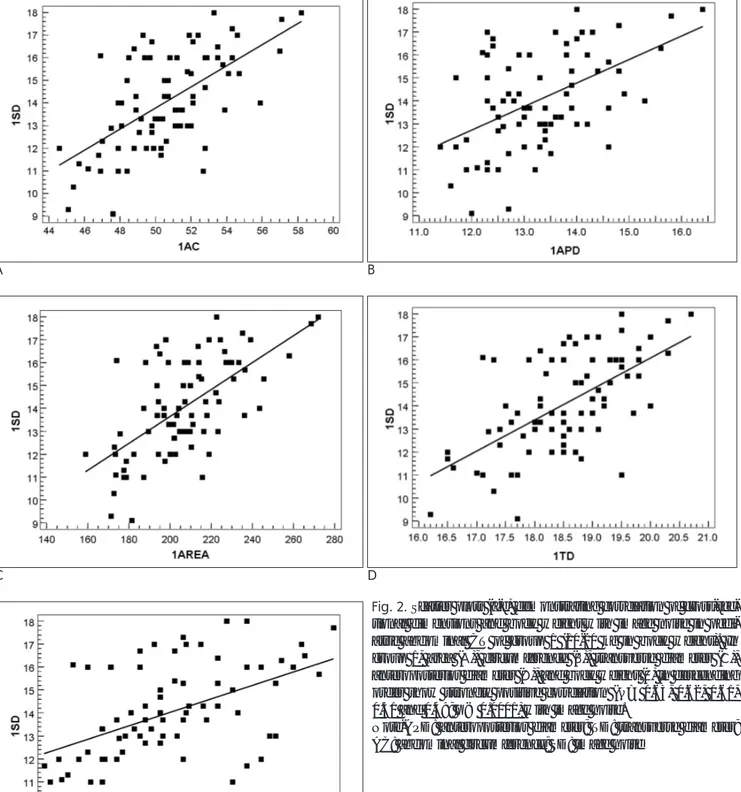
All data including abdominal cross-sectional dimen- sions, body weight, and image noise showed a normal probability curve. Abdominal cross-sectional dimen- sions and body weight in the two groups are described in Table 1. Measured image noise was 14.1±2.1 in group 1 and 18.9±3.9 in group 2. In group 1 subjects, area, circumference, transverse diameter, anteroposteri- or diameter, and body weight (in descending order) showed a strongly positive correlation (γ= 0.63, 0.62, 0.61, 0.51 and 0.49; p < 0.0001) with image noise (Fig.
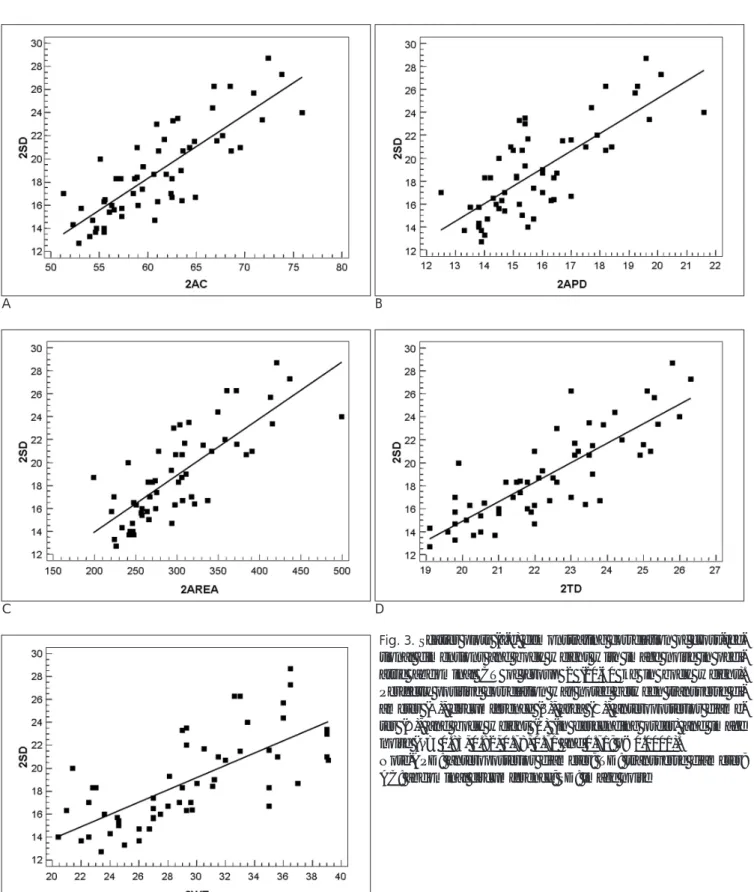
2). In group 2, a perfectly positive correlation was found between transverse diameter, circumference, area, an- teroposterior diameter, and body weight (in descending order) and image noise (γ= 0.83, 0.82, 0.78, 0.71 and 0.71; p < 0.0001) (Fig. 3). In both groups, body weight showed the lowest positive correlation with image noise and anteroposterior diameter showed the lowest or sec- ond lowest positive correlation with image noise. In con- trast, area, circumference, and transverse diameter showed a higher positive correlation with image noise than the two body size parameters.
Discussion
In this study, we found that abdominal cross-sectional dimensions such as area, circumference, and transverse diameter showed a higher positive correlation with im- age noise of pediatric low dose abdominal CT than with body weight. Therefore, our results suggest that CT pa- rameters based on abdominal cross-sectional dimen- sions may result in homogeneous noise of abdominal CT regardless of the body habitus of children. A strategy
based on these findings may have important practical advantages regarding both image quality and radiation dose issues over the use of a conventional weight-based strategy. With the use of a cross-sectional dimension- based protocol, non-diagnostic CT examinations in obese patients can be avoided. An unnecessarily high CT dose would not be used in slim patients.
Adjustment of CT parameters according to patient di- ameters has been reported to provide constant image noise in adults (10-13). Kalra et al. (11) correlated pa- tient weight and cross-sectional dimensions with subjec- tive image quality at standard dose abdominal CT and found that the transverse diameter of the abdomen had the strongest correlation with image quality. These re- sults are similar to our results. However, these investi- gators used variable tube currents of abdominal CT and evaluated subjective image quality. On the contrary, we used the same tube current for each body weight group and measured image noise as one of objective evalua- tion methods for image quality. In addition, we could not find a single parameter that showed a consistent strong correlation with image noise, unlike the results of Karla and colleagues. In group 2 subjects (20.0-39.9 kg in body weight) that may have ellipsoid cross-sectional geometry similar to adults, the transverse diameter showed the strongest positive correlation with image noise, whereas area showed the strongest positive corre- lation with image noise in group 1 subjects (10.0-19.9 kg in body weight). This difference in correlation may be explained by differences in cross-sectional geometry between the subjects in the two groups: group 1 patients may have a more round cross-sectional geometry than in group 2 patients.
Measured image noise can be used to determine the diagnostic quality of a scanned CT image and ultimately allows one to decide appropriate body size adaptive CT parameters for each anatomic region. Other investiga- tors also found that measurements of image noise could be used to adjust chest and abdominopelvic CT tech- niques for pediatric populations (14). The required im- age noise may be quite different for the purpose of a CT
Table 1. Abdominal Cross-sectional Dimensions and Body Weight in Groups 1 and 2
APD (cm) TD (cm) AC (cm) Area (cm2) Weight (kg)
Group 1 13.3±1.0 18.5±1.0 50.6±2.8 206.9±22.7 14.4±2.5
Group 2 15.9±1.9 22.3±1.9 61.0±5.9 300.2±62.2 29.5±5.2
Note.─ Group 1: 10.0-19.9 kg in body weight; Group 2: 20.0 kg-39.9 kg in body weight; APD: anteroposterior diameter; TD: transverse diameter; AC: abdominal circumference
All the numbers in the table represent mean±standard deviation.
study as well as for the scanned anatomic region.
Therefore, it would be very helpful to determine opti- mal CT parameters for a CT study when the required level of image noise was already well established.
Further studies are necessary to determine the required image noises of various CT studies; such studies have seldom been performed. Subsequently, one can formu- late an equation for CT parameters according to cross-
A B
C D
E
Fig. 2. Scatter plots (a-e) demonstrating correlation of cross-sec- tional dimensions and body weight with image noise in pedi- atric abdominal CT of group 1 (10-20 kg in body weight). In group 1, area (A), circumference (B), transverse diameter (C), anteroposterior diameter (D), and body weight (E) in descending order show strongly positive correlation (γ= 0.63, 0.62, 0.61, 0.51 and 0.49; p < 0.0001) with image noise.
Note-APD: anteroposterior diameter; TD: transverse diameter;
AC: abdominal circumference; SD: image noise
sectional dimension and/or attenuation. By using such an equation, one could adjust CT parameters by an indi- vidual rather than by a group.
Body weight is globally used in determining CT para-
meters, as it is easy to obtain. A cross-sectional dimen- sion should also be easy to obtain as a parameter to be used in clinical practice. In this regard, one should de- fine a certain anatomic level for a CT study (for exam-
A B
C D
E
Fig. 3. Scatter plots (a-e) demonstrating correlation of cross-sec- tional dimensions and body weight with image noise in pedi- atric abdominal CT of group 2 (20-40 kg in body weight).
Perfectly positive correlation was noted between transverse di- ameter (A), circumference (B), area (C), anteroposterior diame- ter (D), and body weight (E) (in descending order) and image noise (γ= 0.83, 0.82, 0.78, 0.71 and 0.71; p<0.0001).
Note-APD: anteroposterior diameter; TD: transverse diameter;
AC: abdominal circumference; SD: image noise
ple, the celiac axis level for abdominal CT) first. Next, the area and transverse diameter may be measured from a very low dose CT image at a predefined anatom- ic level. For that purpose, an image obtained for bolus tracking of contrast-enhanced CT can be used.
Circumference can be directly measured at a predefined anatomic level by the use of a ruler before the CT exam- ination.
In this study, the anteroposterior diameter had the lowest or the second lowest positive correlation with im- age noise. This finding is easily explained by the fact that in an ellipsoid cross-sectional geometry, CT image noise is principally influenced by the transverse diame- ter rather than by the anteroposterior diameter.
Actually, this is a basic principle in angular tube current modulation, in which tube current in the anteroposteri- or direction can be reduced without a significant in- crease in image noise. Tube current modulation is a use- ful dose-reducing technique and it should be routinely used in pediatric CT if available (15). We did not apply the tube current modulation technique to pediatric ab- dominal CT as the CT system used in this study did not provide tube current modulation. Because image noise may be slightly affected by tube current modulation, a correlation study with image noise may actually be more accurate without tube current modulation than with tube current modulation.
In addition to body size parameters including cross- sectional dimensions and body weight, mean attenua- tion of CT images is another important factor for deter- mining image noise. In an adult study, other investiga- tors have suggested that a new topogram-based estimate containing a mean attenuation value might be better for individual CT dose adaptation than the use of other body size parameters (16). However, the method was too complex to be used in clinical practice. A study to find an optimal and practical way to determine CT para- meters based on both cross-sectional parameter and at- tenuation value is ongoing in our department.
This study has several limitations. First, only two body weight groups (between 10 and 40 kg) were in- cluded as the number of CT examinations in the other groups was insufficient to be analyzed statistically.
Thus, other body weight groups may not show the same results as the two body weight groups evaluated in this study. However, we believe that our results demon- strate a higher correlation of cross-sectional dimensions with image noise than with body weight in pediatric ab- dominal CT and demonstrate minor differences in cor-
relation strengths among the different body weight groups. Second, a small error from circumference esti- mation may be inevitable. However, direct measure- ment of circumference is virtually impossible on a CT image and we believe that such an error did not substan- tially affect our results.
In conclusion, cross-sectional dimensions such as area, circumference, and transverse diameter show a higher positive correlation with image noise than body weight for pediatric low dose abdominal CT. Therefore, pediatric CT based on such cross-sectional dimensions may result in more uniform image noise irrespective of body habitus than pediatric CT based on body weight.
References
1. Kalra MK, Maher MM, Toth TL, Hamberg LM, Blake MA, Shepard JA, et al. Strategies for CT radiation dose optimization.
Radiology 2004;230:619-628
2. Lee CI, Haims AH, Monico EP, Brink JA, Forman HP. Diagnostic CT scans: assessment of patient, physician, and radiologist aware- ness of radiation dose and possible risks. Radiology 2004;231:393- 398
3. McNitt-Gray MF. AAPM/RSNA physics tutorial for residents: top- ics in CT - radiation dose in CT. Radiographics 2002;22:1541-1553 4. Linton OW, Mettler FA Jr. National conference on dose reduction
in CT, with an emphasis on pediatric patients. AJR Am J Roentgenol 2003;181:321-329
5. Goo HW. Pediatric CT: understanding of radiation dose and opti- mization of imaging techniques. J Korean Radiol Soc 2005;52:1-5 6. Donnelly LF, Emery KH, Brody AS. Minimizing radiation dose for
pediatric body application of single detector helical CT: strategies at a large children’s hospital. AJR Am J Roentgenol 2001;176:303- 306
7. Frush DP, Soden B, Frush KS, Lowry C. Improved pediatric multi- detector body CT using a size-based color-coded format. AJR Am J Roentgenol 2002;178:721-726
8. Sigal-Cinqualbre AB, Hennequin R, Abada HT, Chen X, Paul JF.
Low-kilovoltage multi-detector row chest CT in adults: feasibility and effect on image quality and iodine dose. Radiology 2004;231:
169-174
9. Huda W, Scalzetti EM, Levin G. Technique factors and image quality as functions of patient weight at abdominal CT. Radiology 2000;217:430-435
10. Haaga JR, Miraldi F, Macintyre W, LiPuma JP, Bryan PJ, Wiesen E. The effect of mAs variation upon computed tomography image quality as evaluated by in vivo and in vitro studies. Radiology 1981;138:449-454
11. Kalra MK, Maher MM, Prasad SR, Hayat S, Blake MA, Varghese J, et al. Correlation of patient weight and cross-sectional dimensions with subjective image quality at standard dose abdominal CT.
Korean J Radiol 2003;4:234-238
12. Starck G, Lonn L, Cederblad A, Forssell-Aronsson E, Sjostrom L, Alpsten M. A method to obtain the same level of CT image noise for patients of various sizes, to minimize radiation dose. Br J Radiol 2002;75:140-150
13. Wilting JE, Zwartkruis A, van Leeuwen MS, Timmer J, Kamphuis AG, Feldberg M. A rational approach to dose reduction in CT: in-
dividualized scan protocols. Eur Radiol 2001;11:2627-2632 14. Cody DD, Moxley DM, Krugh KT, O’Daniel JC, Wagner LK,
Eftekhari F. Strategies for formulating appropriate MDCT tech- niques when imaging the chest, abdomen, and pelvis in pediatric patients. AJR Am J Roentgenol 2004;182:849-859
15. Goo HW, Suh DS. Tube current reduction in pediatric non-ECG-
gated heart CT by combined tube current modulation. Pediatr Radiol 2006;36:344-351
16. Menke J. Comparison of different body size parameters for indi- vidual dose adaptation in body CT of adults. Radiology 2005;236:
565-571
대한영상의학회지 2008;58:169-175
소아 저선량 복부 CT검사에서 방사선 양을 결정하기 위한 최적 변수:
횡단면 치수 대 체중
11울산대학교 의과대학 서울아산병원 영상의학과교실, 영상의학연구소
정 윤 영・구 현 우
목적: 소아 CT에서 방사선 양과 관련된 영상 변수는 대개 체중에 따라 결정된다. 이 연구의 목적은 소아 저선량 복 부 CT 검사에서 횡단면 치수와 체중 중에 환자 크기에 따른 방사선량을 결정하는 최적의 매개변수를 알아보고자 하였다.
대상과 방법: 연속적으로 소아 복부 CT 검사를 시행했던 136명의 소아를 대상으로 하였고, 체중에 따라 그룹 1(79 명, 10.0 - 19.9 kg)과 그룹 2(57명, 20.0 - 39.9 kg)으로 나누었다. 복강동맥강 수준의 CT 영상에서 횡단 둘레 와 면적, 전후 및 가로직경을 포함한 횡단면 치수를 측정하였고, 간 우엽 후분절에서 영상 소음 값을 구하였다. 각 그룹에서 측정한 영상 소음 값의 복부 횡단면 치수와 체중과의 상관관계를 분석하였다.
결과: 그룹 1에서 횡단 면적, 횡단 둘레, 가로직경, 전후직경, 그리고 체중은 영상 소음 값과 내림차순으로 유의한 양의 상관관계를 보였다(γ= 0.63, 0.62, 0.61, 0.51, 그리고 0.49; p < 0.0001). 그룹 2에서 가로직경, 횡단 둘레, 횡단 면적, 전후직경, 그리고 체중은 영상 소음 값과 내림차순으로 유의한 양의 상관관계를 나타내었다(γ= 0.83, 0.82, 0.78, 0.71, 그리고 0.71; p < 0.0001).
결론: 횡단 면적, 횡단 둘레, 가로직경과 같은 횡단면 치수가 체중보다 영상 소음과 높은 양의 상관관계를 보였다.
따라서, 소아 저선량 복부 CT검사는 이와 같은 횡단면 치수에 기초한 프로토콜을 적용하는 것이 체중에 기초한 프 로토콜보다 더 균일한 영상을 얻을 수 있을 것이다.