Discrepancies in Clinic and Ambulatory Blood Pressure in Korean Chronic Kidney Disease Patients
Blood pressure (BP) control is considered the most important treatment for preventing chronic kidney disease (CKD) progression and associated cardiovascular complications.
However, clinic BP is insufficient to diagnose hypertension (HT) and to monitor overall BP control because it does not correlate well with ambulatory blood pressure monitoring (ABPM). We enrolled 387 hypertensive CKD patients (stages G1–G4, 58.4% male with median age 61 years) from 3 hospitals in Korea. HT of clinic BP and ABPM was classified as
≥140/90 and ≥130/80 mmHg, respectively. Clinic BP control rate was 60.2%. The median 24-hour systolic blood pressures (SBPs) of CKD G3b and CKD G4 were significantly higher than those of CKD G1–2 and CKD G3a. However, the median 24-hour SBPs were not different between CKD G1–2 and CKD G3a or between CKD G3b and CKD G4. Of all patients, 5.7%, 38.0%. 42.3%, and 14.0% were extreme-dippers, dippers, non-dippers, and reverse-dippers, respectively. Non-/reverse-dippers independently correlated with higher Ca × P product, higher intact parathyroid hormone (iPTH), and lower albumin.
Normal BP was 33.3%, and sustained, masked, and white-coat HT were 29.7%, 26.9%, and 10.1%, respectively. White-coat HT independently correlated with age ≥61 years and masked HT independently correlated with CKD G3b/G4. In conclusion, ABPM revealed a high prevalence of non-/reverse-dippers and sustained/masked HT in Korean CKD patients.
Clinicians should try to obtain a CKD patient’s ABPM, especially among those who are older or who have advanced CKD as well as those with abnormal Ca × P product, iPTH, and albumin.
Keywords: Ambulatory Blood Pressure Monitoring; Blood Pressure; Chronic Kidney Disease; Hypertension; Masked Hypertension; White-Coat Hypertension
Yun Kyu Oh,1 Ho Jun Chin,2 Shin Young Ahn,2 Jung Nam An,1 Jung Pyo Lee,1 Chun Soo Lim,1 and Kook-Hwan Oh3
1Department of Internal Medicine, Seoul National University Boramae Medical Center, Seoul, Korea;
2Department of Internal Medicine, Seoul National University Bundang Hospital, Seongnam, Korea;
3Department of Internal Medicine, Seoul National University Hospital, Seoul, Korea
Received: 28 November 2016 Accepted: 29 January 2017 Address for Correspondence:
Kook-Hwan Oh, MD, PhD
Department of Internal Medicine, Seoul National University Hospital, 101 Daehak-ro, Jongno-gu, Seoul 03080, Korea E-mail: [email protected]
Funding: This work was supported by the Research Program funded by the Korea Centers for Disease Control & Prevention (2014E3301300#).
https://doi.org/10.3346/jkms.2017.32.5.772 • J Korean Med Sci 2017; 32: 772-781
INTRODUCTION
Chronic kidney disease (CKD) is a major health problem, and it affects –10% of adults in Western countries (1). In Korea, CKD prevalence was 7.8% overall (Korea National Health and Nutri
tion Examination Survey [KNHANES] data) and 13.7% in urban population with age ≥ 35 years in Korea (2,3). Among various risk factors, hypertension (HT) is considered an important one in the development and progression of CKD (4). HT also incre
ases the risk of death and cardiovascular disease (5).
To reduce these risks, recent guidelines recommend strict con
trol of blood pressure (BP) to ≤ 130/80 and ≤ 140/90 mmHg in CKD patients with and without proteinuria, respectively (4,6).
However, a large proportion of CKD patients have inadequate BP control, and the proportions vary from report to report (7,8).
Furthermore, BP may not be properly controlled in many Kore
an CKD patients. In Korea, KNHANES guidelines suggested that 58.5% of the general population had appropriate clinic BP (< 130/
80 mmHg), and an Assessment of Blood Pressure Control and Target Organ Damage in Patients with Chronic Kidney Disease
and Hypertension (APrODiTe) study reported that 53.4% of CKD patients had controlled clinic BP (< 140/90 mmHg) (9,10). Fur
thermore, it is important to increase the BP control rate as kid
ney function deteriorates. The National Kidney FoundationKid
ney Early Evaluation Program (NKFKEEP) in the United States reported that rates of HT awareness, treatment, and adequate HT control increased progressively with advancing kidney dis
ease despite increasing HT prevalence (11). Unfortunately, this aspect of BP control is not known in Korean CKD patients.
Clinic BP is considered insufficient to diagnose HT and mon
itor overall BP control because it does not correlate well with ambulatory blood pressure monitoring (ABPM), which encom
passes whitecoat or masked HT (12,13). CKD is associated not only with an abnormal dipping pattern but also with whitecoat or masked HT (7,10,1419). These abnormal ABPM patterns are considered to be associated with cardiovascular disease and CKD progression (20).
We conducted a multicenter, crosssectional study to exam
ine BP control status and patterns and dipping patterns in Ko
rean CKD patients. We also investigated clinical characteristics
associated with abnormal BP patterns.
MATERIALS AND METHODS Study population
From August 2014 to May 2015, patients with HT and CKD stag
es G1–G4 treated at the Seoul National University Boramae Med
ical Center, Seoul National University Hospital, and Seoul Na
tional University Bundang Hospital were enrolled. The inclu
sion criteria were as follows: 1) age of 20–75 years, 2) BP ≥ 140/
90 mmHg, and/or 3) taking the same BP medication since at least 2 weeks before enrollment. Patients with acute kidney in
jury, hospitalization, renal replacement therapy, previous kid
ney transplantation, uncontrolled arrhythmia, asthma, chronic obstructive pulmonary disease, and primary endocrine disor
ders except diabetes mellitus were excluded. Pregnant women and anyone who worked night shifts were also excluded.
Definitions
CKD is defined by the Kidney Disease Improving Global Out
comes (KDIGO) as abnormalities of kidney structure or func
tion that are present for at least 3 months (4). CKD stages were defined according to glomerular filtration rate (GFR) categories as defined by KDIGO guidelines (4). The estimated glomerular filtration rate (eGFR) was calculated using the Chronic Kidney DiseaseEpidemiology Collaboration equation (21). Serum cre
atinine (Cr) was measured using the isotope dilution mass spec
trometrytraceable method. Extremedippers were defined as patients having a nighttime/daytime systolic blood pressure (SBP) ≤ 0.8; dippers, as those with a ratio of 0.8–0.9; nondip
pers, as those with a ratio of 0.9–1.0; and reversedippers, as those with a ratio > 1.0 (22). HT as diagnosed by clinic BP and ABPM measurements was ≥ 140/90 and ≥ 130/80 mmHg, respective
ly. Normal BP was defined as both normal clinic BP and ABPM;
sustained HT, as both HT clinic BP and ABPM; whitecoat HT, as a HT clinic BP and normal ABPM (12); and masked HT, as normal clinic BP and HT ABPM (13).
Clinic BP measurement
Clinic BP was measured by trained medical staff using a mer
cury sphygmomanometer with an appropriately sized cuff (23).
All participants rested over 5 minutes and were prohibited from smoking and ingesting caffeine for 30 minutes before measure
ments. Three measurements were performed at 1minute in
tervals, and the average of the last 2 measurements was taken as the clinic BP.
ABPM
Patients underwent 24hour ABPM using Oscar 2 (SunTech Med
ical, Morrisville, NC, USA) and MobileOGraph (I.E.M. GmbH, Stolberg, Germany). BP monitoring was performed on a typical
work day. BP was recorded every 30 minutes. The ABP reading was considered adequate if the monitor had been worn for 24
hour and there were more than 16 acceptable readings between 8 AM and 10 PM (daytime) and more than 12 acceptable read
ings between 10 PM and 8 AM (nighttime).
Baseline demographics and clinical characteristics Demographic characteristics, CKD causes, medical history, and laboratory data such as hemoglobin (Hb), albumin, blood urea nitrogen (BUN), Cr, calcium (Ca), phosphorus (P), intact para
thyroid hormone (iPTH), total cholesterol (TotalC), highden
sity lipoprotein cholesterol (HDLC), lowdensity lipoprotein cholesterol (LDLC), triglycerides (TG), and random urine pro
tein/Cr ratio (UPCR) were obtained at the baseline study visit.
Comorbidities were evaluated using the modified Charlson Co
morbidity Index Score (CCIS) (24).
Statistical analysis
Quantitative variables are presented as mean ± standard devia
tion (SD) for normally distributed variables. Nonparametric variables are expressed as median (range). Categorical variables are expressed as numbers with proportions. Quantitative vari
ables were analyzed using analysis of variance (ANOVA) followed by the Bonferroni posthoc test or the KruskalWallis or Mann
Whitney rank sum tests for nonparametric variables. Chisquare tests were used to compare categorical variables. Simple logis
tic regression analysis was applied to find the unadjusted fac
tors that correlated with dipping patterns and BP control pat
terns. Multiple logistic regression analysis with backward elimi
nation technique adjusted for factors with P < 0.05 was used to identify independent predictors of dipping patterns and BP con
trol patterns. The relationship between the 2 continuous vari
ables was assessed by Pearson’s correlation method. Statistical analysis was performed using IBM SPSS Statistics 20 (SPSS Inc., Chicago, IL, USA). P value < 0.05 was considered statistically significant.
Ethics statement
The present study protocol was reviewed and approved by the Institutional Review Board of Seoul National University Bora
mae Medical Center (26201463), Seoul National University Hospital (1406131593), and Seoul National University Bun
dang Hospital (B1408/262403). Informed consent was sub
mitted by all subjects when they were enrolled.
RESULTS
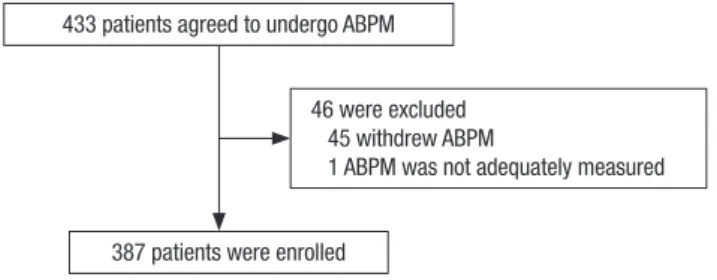
A total of 433 patients agreed to undergo ABPM, and 46 patients were excluded because they withdrew from the study or their ABPM measurements were not adequate. Finally, 387 CKD pa
tients were enrolled in this study (Fig. 1).
Table 1. Demographic and clinical characteristics according to CKD stages
Variables Total (n = 387) CKD G1–2 (n = 95) CKD G3a (n = 79) CKD G3b (n = 93) CKD G 4 (n = 120) P value
Male 226 (58.4) 61 (64.2) 47 (59.5) 55 (59.1) 63 (52.5) 0.377
Age, yr 61 (20–75) 61 (24–74) 65 (20–74) 66 (23–75) 64 (27–75) 0.012
BMI, kg/m2 25.1 ± 3.8 25.6 ± 3.8 24.5 ± 2.9 24.7 ± 4.3 25.3 ± 3.8 0.197
Diabetes mellitus 141 (36.5) 25 (26.3) 17 (21.8) 31 (33.3) 68 (56.7) 0.000
Current smoker 47 (12.1) 10 (10.6) 13 (16.5) 14 (15.1) 10 (8.3) 0.380
Alcohol 109 (28.4) 34 (36.2) 21 (26.6) 26 (28.0) 28 (23.3) 0.216
CCIS 4 (0–13) 4 (0–8) 4 (0–13) 5 (0–12) 5 (0–10) < 0.001
BUN, mg/dL 24 (4–101) 15 (9–36) 20 (9–33) 25 (13–47) 36 (4–101) < 0.001
Cr, mg/dL 1.57 (0.52–4.39) 0.96 (0.52–1.40) 1.32 (0.94–1.94) 1.78 (1.25–2.58) 2.51 (1.59–4.39) < 0.001 eGFR, mL/min/1.73 m2 40.2 (15.0–132.4) 72.8 (60.0–132.4) 50.2 (45.1–59.1) 36.5 (30.2–44.5) 22.7 (15.0–29.9) < 0.001
Ca, mg/dL 9.1 (7.2–10.2) 9.1 (8.2–10.0) 9.2 (8.2–9.9) 9.2 (7.8–10.2) 8.9 (7.2–10.0) < 0.001
P, mg/dL 3.6 (0.8–8.9) 3.5 (0.8–5.3) 3.4 (2.4–4.5) 3.5 (2.1–8.9) 3.9 (2.8–5.4) < 0.001
Ca × P, mg2/dL2 32.9 ± 5.9 32.0 ± 6.1 31.2 ± 4.3 33.1 ± 7.0 34.7 ± 5.1 < 0.001
iPTH, pg/mL 42 (5–296) 28 (7–105) 28 (6–82) 41 (5–211) 71 (13–296) < 0.001
UPCR, mg/mg 0.71 (0.03–16.73) 0.47 (0.04–6.35) 0.38 (0.03–12.78) 0.74 (0.03–14.73) 1.46 (0.06–16.73) < 0.001
Total-C, mg/dL 168 ± 43 171 ± 41 173 ± 38 171 ± 40 160 ± 48 0.105
LDL-C, mg/dL 94 ± 35 97 ± 32 93 ± 32 94 ± 35 91 ± 39 0.743
HDL-C, mg/dL 48 (22–214) 48 (30–99) 46 (29–115) 45 (22–214) 42 (23–142) 0.011
TG, mg/dL 133 (30–1,180) 123 (51–669) 119 (47–334) 154 (49–1,180) 138 (30–437) 0.225
Hb, g/dL 12.9 ± 2.0 14.2 ± 1.7 13.5 ± 2.0 12.9 ± 1.9 11.4 ± 1.5 < 0.001
Albumin, g/dL 4.2 (2.3–5.0) 4.2 (2.8–4.8) 4.2 (3.5–5.0) 4.2 (2.3–4.8) 4.0 (2.6–4.8) < 0.001
No. of drugs 2 (0–7) 2 (0–4) 2 (0–4) 2 (0–5) 2 (0–7) 0.007
CCB 240 (62.0) 55 (57.9) 45 (57.0) 62 (66.7) 78 (65.0) 0.415
ACEi/ARB 294 (76.0) 79 (83.2) 61 (77.2) 74 (79.6) 80 (66.7) 0.028
β-blocker 123 (31.8) 22 (23.2) 20 (25.3) 27 (29.0) 54 (45.0) 0.002
Diuretics 84 (21.6) 12 (12.6) 10 (12.7) 21 (22.6) 41 (34.2) < 0.001
Values for categorical variables are given as a number (%); Values for continuous variables are given as mean ± standard deviation or median (range).
ACEi = angiotensin-converting enzyme inhibitor, ARB = angiotensin receptor blocker, BMI = body mass index, BUN = blood urea nitrogen, Ca = calcium, CCB = calcium chan- nel blocker, CCIS = modified Charlson Comorbidity Index Score, CKD = chronic kidney disease, Cr = creatinine, eGFR = estimated glomerular filtration rate, Hb = hemoglobin, HDL-C = high-density lipoprotein cholesterol, iPTH = intact parathyroid hormone, LDL-C = low-density lipoprotein cholesterol, No. = number, P = phosphorus, TG = triglyceride, Total-C = total cholesterol, UPCR = random urine protein/creatinine ratio.
Fig. 1. Diagram of patients enrollment. A total of 433 CKD patients agreed to under- go ABPM, and 46 patients were excluded from the analysis.
CKD = chronic kidney disease, ABPM = ambulatory blood pressure monitoring.
433 patients agreed to undergo ABPM
387 patients were enrolled
46 were excluded 45 withdrew ABPM
1 ABPM was not adequately measured Demographic and clinical characteristics according to CKD stages
Table 1 shows the general characteristics of the 387 patients. Of these, 226 patients (58.4%) were male, and their median age was 61 (20–75) years. Diabetic nephropathy, glomerulonephri
tis, hypertensive nephropathy, and polycystic kidney disease were reported in 141 (36.5%), 107 (27.6%), 80 (20.7%), and 9 (2.3%) patients, respectively. Of all patients, 95 (24.6%) were CKD G1–2, 79 (20.4%) were CKD G3a, 93 (24.0%) were CKD G3b, and 120 (31.0%) were CKD G4. Table 1 also shows the demographic
and laboratory characteristics according to the CKD stages.
The median clinic BP was 133 (90–207)/78 (30–115) mmHg.
According to ABPM, the median 24hour BP was 129 (94–207)/
79 (49–114) mmHg, median daytime BP was 133 (94–213)/82 (52–115) mmHg, and median nighttime BP was 121 (87–197)/73 (42–117) mmHg. Of all patients, 233 (60.2%) had controlled clin
ic BP (< 140/90 mmHg), whereas 134 (34.6%) using ABP crite
ria had < 130/80 mmHg.
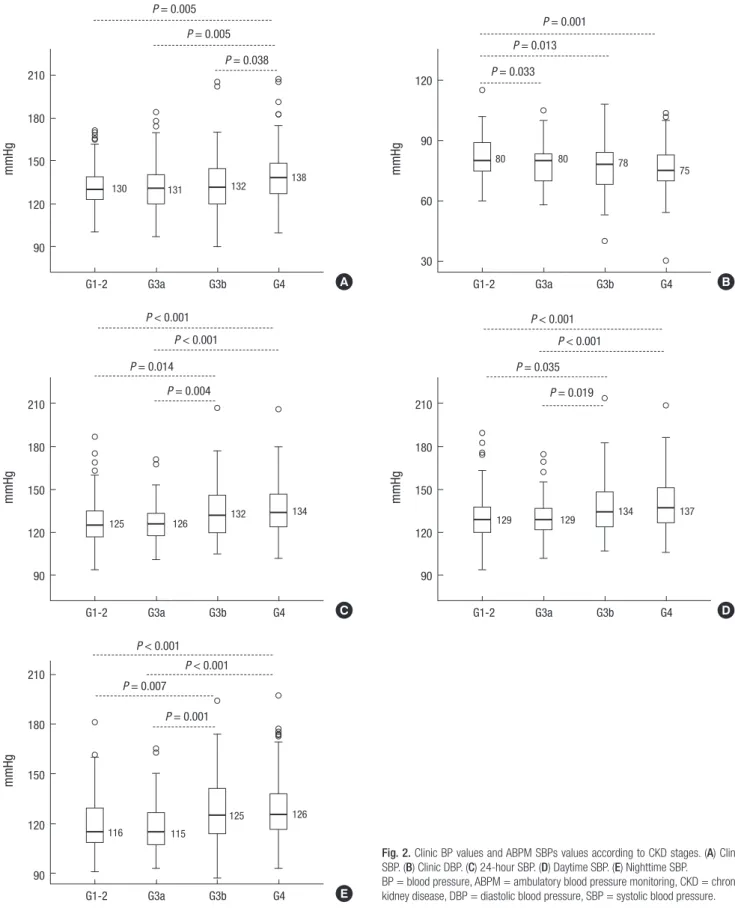
The median clinic, 24hour, daytime, and nighttime SBPs were not different between CKD G1–2 and CKD G3a. The median 24hour, daytime, and nighttime SBPs were not different between CKD G3b and CKD G4. The median clinic diastolic blood pres
sure (DBP) of CKD G1–2 (80 [60–115] mmHg) was significantly higher than that of CKD G3a (80 [58–105] mmHg, P = 0.033), CKD G3b (78 [40–108] mmHg, P = 0.013), and CKD G4 (75 [30–
104] mmHg, P = 0.001). There were no differences in the 24hour, daytime, and nighttime DBP between all CKD stages (Fig. 2).
Dipping patterns
Of all patients, 22 (5.7%) were extremedippers, 147 (38.0%) were dippers, 164 (42.3%) were nondippers, and 54 (14.0%) were re
versedippers. Reversedippers showed lower median eGFR and
Fig. 2. Clinic BP values and ABPM SBPs values according to CKD stages. (A) Clinic SBP. (B) Clinic DBP. (C) 24-hour SBP. (D) Daytime SBP. (E) Nighttime SBP.
BP = blood pressure, ABPM = ambulatory blood pressure monitoring, CKD = chronic kidney disease, DBP = diastolic blood pressure, SBP = systolic blood pressure.
mmHg
G1-2 G3a G3b G4 210
180 150 120 90
P = 0.005 P = 0.005
P = 0.038
130 131 132 138 mmHg
G1-2 G3a G3b G4 120
90
60
30
P = 0.001
P = 0.033 P = 0.013
80 80 78
75
mmHg
G1-2 G3a G3b G4 210
180 150 120 90
P < 0.001
P = 0.004 P = 0.014
125 126 132 134
P < 0.001
mmHg
G1-2 G3a G3b G4 210
180
150
120
90
P = 0.007 P = 0.001
116 115
125 126
P < 0.001 P < 0.001
mmHg
G1-2 G3a G3b G4 210
180 150 120 90
P < 0.001
P = 0.019 P = 0.035
129 129 134 137
P < 0.001
A B
C D
E a higher proportion of CKD G3b/G4, but no statistically signifi
cant difference. Reversedippers showed higher median P (P = 0.001), TG (P = 0.020), and nighttime SBP (P < 0.001) and lower
median albumin (P < 0.001) than extremedippers, dippers, and nondippers. They also showed higher median UPCR than ex
tremedippers and dippers (P = 0.028). Reversedippers showed
higher mean Ca × P product than dippers and nondippers (P <
0.001) (Table 2).
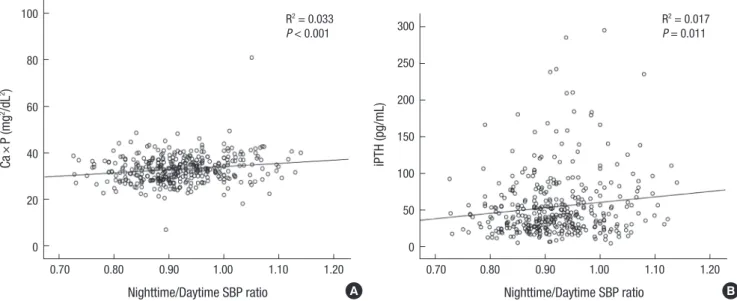
The Ca × P product and iPTH positively correlated with night
time/daytime SBP ratio (R2= 0.033, P < 0.001 and R2= 0.017, P = 0.011, respectively) (Fig. 3). The P, Ca × P product, iPTH, al
bumin, nighttime SBP, and nighttime DBP significantly corre
lated with the non/reversedippers in univariate analyses. Mul
tiple logistic regression analyses conducted with the above fac
tors and eGFR showed that the Ca × P product (odds ratio [OR], 1.212; 95% confidence interval [CI], 1.041–1.411; P = 0.013), iPTH (OR, 1.008; 95% CI, 1.002–1.014; P = 0.013), and albumin (OR, 0.363; 95% CI, 0.174–0.761; P = 0.007) were independently as
sociated with non/reversedippers when BP data were not in
cluded. When multiple logistic regression analyses were per
formed with the above factors, eGFR, and BP data, the Ca × P product (OR, 1.247; 95% CI, 1.053–1.582; P = 0.011), nighttime SBP (OR, 1.042; 95% CI, 1.022–1.062; P < 0.001), and nighttime DBP (OR, 1.040; 95% CI, 1.010–1.070; P = 0.008) were indepen
dently associated with non/reversedippers (Table 3).
BP control patterns
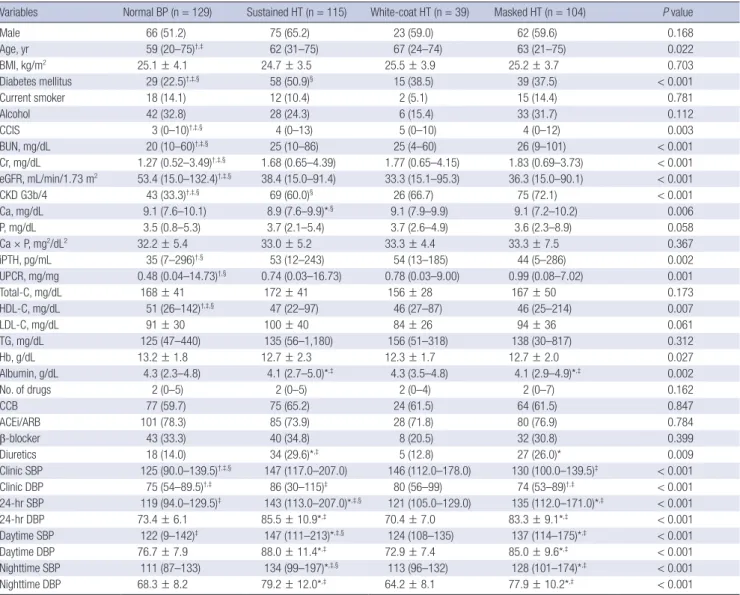
Among all patients, normal BP was most common (33.3%), fol
lowed by sustained HT (29.7%), masked HT (26.9%), and white
coat HT (10.1%). The median 24hour SBP (P < 0.001), daytime SBP (P < 0.001), and nighttime SBP (P < 0.001) were the highest in sustained HT than in normal BP, whitecoat HT, and masked HT. Masked HT showed higher ABPM SBPs than normal BP and whitecoat HT (P < 0.001) (Table 4). However, clinic SBP was Table 2. Demographic, clinical, and BP characteristics according to dipping patterns
Variables Extreme-dippers (n = 22) Dippers (n = 147) Non-dippers (n = 164) Reverse-dippers (n = 54) P value
Male 15 (68.2) 90 (61.2) 92 (56.1) 29 (53.7) 0.532
Age, yr 67 (50–74) 63 (32–74) 64 (23–75) 66 (33–75) 0.223
BMI, kg/m2 25.1 ± 3.2 25.5 ± 3.2 25.6 ± 4.9 25.4 ± 3.7 0.662
Diabetes mellitus 9 (40.9) 52 (35.6) 55 (33.5) 25 (46.3) 0.378
Current smoker 3 (13.6) 16 (11.0) 23 (14.0) 5 (-9.3) 0.693
Alcohol 7 (31.8) 44 (30.1) 46 (28.0) 12 (22.2) 0.713
CCIS 5 (0–8) 5 (0–10) 4 (0–11) 5 (0–13) 0.070
BUN, mg/dL 21 (11–86) 24 (4–60) 25 (10–101) 27 (13–58) 0.154
Cr, mg/dL 1.52 (0.87–4.39) 1.53 (0.52–3.94) 1.67 (0.74–4.26) 1.77 (0.76–4.02) 0.426
eGFR, mL/min/1.73 m2 37.4 (15.0–85.7) 41.2 (15.0–132.4) 36.4 (15.0–97.4) 32.3 (15.0–76.1) 0.430
CKD G3b/G4 10 (45.5) 77 (52.4) 90 (54.9) 36 (66.7) 0.242
Ca, mg/dL 9.0 (7.8–9.9) 9.0 (7.2–10.2) 9.1 (7.7–10.1) 9.1 (7.6–9.9) 0.902
P, mg/dL 3.4 (0.8–4.6) 3.6 (2.4–5.4) 3.6 (2.5–5.3) 3.9 (2.1–8.9)*,†,‡ 0.001
Ca × P, mg2/dL2 31.8 ± 5.8 32.6 ± 5.5 32.7 ± 4.6 36.1 ± 10.0†,‡ < 0.001
iPTH, pg/mL 40 (20–167) 35 (13–157) 44 (7–239) 54 (14–296) 0.376
UPCR, mg/mg 0.45 (0.03–7.25) 0.60 (0.04–11.75) 0.74 (0.03–14.73) 1.07 (0.08–16.73)*,† 0.028
Total-C, mg/dL 149 ± 21 167 ± 39 167 ± 44 166 ± 48 0.467
HDL-C, mg/dL 47 (22–79) 45 (29–99) 45 (25–115) 46 (23–86) 0.432
LDL-C, mg/dL 77 ± 21 91 ± 31 94 ± 35 99 ± 44 0.517
TG, mg/dL 115 (65–259) 135 (51–669) 131 (30–1,180) 173 (35–409)*,†,‡ 0.020
Hb, g/dL 12.8 ± 3.2 12.7 ± 2.0 12.6 ± 2.0 12.6 ± 2.2 0.542
Albumin, g/dL 4.3 (3.5–4.8) 4.2 (2.9–4.9) 4.2 (2.3–4.7) 4.0 (2.7–4.4)*,†,‡ 0.011
No. of drugs 3 (1–4) 2 (0–7) 2 (0–5) 2 (1–4) 0.800
CCB 11 (50.0) 88 (59.9) 106 (64.6) 35 (64.8) 0.514
ACEi/ARB 17 (77.3) 114 (77.6) 123 (75.0) 40 (74.1) 0.938
β–blocker 6 (27.3) 49 (33.3) 51 (31.1) 17 (31.8) 0.939
Diuretics 5 (22.7) 28 (19.0) 35 (21.3) 16 (29.6) 0.452
Clinic SBP 141 (107–175) 135 (100–175) 134 (90–207) 138 (108–183) 0.769
Clinic DBP 76 (57–82) 77 (58–99) 76 (53–115) 73 (54–104) 0.183
24-hr SBP 140 (118–159) 129 (102–175) 131 (104–206) 139 (112–171) 0.072
24-hr DBP 79.0 ± 9.7 77.3 ± 10.5 80.0 ± 10.1 81.3 ± 10.6 0.282
Daytime SBP 149 (124–171) 135 (106–182) 133 (105–208) 139 (110–168) 0.054
Daytime DBP 84.1 ± 9.9 80.5 ± 10.7 81.0 ± 10.6 81.4 ± 11.0 0.328
Nighttime SBP 112 (99–136) 115 (93–160) 125 (100–197)*,† 144 (114–177)*,†,‡ < 0.001
Nighttime DBP 64.1 ± 8.5 69.2 ± 10.2 75.1 ± 10.1*,† 82.2 ± 12.2*,†,‡ < 0.001
Values for categorical variables are given as a number (%); Values for continuous variables are given as mean ± standard deviation or median (range).
ACEi = angiotensin-converting enzyme inhibitor, ARB = angiotensin receptor blocker, BMI = body mass index, BP = blood pressure, BUN = blood urea nitrogen, Ca = calcium, CCB = calcium channel blocker, CCIS = modified Charlson Comorbidity Index Score, CKD = chronic kidney disease, Cr = creatinine, DBP = diastolic blood pressure, eGFR = estimated glomerular filtration rate, Hb = hemoglobin, HDL-C = high-density lipoprotein cholesterol, iPTH = intact parathyroid hormone, LDL-C = low-density lipoprotein cho- lesterol, No. = number, P = phosphorus, SBP = systolic blood pressure, TG = triglyceride, Total-C = total cholesterol, UPCR = random urine protein/creatinine ratio.
*Significant with extreme-dippers; †Significant with dippers; ‡Significant with non-dippers.
not different between sustained HT and whitecoat HT (Table 4).
Normal BP showed lower median BUN (P < 0.001), Cr (P <
0.001), and CCIS (P = 0.003); higher median eGFR (P < 0.001) and HDLC (P = 0.007); and lower proportion of DM (P < 0.001) and CKD G3b/G4 (P < 0.001) than sustained HT, whitecoat HT, and masked HT. Normal BP also showed lower median iPTH (P = 0.002) and UPCR (P = 0.001) than sustained HT and masked HT. Sustained HT showed a higher proportion of DM (P < 0.001) and lower proportion of CKD G3b/G4 (P < 0.001) than masked HT. Sustained HT and masked HT showed lower median albu
min (P = 0.002) than normal BP and whitecoat HT. Sustained and masked HT patients were also prescribed more diuretics than those with normal BP (P = 0.009) (Table 4).
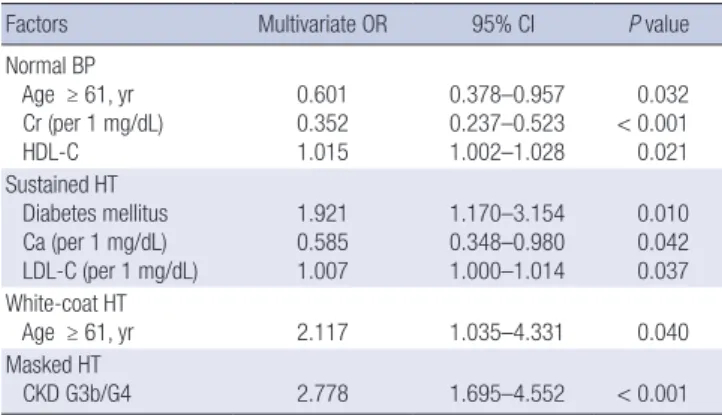
Multiple logistic regression analyses showed that age ≥ 61 years (OR, 0.601; 95% CI, 0.378–0.957; P = 0.032), Cr (OR, 0.352;
95% CI, 0.237–0.523; P < 0.001), and HDLC (OR, 1.015; 95% CI, 1.002–1.928; P = 0.012) independently associated with normal BP. DM (OR, 1.921; 95% CI, 1.170–3.154; P = 0.010), Ca (OR, 0.585;
95% CI, 0.348–0.980; P = 0.042), and LDLC (OR, 1.007; 95% CI, 1.000–1.014; P = 0.037) independently associated with sustained HT. Age ≥ 61 years (OR, 2.117; 95% CI, 1.035–4.331; P = 0.040)
independently correlated with whitecoat HT. CKD G3b/G4 (OR, 2.778; 95% CI, 1.695–4.552; P < 0.001) independently correlated with masked HT (Table 5).
DISCUSSION
This study demonstrated that the clinic BP control rate was 60.2%.
The median 24hour SBPs of CKD G3b and CKD G4 were sig
nificantly higher than those of CKD G1–2 and CKD G3a. How
ever, the median 24hour SBPs were not different between CKD G1–2 and CKD G3a or between CKD G3b and CKD G4. Of all Korean CKD patients, 56.3% were non/reversedippers. Non/
reversedippers are associated with higher P, higher Ca × P prod
uct, and lower albumin. They also show high prevalence of sus
tained HT (29.7%) and masked HT (26.9%). Sustained HT cor
related with DM, lower Ca, and higher LDLC. Whitecoat HT was associated with age ≥ 61 years and masked HT was associ
ated with CKD G3b/G4.
Many previous studies have reported on control of clinic BP in CKD patients. NKFKEEP showed that 31.4% and 13.2% of patients maintained clinic BP ≤ 140/90 and 130/80 mmHg, re
Fig. 3. Correlation of Ca × P and iPTH with nighttime/daytime SBP ratio. (A) Ca × P product. (B) iPTH.
Ca = calcium, P = phosphorus, iPTH = intact parathyroid hormone, SBP = systolic blood pressure.
Ca×P (mg2 /dL2 )
Nighttime/Daytime SBP ratio
0.70 0.80 0.90 1.00 1.10 1.20 100
80 60
40
20 0
R2 = 0.033 P < 0.001
iPTH (pg/mL)
Nighttime/Daytime SBP ratio
0.70 0.80 0.90 1.00 1.10 1.20 300
250 200 150 100 50 0
R2 = 0.017 P = 0.011
A B
Table 3. Factors related to non-/reverse-dippers
Factors Model 1 Model 2
Multivariate OR 95% CI P value Multivariate OR 95% CI P value
Ca × P (per 1 mg2/dL2) 1.212 1.041–1.411 0.013 1.249 1.053–1.482 0.011
iPTH (per 1 pg/mL) 1.008 1.002–1.014 0.013 - - -
Albumin (per 1 g/dL) 0.363 0.174–0.761 0.007 - - -
Nighttime SBP (per 1 mmHg) - - - 1.042 1.022–1.062 < 0.001
Nighttime DBP (per 1 mmHg) - - - 1.040 1.010–1.070 0.008
Model 1: adjusted for P, Ca × P, iPTH, albumin, eGFR, and UPCR; Model 2: adjusted for P, Ca × P, iPTH, albumin, eGFR, UPCR, nighttime SBP, and nighttime DBP.
Ca = calcium, CI = confidence interval, DBP = diastolic blood pressure, eGFR = estimated glomerular filtration rate, iPTH = intact parathyroid hormone, OR = odds ratio, P = phosphorus, SBP = systolic blood pressure, UPCR = random urine protein/creatinine ratio.
Table 4. Demographic, clinical, and BP characteristics according to BP control pattern
Variables Normal BP (n = 129) Sustained HT (n = 115) White-coat HT (n = 39) Masked HT (n = 104) P value
Male 66 (51.2) 75 (65.2) 23 (59.0) 62 (59.6) 0.168
Age, yr 59 (20–75)†,‡ 62 (31–75) 67 (24–74) 63 (21–75) 0.022
BMI, kg/m2 25.1 ± 4.1 24.7 ± 3.5 25.5 ± 3.9 25.2 ± 3.7 0.703
Diabetes mellitus 29 (22.5)†,‡,§ 58 (50.9)§ 15 (38.5) 39 (37.5) < 0.001
Current smoker 18 (14.1) 12 (10.4) 2 (5.1) 15 (14.4) 0.781
Alcohol 42 (32.8) 28 (24.3) 6 (15.4) 33 (31.7) 0.112
CCIS 3 (0–10)†,‡,§ 4 (0–13) 5 (0–10) 4 (0–12) 0.003
BUN, mg/dL 20 (10–60)†,‡,§ 25 (10–86) 25 (4–60) 26 (9–101) < 0.001
Cr, mg/dL 1.27 (0.52–3.49)†,‡,§ 1.68 (0.65–4.39) 1.77 (0.65–4.15) 1.83 (0.69–3.73) < 0.001
eGFR, mL/min/1.73 m2 53.4 (15.0–132.4)†,‡,§ 38.4 (15.0–91.4) 33.3 (15.1–95.3) 36.3 (15.0–90.1) < 0.001
CKD G3b/4 43 (33.3)†,‡,§ 69 (60.0)§ 26 (66.7) 75 (72.1) < 0.001
Ca, mg/dL 9.1 (7.6–10.1) 8.9 (7.6–9.9)*,§ 9.1 (7.9–9.9) 9.1 (7.2–10.2) 0.006
P, mg/dL 3.5 (0.8–5.3) 3.7 (2.1–5.4) 3.7 (2.6–4.9) 3.6 (2.3–8.9) 0.058
Ca × P, mg2/dL2 32.2 ± 5.4 33.0 ± 5.2 33.3 ± 4.4 33.3 ± 7.5 0.367
iPTH, pg/mL 35 (7–296)†,§ 53 (12–243) 54 (13–185) 44 (5–286) 0.002
UPCR, mg/mg 0.48 (0.04–14.73)†,§ 0.74 (0.03–16.73) 0.78 (0.03–9.00) 0.99 (0.08–7.02) 0.001
Total-C, mg/dL 168 ± 41 172 ± 41 156 ± 28 167 ± 50 0.173
HDL-C, mg/dL 51 (26–142)†,‡,§ 47 (22–97) 46 (27–87) 46 (25–214) 0.007
LDL-C, mg/dL 91 ± 30 100 ± 40 84 ± 26 94 ± 36 0.061
TG, mg/dL 125 (47–440) 135 (56–1,180) 156 (51–318) 138 (30–817) 0.312
Hb, g/dL 13.2 ± 1.8 12.7 ± 2.3 12.3 ± 1.7 12.7 ± 2.0 0.027
Albumin, g/dL 4.3 (2.3–4.8) 4.1 (2.7–5.0)*,‡ 4.3 (3.5–4.8) 4.1 (2.9–4.9)*,‡ 0.002
No. of drugs 2 (0–5) 2 (0–5) 2 (0–4) 2 (0–7) 0.162
CCB 77 (59.7) 75 (65.2) 24 (61.5) 64 (61.5) 0.847
ACEi/ARB 101 (78.3) 85 (73.9) 28 (71.8) 80 (76.9) 0.784
β-blocker 43 (33.3) 40 (34.8) 8 (20.5) 32 (30.8) 0.399
Diuretics 18 (14.0) 34 (29.6)*,‡ 5 (12.8) 27 (26.0)* 0.009
Clinic SBP 125 (90.0–139.5)†,‡,§ 147 (117.0–207.0) 146 (112.0–178.0) 130 (100.0–139.5)‡ < 0.001
Clinic DBP 75 (54–89.5)†,‡ 86 (30–115)‡ 80 (56–99) 74 (53–89)†,‡ < 0.001
24-hr SBP 119 (94.0–129.5)‡ 143 (113.0–207.0)*,‡,§ 121 (105.0–129.0) 135 (112.0–171.0)*,‡ < 0.001
24-hr DBP 73.4 ± 6.1 85.5 ± 10.9*,‡ 70.4 ± 7.0 83.3 ± 9.1*,‡ < 0.001
Daytime SBP 122 (9–142)‡ 147 (111–213)*,‡,§ 124 (108–135) 137 (114–175)*,‡ < 0.001
Daytime DBP 76.7 ± 7.9 88.0 ± 11.4*,‡ 72.9 ± 7.4 85.0 ± 9.6*,‡ < 0.001
Nighttime SBP 111 (87–133) 134 (99–197)*,‡,§ 113 (96–132) 128 (101–174)*,‡ < 0.001
Nighttime DBP 68.3 ± 8.2 79.2 ± 12.0*,‡ 64.2 ± 8.1 77.9 ± 10.2*,‡ < 0.001
Values for categorical variables are given as a number (%); Values for continuous variables are given as mean ± standard deviation or median (range).
ACEi = angiotensin-converting enzyme inhibitor, ARB = angiotensin receptor blocker, BMI = body mass index, BP = blood pressure, BUN = blood urea nitrogen, Ca = calcium, CCB = calcium channel blocker, CCIS = modified Charlson Comorbidity Index Score, CKD = chronic kidney disease, Cr = creatinine, DBP = diastolic blood pressure, eGFR = estimated glomerular filtration rate, Hb = hemoglobin, HDL-C = high-density lipoprotein cholesterol, HT = hypertension iPTH, intact parathyroid hormone, LDL-C = low-density lipoprotein cholesterol, No. = number, P = phosphorus, SBP = systolic blood pressure, TG = triglyceride, Total-C = total cholesterol, UPCR = random urine protein/creatinine ratio.
*Significant with normal BP; †Significant with sustained HT; ‡Significant with white-coat HT; §Significant with masked HT.
spectively (11). Among Chronic Renal Insufficiency Cohort (CRIC) Study participants, 67.1% and 46.1% showed clinic BP control rates of < 140/90 and < 130/80 mmHg, respectively (8).
However, at Spanish ABPM Registry report showed that only 21.7% and 9.1% of CKD patients maintained clinic BP < 140/90 and < 130/80 mmHg, respectively (7). In Korea, the APrODiTe study reported that 53.4% of CKD patients had controlled clinic BP (< 140/90 mmHg) (10). This study showed a similar controlled clinic BP rate (60.2%).
Previous studies demonstrated that controlled BP rates in
creased with CKD progression. NKFKEEP reported that rates of HT awareness, treatment and adequate HT control increased with advancing kidney disease despite increasing prevalence of HT (11). The Spanish ABPM Registry analysis also showed that
BP control trends from no CKD to CKD stage 5 increased pro
gressively for BP maintenance at the < 130/80 mmHg thresh
old. They also reported that 24hour BP control did not change from no CKD to CKD stage 5 (7). In contrast, Wu et al. (25) re
ported that 24hour, daytime, and nighttime SBPs and DPBs were higher in CKD stages 4–5 than CKD stages 1–3. This study demonstrated that clinic SBP was higher in CKD G4 than in oth
er groups. In the case of ABPM, CKD G3b/G4 showed higher 24hour, daytime, and nighttime SBPs than CKD G1–2/G3a. The ABPM SBPs were not different between CKD G1–2 and CKD G3a or between CKD G3b and CKD G4. Most CKD studies that examined the association between complications and CKD stag
es were based on the previous 5 stages (26). The recent KDIGO 2012 Guidelines divided stage 3 based on data supporting dif
Table 5. Factors related to BP control patterns
Factors Multivariate OR 95% CI P value
Normal BP Age ≥ 61, yr Cr (per 1 mg/dL) HDL-C
0.601 0.352 1.015
0.378–0.957 0.237–0.523 1.002–1.028
0.032
< 0.001 0.021 Sustained HT
Diabetes mellitus Ca (per 1 mg/dL) LDL-C (per 1 mg/dL)
1.921 0.585 1.007
1.170–3.154 0.348–0.980 1.000–1.014
0.010 0.042 0.037 White-coat HT
Age ≥ 61, yr 2.117 1.035–4.331 0.040
Masked HT
CKD G3b/G4 2.778 1.695–4.552 < 0.001
Normal BP: adjusted for sex, age ≥ 61 years, Diabetes mellitus, CCIS, BUN, Cr, eGFR, CKD G3b/G4, Ca, P, iPTH, UPCR ≥ 1 mg/mg, HDL-C, Hb, albumin, and diuretics; Sus- tained HT: adujusted for DM, CCIS, Cr, eGFR, Ca, iPTH, UPCR ≥ 1 mg/mg, LDL–C, al- bumin, and diuretics; White-coat HT: adjusted for age ≥ 61 years, Total-C, and HDL- C; Masked HT: adujusted for CCIS, BUN, Cr, eGFR, CKD G3b/4, and UPCR ≥ 1 mg/mg.
BP = blood pressure, BUN = blood urea nitrogen, Ca = calcium, CCIS = modified Charlson Comorbidity Index Score, CKD = chronic kidney disease, CI = confidence interval, Cr = creatinine, eGFR = estimated glomerular filtration rate, Hb = hemoglobin, HDL-C = high-density lipoprotein cholesterol, HT = hypertension, iPTH = intact para- thyroid hormone, LDL-C = low-density lipoprotein cholesterol, OR = odds ratio, P = phosphorus, Total-C = total cholesterol, UPCR = random urine protein/creatinine ratio.
ferent outcomes and risk profiles into categories G3a (eGFR 45–
59 mL/min/1.73 mg2) and G3b (eGFR 45–59 mL/min/1.73 mg2) (4). This study showed that outcomes and risk profiles as well as BP control patterns, were different between CKD G1–2/G3a and CKD G3b/G4. These results suggest that careful BP moni
toring and treatment are essential from the moment CKD pa
tients reach CKD G3b.
Non/reversedipping indicate that nighttime BP did not de
crease or was even higher than daytime BP. As non/reverse
dipping is considered a risk factor of cardiovascular events in nonCKD hypertensive patients, non/reversedipping is con
sidered a risk factor of CKD progression (27,28). Non/reverse
dipping was also shown to be a risk factor for cardiovascular events and correlated with markers for cardiovascular events in CKD patients (10,1416,28,29). Multiple factors cause suppressed nighttime BP decrease, such as older age, race, autonomic dys
function, abnormal sleepwake cycle, and sodium sensitivity (30). In addition, Feldstein et al. (31) reported that nondippers were associated with elevated serum Ca in elderly essential hy
pertensive patients with mildtomoderate CKD, and Kanbay et al. (32) reported that the nondipper clinical profile is related to serum Ca, P, and PTH in hypertensive patients with normal re
nal function. In this study, the nighttime/daytime SBP ratio cor
related significantly with the Ca × P product and iPTH. We also suggested that the Ca × P product, iPTH, and albumin were in
dependently associated with non/reversedippers in a multi
ple logistic regression model even after adjusting for eGFR. In particular, the Ca × P product independently correlated with non/reversedippers after adjusting for nighttime SBP and DBP.
Elevated serum P and Ca × P product were associated with poor
outcomes according to the International Dialysis Outcomes Practice Patterns Study and a cohort from The Netherlands that included both hemodialysis and peritoneal dialysis patients (33,34). Serum Ca, P, and PTH are factors that promote vascular calcification (35). Increased serum P also stimulates fibroblast growth factor23 (FGF23) and PTH secretion. Elevated FGF23 levels appear to be associated with poor clinical outcomes (35).
However, because FGF23 is not yet routinely measured in gen
eral clinical practice, a clinician should estimate CKDmineral bone disorders using parameters that can be measured easily.
The results of this study suggested that abnormal Ca, P, and PTH, all of which reflect abnormal mineral metabolism, vascular cal
cification, and poor outcome, could predict increased nighttime BP and non/reversedipping.
The high prevalence of whitecoat and masked HT in patients with CKD support the need to measure outofoffice BP, such as ABPM or home BP to confirm that a patient’s BP is under con
trol. In this study, the prevalence of whitecoat and masked HT was 10.1% and 26.9%, respectively. These results were similar to those of the African American Study of Kidney Disease Cohort study (2.2% and 42.9%, respectively), CKD Japan cohort (5.6%
and 30.9%, respectively), APrODiTe study (4.3% and 33.9%, re
spectively), and CRIC Study (4.1% and 27.8%, respectively) (10, 14,18,19). However, the prevalence of whitecoat HT and masked HT was respectively 18.3% and 8.3% in metaanalysis by Ban
gash and Agarwal and 28.8% and 7.0% in the Spanish ABPM Registry, suggesting that their prevalence was respectively ≥ 15%
and ≤ 10% (7,17). The differences in the prevalence of BP con
trol type are attributable to race, ethnicity, and renal function in addition to diagnostic thresholds.
Previous studies of CKD cohorts showed that masked HT was associated with low eGFR, elevated urine protein excretion, high
er left ventricular hypertrophy and higher pulse wave velocity (10,14,18,19). In this study, masked HT was associated with low
er eGFR, higher prevalence of CKD G3b/G4, and elevated UPCR than patients with normal BP. These data indicate that masked HT patients appear to have decreased renal function and ele
vated proteinuria. Therefore, clinician should carefully monitor outofoffice BP in CKD patients.
This study has several limitations. First, this was a crosssec
tional and observational study, and therefore, it has limitations in establishing a causeeffect relationship. Second, important parameters such as FGF23, echocardiography, and pulse wave velocity, were not obtained; this further limits the clarification of causality. Third, because ABPM was evaluated only once, vari
ability in measurements was not considered. This might result in some degree of misclassification. Finally, because this study had a small number of participants, its statistical power was not high enough for some parameters.
In conclusion, the median ABPM SBPs of CKD G3b and CKD G4 were significantly higher than those of CKD G1–2 and CKD
G3a. ABPM showed a high prevalence of non/reversedippers and sustained/masked HT. Non/reversedippers correlated with higher Ca × P product, higher iPTH, and lower albumin.
Whitecoat HT correlated with old age and sustained HT, with advanced CKD. Clinicians should attempt to perform ABPM in CKD patients, especially in those who are older or have advanced CKD as well as those who have abnormal Ca × P product, iPTH, and albumin.
DISCLOSURE
The authors have no potential conflicts of interest to disclose.
AUTHOR CONTRIBUTION
Conceptualization: Oh YK, Oh KH. Data curation: Oh YK, Chin HJ, Ahn SY, An JN, Lee JP, Lim CS, Oh KH. Formal analysis: Oh YK. Writing original draft: Oh YK.
ORCID
Yun Kyu Oh http://orcid.org/0000000186325743 Ho Jun Chin http://orcid.org/0000000311852631 Shin Young Ahn http://orcid.org/0000000268440614 Jung Nam An http://orcid.org/0000000151081005 Jung Pyo Lee http://orcid.org/0000000247141260 Chun Soo Lim http://orcid.org/0000000191236542 KookHwan Oh http://orcid.org/0000000195252179
REFERENCES
1. Coresh J, Astor BC, Greene T, Eknoyan G, Levey AS. Prevalence of chronic kidney disease and decreased kidney function in the adult US population:
Third National Health and Nutrition Examination Survey. Am J Kidney Dis 2003; 41: 1-12.
2. Ji E, Kim YS. Prevalence of chronic kidney disease defined by using CKD- EPI equation and albumin-to-creatinine ratio in the Korean adult popu- lation. Korean J Intern Med 2016; 31: 1120-30.
3. Kim S, Lim CS, Han DC, Kim GS, Chin HJ, Kim SJ, Cho WY, Kim YH, Kim YS. The prevalence of chronic kidney disease (CKD) and the associated factors to CKD in urban Korea: a population-based cross-sectional epi- demiologic study. J Korean Med Sci 2009; 24 Suppl: S11-21.
4. Kidney Disease Improving Global Outcome (KDIGO). KDIGO 2012 clini- cal practice guideline for the evaluation and management of chronic kid- ney disease. Kidney Int Suppl 2013; 3: 1-150.
5. Sarnak MJ, Levey AS, Schoolwerth AC, Coresh J, Culleton B, Hamm LL, McCullough PA, Kasiske BL, Kelepouris E, Klag MJ, et al. Kidney disease as a risk factor for development of cardiovascular disease: a statement from the American Heart Association Councils on Kidney in Cardiovas- cular Disease, High Blood Pressure Research, Clinical Cardiology, and Epidemiology and Prevention. Circulation 2003; 108: 2154-69.
6. James PA, Oparil S, Carter BL, Cushman WC, Dennison-Himmelfarb C,
Handler J, Lackland DT, LeFevre ML, MacKenzie TD, Ogedegbe O, et al.
2014 evidence-based guideline for the management of high blood pres- sure in adults: report from the panel members appointed to the Eighth Joint National Committee (JNC 8). JAMA 2014; 311: 507-20.
7. Gorostidi M, Sarafidis PA, de la Sierra A, Segura J, de la Cruz JJ, Banegas JR, Ruilope LM; Spanish ABPM Registry Investigators. Differences between office and 24-hour blood pressure control in hypertensive patients with CKD: a 5,693-patient cross-sectional analysis from Spain. Am J Kidney Dis 2013; 62: 285-94.
8. Muntner P, Anderson A, Charleston J, Chen Z, Ford V, Makos G, O’Connor A, Perumal K, Rahman M, Steigerwalt S, et al. Hypertension awareness, treatment, and control in adults with CKD: results from the Chronic Re- nal Insufficiency Cohort (CRIC) Study. Am J Kidney Dis 2010; 55: 441-51.
9. Lee SW, Kim YC, Oh SW, Koo HS, Na KY, Chae DW, Kim S, Chin HJ. Trends in the prevalence of chronic kidney disease, other chronic diseases and health-related behaviors in an adult Korean population: data from the Korean National Health and Nutrition Examination Survey (KNHANES).
Nephrol Dial Transplant 2011; 26: 3975-80.
10. Cha RH, Kim S, Yoon SA, Ryu DR, Oh JE, Han SY, Lee EY, Kim DK, Kim YS. Association between blood pressure and target organ damage in pa- tients with chronic kidney disease and hypertension: results of the APrODiTe study. Hypertens Res 2014; 37: 172-8.
11. Sarafidis PA, Li S, Chen SC, Collins AJ, Brown WW, Klag MJ, Bakris GL.
Hypertension awareness, treatment, and control in chronic kidney dis- ease. Am J Med 2008; 121: 332-40.
12. Pickering TG, James GD, Boddie C, Harshfield GA, Blank S, Laragh JH.
How common is white coat hypertension? JAMA 1988; 259: 225-8.
13. Pickering TG, Davidson K, Gerin W, Schwartz JE. Masked hypertension.
Hypertension 2002; 40: 795-6.
14. Pogue V, Rahman M, Lipkowitz M, Toto R, Miller E, Faulkner M, Rostand S, Hiremath L, Sika M, Kendrick C, et al. Disparate estimates of hyperten- sion control from ambulatory and clinic blood pressure measurements in hypertensive kidney disease. Hypertension 2009; 53: 20-7.
15. Wang C, Zhang J, Liu X, Li C, Ye Z, Peng H, Chen Z, Lou T. Reversed dip- per blood-pressure pattern is closely related to severe renal and cardio- vascular damage in patients with chronic kidney disease. PLoS One 2013;
8: e55419.
16. Fedecostante M, Spannella F, Cola G, Espinosa E, Dessì-Fulgheri P, Sar- zani R. Chronic kidney disease is characterized by “double trouble” high- er pulse pressure plus night-time systolic blood pressure and more se- vere cardiac damage. PLoS One 2014; 9: e86155.
17. Bangash F, Agarwal R. Masked hypertension and white-coat hyperten- sion in chronic kidney disease: a meta-analysis. Clin J Am Soc Nephrol 2009; 4: 656-64.
18. Iimuro S, Imai E, Watanabe T, Nitta K, Akizawa T, Matsuo S, Makino H, Ohashi Y, Hishida A; Chronic Kidney Disease Japan Cohort Study Group.
Clinical correlates of ambulatory BP monitoring among patients with CKD.
Clin J Am Soc Nephrol 2013; 8: 721-30.
19. Drawz PE, Alper AB, Anderson AH, Brecklin CS, Charleston J, Chen J, Deo R, Fischer MJ, He J, Hsu CY, et al. Masked hypertension and elevated night- time blood pressure in CKD: Prevalence and association with target or- gan damage. Clin J Am Soc Nephrol 2016; 11: 642-52.
20. Cohen DL, Huan Y, Townsend RR. Ambulatory blood pressure in chronic kidney disease. Curr Hypertens Rep 2013; 15: 160-6.
21. Levey AS, Stevens LA, Schmid CH, Zhang YL, Castro AF 3rd, Feldman HI,
Kusek JW, Eggers P, Van Lente F, Greene T, et al. A new equation to esti- mate glomerular filtration rate. Ann Intern Med 2009; 150: 604-12.
22. de la Sierra A, Redon J, Banegas JR, Segura J, Parati G, Gorostidi M, de la Cruz JJ, Sobrino J, Llisterri JL, Alonso J, et al. Prevalence and factors asso- ciated with circadian blood pressure patterns in hypertensive patients.
Hypertension 2009; 53: 466-72.
23. Williams JS, Brown SM, Conlin PR. Videos in clinical medicine. Blood- pressure measurement. N Engl J Med 2009; 360: e6.
24. Kastner C, Armitage J, Kimble A, Rawal J, Carter PG, Venn S. The Charlson comorbidity score: a superior comorbidity assessment tool for the pros- tate cancer multidisciplinary meeting. Prostate Cancer Prostatic Dis 2006;
9: 270-4.
25. Wu Z, Wu X, Xing F, Zhou S, Luo B, Wang L. Blood pressure characteris- tics in moderate to severe renal insufficiency. Kidney Blood Press Res 2015;
40: 478-89.
26. National Kidney Foundation. K/DOQI clinical practice guidelines for chron- ic kidney disease: evaluation, classification, and stratification. Am J Kid- ney Dis 2002; 39: S1-266.
27. Davidson MB, Hix JK, Vidt DG, Brotman DJ. Association of impaired di- urnal blood pressure variation with a subsequent decline in glomerular filtration rate. Arch Intern Med 2006; 166: 846-52.
28. Minutolo R, Agarwal R, Borrelli S, Chiodini P, Bellizzi V, Nappi F, Ciancia- ruso B, Zamboli P, Conte G, Gabbai FB, et al. Prognostic role of ambula- tory blood pressure measurement in patients with nondialysis chronic kidney disease. Arch Intern Med 2011; 171: 1090-8.
29. An HR, Park S, Yoo TH, Kang SW, Ryu JH, Lee YK, Yu M, Ryu DR, Kim SJ,
Kang DH, et al. Non-dipper status and left ventricular hypertrophy as pre- dictors of incident chronic kidney disease. J Korean Med Sci 2011; 26: 1185- 90.
30. Sinha AD, Agarwal R. The complex relationship between CKD and am- bulatory blood pressure patterns. Adv Chronic Kidney Dis 2015; 22: 102-7.
31. Feldstein C, Akopian M, Olivieri AO, Garrido D. Association between non- dipper behavior and serum calcium in hypertensive patients with mild- to-moderate chronic renal dysfunction. Clin Exp Hypertens 2012; 34: 417- 23.
32. Kanbay M, Isik B, Akcay A, Ozkara A, Karakurt F, Turgut F, Alkan R, Uz E, Bavbek N, Yigitoglu R, et al. Relation between serum calcium, phosphate, parathyroid hormone and ‘nondipper’ circadian blood pressure variabil- ity profile in patients with normal renal function. Am J Nephrol 2007; 27:
516-21.
33. Young EW, Albert JM, Satayathum S, Goodkin DA, Pisoni RL, Akiba T, Aki- zawa T, Kurokawa K, Bommer J, Piera L, et al. Predictors and consequenc- es of altered mineral metabolism: the Dialysis Outcomes and Practice Patterns Study. Kidney Int 2005; 67: 1179-87.
34. Noordzij M, Korevaar JC, Boeschoten EW, Dekker FW, Bos WJ, Krediet RT; Netherlands Cooperative Study on the Adequacy of Dialysis (NECOSAD) Study Group. The Kidney Disease Outcomes Quality Initiative (K/DOQI) guideline for bone metabolism and disease in CKD: association with mor- tality in dialysis patients. Am J Kidney Dis 2005; 46: 925-32.
35. Ott SM. Therapy for patients with CKD and low bone mineral density. Nat Rev Nephrol 2013; 9: 681-92.