INTRODUCTION
Atopic dermatitis is a chronically relapsing inflammatory skin disease commonly associated with respiratory or food allergy. Over 50% of patients with atopic dermatitis develop asthma and 75% develop allergic rhinitis in future (1, 2).
Thirty-sixty percent of children with moderate-severe atopic dermatitis have IgE-mediated clinical reactivity to food pro- teins (3, 4). Therefore, the data suggest that atopic dermati- tis is strongly related with food allergy.
Recent studies demonstrate an increasing prevalence of atopic diseases. An investigation into the worldwide preva- lence of atopic diseases as asthma, allergic rhinitis, and atopic eczema in school aged children showed rates of up to 20%
(5, 6). A cross-sectional questionnaire study in western coun- try conducted in the 1990s confirmed this increased preva- lence. For instance, questionnaire studies of Swedish school- children in 1979 and 1991 showed an increase in the preva- lence of atopic dermatitis among allergic diseases from 7%
in 1979 to 18% in 1991 (7). Studies from other continents indicate that the prevalence of atopic dermatitis is similar to Western countries (8). Several studies using identical proce- dures and assessment demonstrate a definite time trend toward the increase in atopic dermatitis cases over the past few decades (9, 10).
There is a number of clinical and laboratory evidences to
suggest the notion that food allergy plays a role in the patho- genesis of atopic dermatitis. But several clinical and labora- tory investigations support a role for food-specific IgE anti- body in the pathogenesis of atopic dermatitis. Walzer et al.
demonstrated that ingested food antigens penetrated the gas- trointestinal barrier and are transported in the circulation to IgE-bearing mast cells in the skin (11). In laboratory studies, T cells reactive to food allergen cloned from active lesions of atopic dermatitis (12), and elevated histamine releasing fac- tors in children with atopic dermatitis when consuming diet with allergenic food (13). However, the mechanisms of atopic dermatitis and food allergy remains poorly understood despite a number of considerable researches.
Epidemiological study has the potential to add greatly to our understanding by elucidating the risk factors for atopic dermatitis and food allergy and thereby suggesting produc- tive avenues for research into causation. Furthermore, Asian countries rarely have any epidemiological study in allergic diseases for facilitating international collaboration and com- parison of data.
The aims of the present study were to describe the preva- lence of atopic dermatitis and food allergy and to make the comparison of prevalence between 1995 and 2000, and bet- ween Seoul and provinces in Korea. In addition we tried to evaluate the correlation of prevalence between atopic dermati- tis and food allergy.
Jae-Won Oh, Bok-Yang Pyun*, Ji-Tae Choung�, Kang-mo Ahn�, Chul-Hong Kim�, Sang-Wook Song‖, Jin-Ah Son¶, Soo-young Lee**, Sang-Il Lee�
Department of Pediatrics, Hanyang University, Soonchunhyang University*, Korea University�, Sungkyunkwan University�, Kwandong University�, Saesungmo Hospital‖, National Medical Center¶, Ajou University**, Korea
Address for correspondence Sang-Il Lee, M.D.
Department of Pediatrics, Sungkyunkwan University School of Medicine, 50 Ilwon-dong, Gangnam-gu, Seoul 135-710, Korea
Tel : +82.2-3410-0043, Fax : +82.2-3410-0043 E-mail : [email protected]
716
Epidemiological Change of Atopic Dermatitis and Food Allergy in School-Aged Children in Korea between 1995 and 2000
Little is known about the prevalence of atopic dermatitis and food allergy outside North America and Europe. We evaluated the prevalence of atopic dermatitis and food allergy with the comparison of prevalence between 1995 and 2000 in Korea and evaluated the correlation of prevalence between atopic dermatitis and food aller- gy. A cross-sectional questionnaire survey was conducted on random samples of schoolchildren 6 to 14 yr at two time points, 1995 and 2000 throughout Korea. The last twelve months prevalence of atopic dermatitis in Korean school-aged children was increased from 1995 to 2000. The twelve-month prevalence of atopic dermati- tis and food allergy were higher in Seoul than in any other provincial cities in 1995, but the prevalence of both diseases in Seoul and Provincial Centers became to be similar in 2000. The rate responded to food allergy of children with atopic dermatitis (9.5%) was lower than that of the western countries (60%). And our data demon- strated paternal and maternal allergy history is very significantly correlated to devel- oping atopic dermatitis in their offspring. The further objective evaluations are required to confirm these outcomes because the environmental and risk factors may be dif- ferent among the countries according to their living cultures.
Key Words : Dermatitis, Atopic; Food Hypersensitivity; Prevalence
Received : 22 December 2003 Accepted : 20 May 2004
MATERIALS AND METHODS Subjects
The population of interest is schoolchildren within a given geographical area in Korea. A random sample of two age groups of children was studied: 6-12 yr olds (elementary schoolchildren) and 12-15 yr olds (middle schoolchildren).
The two centers for study were grouped: Seoul center which represented a metropolitan with a large population (over 10 million) and provincial center, which includes Suwon, Chung- ju, Changwon, Ulsan, Jeonju, Chunchon, Jeju and Ansan.
The Provincial Center represented relatively rural area with a small population, less pollution, and lower living standard compared to Seoul. The air pollution area represented a num- ber of industrial centers and factories collected in the city as Changwon, Ulsan and Ansan. The sampling unit was a school for each age group. Each school in the center, which contained the age group of interest, was numbered, and the schools were selected using a table of random numbers. Sampling of each age group separated. We obtained a complete school list from the Ministry of Education, and made 4 sampling frames; Seoul elementary, Seoul middle, Provincial elementary, and Provin- cial middle schools. We randomly sampled 10 from 503 ele- mentary and 10 from 347 middle schools in Seoul. For the other 8 provincial cities, we selected 3 schools from each city summing up to 24 from 253 elementary and 24 from 136 middle schools. The whole 6 grades in elementary and 3 grades in middle school contained our target age groups. We sam- pled about 150 children from each grade, and a total of 42,886 children in 1995 and 43,047 in 2000 were selected from 68 schools across the nation and 40,429 in 1995 and 42,202 in 2000 actually participated. The overall response rate was 94.9% in 1995 and 97.8% in 2000.
Data collection
The Korean version of ISAAC written questionnaire was administered to the parents of the children in elementary schools and to the student themselves in middle schools (14, 15). Response rates for each school were monitored during the study to make it sure that we had response rate over 90%.
We trained 18-20 pediatric allergy specialists and survey workers in one center, who made rounds across the nation to the selected schools afterwards. The survey was conduct- ed between September to November in 1995 and Septem- ber to November in 2000.
Statistical analysis
All data were entered into a computer using a specialized entry program for this particular study. It had special functions to reduce entry error, and we excluded if the respondent was out of the age 6-15 yr. The final number of subjects included
in the analysis was 38,955 in 1995 and 42,081 in 2000.
Lifetime and last 12-month prevalences were calculated by dividing positive responses to each question by the num- ber of completed questionnaires. Ninety five percent confi- dence intervals (CI) of the prevalence were estimated in indi- vidual level. The definition of 12-month prevalence of symp- toms of eczema were also restricted to the proportion of chil- dren having atopic dermatitis in last 12-months with the involvement of flexural area only, such as folds of the elbows, behind the knees, in front of ankles, under the buttocks, or around the neck, ears, or eyes, for the same reason. It was de- fined as the symptom of ‘flexural eczema’. As for other symp- tom prevalence, we simply calculated the positive rates of the
“Have you ever ---” and “In last 12-months ---” question items in each symptom module (11, 12). Since the survey methods for elementary and for middle schools were different, we cal- culated the prevalence separately. Twelve-month prevalences of symptoms by sex, age, and region were calculated and com- pared using 2test and 95% confidence intervals. Confidence intervals were calculated using the normal approximation of the binominal distribution. Logistic regression was used to analyze the effect of several risk factors on 12-month symp- tom prevalence. Adjusted odds ratio (aOR) and its 95% CI were derived from the asymptomatic chi-square distribution of the likelihood ratio test, using age, sex. The SAS system for Windows V6.12 was used for all the analysis.
RESULTS
The total number of respondents was 40,429, of which 25,361 (62.7%) were from elementary schools and 15,068 (37.7%) were from middle schools in 1995 and 42,202, of which 27,425 (64.9%) were from elementary schools and 14,777 (35.0%) were from middle schools in 2000. The age and sex distribution of the study group is shown in Table 1.
Change of prevalence of atopic dermatitis between 1995 and 2000
Table 2 shows the prevalence of atopic dermatitis in school- aged children in 1995 and 2000. The lifetime prevalence of itchy eczema was increased from 1995 to 2000 in 6-12 yr olds (15.3% in 1995 and 17.0% in 2000) and in 12-15 yr olds (7.2% in 1995 and 9.2% in 2000). Twelve-month preva- lence of flexural eczema was also increased from 1995 to 2000 in both 6-12 yr olds (7.3% in 1995 and 10.7% in 2000) and 12-15 yr olds (3.9% in 1995 and 6.1% in 2000). The mean lifetime prevalence of atopic dermatitis, which had ever been diagnosed by medical doctors were 24.9% in 6-12 yr olds and 12.8% in 12-15 yr olds respectively in 2000.
Change of prevalence of food allergy between 1995 and 2000
The lifetime prevalence of food allergy was not significant- ly different from 1995 to 2000 in 6-12 yr olds (10.9% in 1995 and 8.9% in 2000) and in 12-15 yr olds (11.3% in 1995 and 12.6% in 2000). Twelve-month prevalence of food allergy also showed no differences from 1995 to 2000 in both
6-12 yr olds (6.5% in 1995 and 5.7% in 2000) and 12-15 yr olds (7.4% in 1995 and 8.6% in 2000). The mean lifetime prevalence of food allergy, which had ever been diagnosed by medical doctor, was 4.7% in 6-12 yr olds and 5.1% in 12-15 yr olds respectively in 2000 survey shown as Table 3.
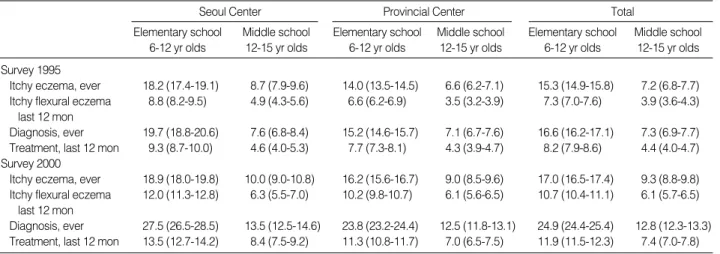
Seoul Center Provincial Center Total
Elementary school Middle school Elementary school Middle school Elementary school Middle school
6-12 yr olds 12-15 yr olds 6-12 yr olds 12-15 yr olds 6-12 yr olds 12-15 yr olds
Survey 1995
No. of school 10 10 24 24 34 34
No. of subjects 8,025 4,439 17,336 10,629 25,361 15,068
Male (%) 3,952 (49.1) 2,741 (61.7) 8,497 (49.0) 5,404 (50.8) 12,449 (49.1) 8,145 (54.1)
Age (yr) 6 (%) 586 (7.6) - 1,147 (7.0) - 1,733 (7.2) -
7 (%) 1,174 (15.2) - 2,587 (15.7) - 3,761 (15.6) -
8 (%) 1,317 (17.0) - 2,665 (16.2) - 3,982 (16.5) -
9 (%) 1,344 (17.4) - 2,659 (16.2) - 4,003 (16.6) -
10 (%) 1,276 (16.5) - 2.807 (17.1) - 4,083 (16.9) -
11 (%) 1,311 (17.0) - 2,848 (17.3) - 4,159 (17.2) -
12 (%) 727 (9.4) 623 (14.3) 1,726 (10.5) 1,471 (14.1) 2,453 (10.2) 2,094 (14.2)
13 (%) - 1,407 (32.3) - 3,605 (34.6) - 5,012 (33.9)
14 (%) - 1,509 (34.6) - 3,494 (33.5) - 5,003 (33.9)
15 (%) - 823 (18.9) - 1,849 (17.8) - 2,672 (18.1)
Survey 2000
No. of school 10 10 24 24 34 34
No. of subjects 7,977 4,420 19,862 10,794 27,425 14,777
Male (%) 41,09 (51.6) 2,700 (61.1) 10,070 (50.7) 5,602 (51.9) 14,179 (50.9) 8,302 (54.6)
Age (yr) 6 (%) 433 (5.4) - 1,000 (5.0) - 1,433 (5.2) -
7 (%) 1,328 (16.7) - 3,259 (16.4) - 4,587 (16.5) -
8 (%) 1,419 (17.8) - 3,320 (16.7) - 4,739 (17.0) -
9 (%) 1,268 (15.9) - 3,413 (17.2) - 4,681 (16.8) -
10 (%) 1,318 (16.5) - 3,415 (17.2) - 4,733 (17.0) -
11 (%) 1,283 (16.1) - 3,201 (16.1) - 4,484 (16.1) -
12 (%) 922 (11.6) 464 (10.5) 2,254 (11.4) 1,152 (10.7) 3,176 (11.4) 1,616 (10.6)
13 (%) - 1,476 (33.4) - 3,695 (34.2) - 5,171 (34.0)
14 (%) - 1,420 (32.1) - 3,690 (34.2) - 5,110 (33.6)
15 (%) - 1,060 (24.0) - 2,257 (20.9) - 3,317 (21.8)
Table 1.Response rate and age distribution of the subjects in 1995 and 2000
Seoul Center Provincial Center Total
Elementary school Middle school Elementary school Middle school Elementary school Middle school 6-12 yr olds 12-15 yr olds 6-12 yr olds 12-15 yr olds 6-12 yr olds 12-15 yr olds Survey 1995
Itchy eczema, ever 18.2 (17.4-19.1) 8.7 (7.9-9.6) 14.0 (13.5-14.5) 6.6 (6.2-7.1) 15.3 (14.9-15.8) 7.2 (6.8-7.7) Itchy flexural eczema 8.8 (8.2-9.5) 4.9 (4.3-5.6) 6.6 (6.2-6.9) 3.5 (3.2-3.9) 7.3 (7.0-7.6) 3.9 (3.6-4.3)
last 12 mon
Diagnosis, ever 19.7 (18.8-20.6) 7.6 (6.8-8.4) 15.2 (14.6-15.7) 7.1 (6.7-7.6) 16.6 (16.2-17.1) 7.3 (6.9-7.7) Treatment, last 12 mon 9.3 (8.7-10.0) 4.6 (4.0-5.3) 7.7 (7.3-8.1) 4.3 (3.9-4.7) 8.2 (7.9-8.6) 4.4 (4.0-4.7) Survey 2000
Itchy eczema, ever 18.9 (18.0-19.8) 10.0 (9.0-10.8) 16.2 (15.6-16.7) 9.0 (8.5-9.6) 17.0 (16.5-17.4) 9.3 (8.8-9.8) Itchy flexural eczema 12.0 (11.3-12.8) 6.3 (5.5-7.0) 10.2 (9.8-10.7) 6.1 (5.6-6.5) 10.7 (10.4-11.1) 6.1 (5.7-6.5)
last 12 mon
Diagnosis, ever 27.5 (26.5-28.5) 13.5 (12.5-14.6) 23.8 (23.2-24.4) 12.5 (11.8-13.1) 24.9 (24.4-25.4) 12.8 (12.3-13.3) Treatment, last 12 mon 13.5 (12.7-14.2) 8.4 (7.5-9.2) 11.3 (10.8-11.7) 7.0 (6.5-7.5) 11.9 (11.5-12.3) 7.4 (7.0-7.8)
*Numbers in parentheses indicate 95% confidence intervals.
Table 2.Prevalences of atopic dermatitis in Korean school aged children
The comparison of twelve-month prevalence of atopic dermatitis and food allergy between Seoul and Provincial Centers
The twelve-month prevalence of atopic dermatitis was higher in Seoul than in other provincial cities in 1995 (atopic dermatitis; 11.4% vs. 8.1% in 6-7 yr olds, 4.8% vs. 3.7% in 13-14 yr olds), but the twelve-month prevalence of atopic dermatitis and food allergy in provincial regions were in- creased from 1995 to 2000 and the prevalence of both dis- eases in Seoul and Provincial Centers became to be similar in 2000 survey (atopic dermatitis; 13.5% vs. 12.5% in 6-7 yr olds, 6.2% vs. 6.2% in 13-14 yr olds, food allergy; 4.3%
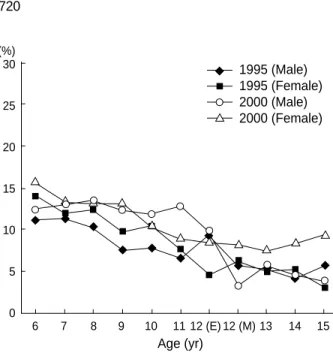
vs. 5.3% in 6-7 yr olds, 10.0% vs. 8.0% in 13-14 yr olds) shown as in Table 4, and the age matched prevalence of atopic dermatitis in Seoul Center and Provincial Center were showed with the age in Fig. 1, 2. The prevalence of atopic dermati- tis in Seoul and Provincial Center was decreased with aging in 1995 and 2000.
Risk factors
As shown in Table 5, age is significantly correlated with the protective effect developing atopic dermatitis in 6-12 yr old children (aOR: 0.871 in 1995; 0.899 in 2000), but is not correlated in 12-15 yr old children. In gender, male is preponderant in 6-12 yr old children (aOR: 0.949 in 1995;
0.935 in 2000). Living in urban area or air pollution area is one of the risk factors in 6-12 yr old children, but living with cats and dogs does not seem to be correlated with atopic der- matitis. Body mass index (BMI) is correlated in 12-15 yr old children, but not in 6-12 yr old children, whereas prema- ture born history is also correlated to developing atopic der- matitis. In 2000 survey, parental allergy history, such as asth- ma, allergic rhinitis, and atopic dermatitis, especially par- ent’s atopic dermatitis history is shown to be significantly correlated to developing their offspring’s atopic dermatitis as shown in Table 5.
Seoul Center Provincial Center Total
Elementary school Middle school Elementary school Middle school Elementary school Middle school 6-12 yr olds 12-15 yr olds 6-12 yr olds 12-15 yr olds 6-12 yr olds 12-15 yr olds Survey 1995
Symptom, ever 12.4 (11.7-13.1) 13.0 (12.0-14.0) 10.1 (9.7-10.6) 10.5 (10.0-11.1) 10.9 (10.5-11.2) 11.3 (10.8-11.8) Symptom, last 12 mon 7.2 (6.6-7.8) 8.9 (8.1-9.8) 6.2 (5.8-6.6) 6.8 (6.4-7.3) 6.5 (6.2-6.8) 7.4 (7.0-7.9) Diagnosis, ever 4.6 (4.1-5.0) 4.5 (3.9-5.2) 4.1 (3.8-4.4) 3.5 (3.1-3.8) 4.2 (4.0-4.5) 3.8 (3.5-4.1) Treatment, last 12 mon 2.9 (2.5-3.3) 2.5 (2.1-3.0) 2.7 (2.4-2.9) 1.8 (1.5-2.0) 2.7 (2.5-2.9) 2.0 (1.8-2.2) Survey 2000
Symptom, ever 9.5 (8.8-10.5) 13.8 (12.7-14.8) 8.6 (8.2-9.3) 12.2 (8.5-9.6) 8.9 (8.5-9.2) 12.6 (12.8-13.1) Symptom, last 12 mon 5.9 (5.3-6.4) 9.4 (8.5-10.2) 5.6 (5.3-5.9) 8.3 (7.7-8.8) 5.7 (5.4-5.9) 8.6 (8.1-9.2) Diagnosis, ever 5.2 (4.7-5.7) 5.4 (4.8-6.1) 4.6 (4.3-4.8) 5.0 (4.6-5.4) 4.7 (3.5-5.0) 5.1 (4.8-5.5) Treatment, last 12 mon 2.7 (2.3-3.0) 2.4 (1.9-2.8) 2.5 (2.3-2.7) 2.0 (1.8-2.3) 2.6 (2.4-2.7) 2.1 (1.9-2.4)
*Numbers in parentheses indicate 95% confidence intervals.
Table 3.Prevalences of food allergy in Korean school aged children
6-7 yr olds 13-14 yr olds
Seoul Province Total Seoul Province Total
Survey 1995
Atopic dermatitis 11.4 (10.0-12.9) 8.1 (7.3-9.1) 9.2 (8.4-10.0) 4.8 (4.1-7.8) 3.7 (3.3-4.1) 4.0 (3.7-4.4)
Boys 10.9 (9.0-13.1) 8.0 (6.9-9.3) 9.0 (8.0-10.1) 4.8 (3.9-5.9) 3.9 (3.4-4.6) 4.2 (3.7-4.8)
Girls 11.7 (9.7-14.0) 8.3 (7.1-9.6) 9.4 (8.3-10.6) 4.9 (3.8-6.4) 3.3 (2.8-4.1) 3.8 (3.2-4.4) Food Allergy 7.0 (5.9-8.3) 6.4 (5.6-7.2) 6.6 (5.9-7.2) 8.2 (7.2-9.2) 7.0 (6.4-7.6) 7.3 (6.8-7.9)
Boys 7.1 (5.6-9.0) 6.9 (5.9-8.1) 7.0 (6.1-8.0) 7.3 (6.2-8.6) 6.1 (5.4-6.9) 6.5 (5.9-7.2)
Girls 6.8 (5.3-8.7) 5.7 (4.7-6.9) 6.1 (5.2-7.1) 9.6 (8.1-11.6) 7.9 (7.1-8.9) 8.4 (7.6-9.2)
Survey 2000
Atopic dermatitis 13.5 (11.8-15.1) 12.5 (11.5-13.6) 12.8 (11.9-13.7) 6.2 (5.3-7.1) 6.2 (5.6-6.7) 6.2 (5.7-6.6) Boys 12.9 (10.6-15.1) 12.0 (10.6-13.3) 12.2 (11.0-13.4) 5.2 (4.1-6.2) 5.7 (5.0-6.5) 5.6 (5.0-6.2) Girls 14.1 (11.7-16.5) 13.2 (11.7-14.7) 13.4 (12.2-14.7) 7.9 (6.3-9.6) 6.6 (6.3-6.9) 6.9 (6.2-7.7) Food Allergy 4.3 (3.4-5.3) 5.3 (4.6-6.0) 5.0 (4.5-5.6) 10.0 (8.9-11.2) 8.0 (7.4-8.6) 8.6 (8.0-9.1)
Boys 4.8 (3.3-6.2) 5.2 (4.3-6.2) 5.1 (4.3-5.9) 9.4 (8.0-10.7) 7.2 (6.4-8.0) 7.9 (7.2-8.6)
Girls 3.9 (2.5-5.2) 5.4 (4.4-6.4) 4.9 (4.1-5.8) 11.2 (9.3-13.11) 8.9 (7.9-9.8) 9.4 (8.6-10.3)
*Numbers in parentheses indicate 95% confidence intervals.
Table 4.Twelve-month prevalences of atopic dermatitis and food allergy in the age of 6-7 yr olds and 13-14 yr old
The rate having food allergy in children with atopic der- matitis
The diagnosis rates were selected for the comparison of prevalence of food allergy among children with atopic der- matitis because of its accuracy. In elementary schoolchildren, 646 children (9.5%) had ever been diagnosed the food aller- gy among 6,824 children with atopic dermatitis diagnosed by medical doctors. In middle schoolchildren, 179 children (9.5%) had ever been diagnosed the food allergy among 1,879 children with atopic dermatitis diagnosed by medical doc- tors. There were no differences of prevalence between Seoul Center and Provincial Center, and there were no differences of prevalence between elementary- and middle school-aged children (Table 6).
Common food allergen identified from questionnaire
We sampled and evaluated the answers for the food aller- gen questionnaire. We selected the subjects that were diag- nosed by medical doctor and checked the food allergens that they suffered from. As shown in Table 7, most common aller- gen was egg (21.3% in 6-12 yr olds, 12.7% in 13-15 yr olds), and followed by milk (15.1% in 6-12 yr olds, 13.9% in 13- 15 yr olds), fish (14.9% in 6-12 yr olds, 12.5% in 13-15 yr olds), seafood such as crab, lobster, shellfish (7.6% in 6-12 yr olds, 16.6% in 13-15 yr olds).
DISCUSSION
The mean lifetime prevalence of atopic dermatitis, which
1995 2000
6-12 yr olds 12-15 yr olds 6-12 yr olds 12-15 yr olds
Age (yr) 0.871* (0.855-0.888) 1.041 (0.920-1.096) 0.899* (0.885-0.913) 1.046 (0.993-1.101)
Sex (female) 0.949* (0.888-1.015) 1.041 (0.920-1.179) 0.935* (0.885-0.988) 1.272 (1.155-1.402)
Body mass index 1.005 (0.992-1.019) 1.064* (1.043-1.085) 1.009 (0.999-1.019) 1.034* (1.017-1.051) Center (Seoul) 1.369* (1.277-1.468) 1.070 (0.935-1.223) 1.215* (1.145-1.290) 1.096 (0.843-1.159) Living with dog or cat 0.908 (0.813-1.014) 1.171 (0.982-1.396) 0.873 (0.805-0.946) 0.972 (0.874-1.159)
Pollution area - - 1.111* (1.030-1.199) 1.197* (1.054-1.360)
Premature born - - 1.218* (1.076-1.378) 1.440* (1.113-1.862)
Paternal allergy - - 2.154* (2.024-2.292) 2.376* (2.104-2.683)
Paternal atopic dermatitis 2.723* (2.515-2.948) 3.398* (2.933-3.937)
Maternal allergy - - 2.068* (1.948-2.195) 2.302* (2.064-2.567)
Maternal atopic dermatitis 2.574* (2.379-2.785) 2.747* (2.431-3.105)
Values express adjusted odds ratio (aOR) and its 95% confidence interval (CI) of risk factors. *p<0.05.
Table 5.Risk factors for the prevalence of atopic dermatitis based on diagnosis in school-aged children in Korea (%)
30
25
20
15
10
5
0
6 7 8 9 10 11 12 (E) 12 (M) 13 14 15 (%)
30
25
20
15
10
5
0
6 7 8 9 10 11 12 (E) 12 (M) 13 14 15 Age (yr)
Fig. 1.The aged matched comparison of twelve month preva- lence of atopic dermatitis between 1995 and 2000 in school-aged children in Seoul Center, Korea. The prevalence of atopic der- matitis in Seoul Center was decreased with age in both 1995 and 2000. (E): Elementary school, (M): middle school.
Age (yr)
Fig. 2.The age matched comparison of prevalence of atopic der- matitis between 1995 and 2000 in school-aged children in Provin- cial Center, Korea. The prevalence of atopic dermatitis in Provin- cial Center was decreased with age in both 1995 and 2000.
1995 (Male) 1995 (Female) 2000 (Male) 2000 (Female)
1995 (Male) 1995 (Female) 2000 (Male) 2000 (Female)
had ever been diagnosed by doctors, was 24.9% in 6-12 yr olds and 12.8% in 12-15 yr olds respectively in 2000 in the present study. The results demonstrate the diagnosis rate of atopic dermatitis was apparently similar to the rate of west- ern countries. According to prevalence surveys of atopic der- matitis in Scandinavian schoolchildren, the current lifetime prevalence of atopic dermatitis in Denmark in children 7 yr of age is about 20%. With clinical examination, a frequency of 30% to 35% is encountered in the northern part of Scan- dinavia (5).
In our study, the lifetime prevalence of itchy eczema was lower than the diagnosis rate in 2000. This outcome may suggest the possibility that the prevalence of diagnosis might be overestimated in the study or parents or children answered questionnaires might misunderstand the atopic eczema in questionnaires. If standardized, validated, and reproducible diagnostic criteria are applied and are translated into Korean languages with the original meaning intact, researchers may have an instrument that allows comparisons in different regions and different times. However, in epidemiological studies, the ideal situation in which all children with atopic dermatitis are identified cannot be expected. Because most of the diago- nostic approaches by Hanifin and Rajka (13) were included in the Korean atopic dermatitis guidelines, and most Kore- an allergist and dermatologist have used this diagnostic cri- teria. Although the criteria were developed in a hospital based setting, they were shown to have a sensitivity of 74% to 80%
and a specificity of 97% to 99% (14). The other assumption for this outcome that several population-based studies eval- uating the severity of eczema consider that most of the atopic dermatitis population had mild eczema (15, 16). This situa- tion suggests many parents or patients may ignore their mild eczema symptom, nevertheless they might recall the doctor’s diagnosis for atopic dermatitis because doctor’s diagnosis is more impressive to patients.
The present data result demonstrated that atopic dermati- tis is improved or outgrown as becoming older in 6-12 yr olds. In addition, we took the twelve-month prevalence for the precise, near-the year prevalence of atopic dermatitis and food allergy. Twelve-month prevalence of atopic dermatitis
in 2000 was apparently increased than the prevalence in 1995.
Relatively few studies have focused on potential, initiat- ing risk factors for atopic dermatitis. Most population-based studies of atopic dermatitis in schoolchildren demonstrated preponderance in female (17). Our study also presents female is more correlated to expressing atopic dermatitis in 6-12 yr old children whereas gender is not shown a relationship in 12-15 yr old children. Our data suggests that gender pre- ponderance is dependent on age group surveyed. The living in urbanized area with air pollution seems to be correlated to developing atopic dermatitis in our studies. This result is concordant with the previous study in Korea (18). Interest- ingly the studies in Germany after reunification offered an opportunity to evaluate the effect of Eastern and Western lifestyles on the prevalence of atopic disorders in two ethni- cally similar populations that live under similar climatic con- ditions but with a different pattern of air pollution and life- style. After reunification, the increased prevalence of atopic dermatitis in East Germany coincided with a significant de- cline in SO2 levels (19). Living with cat and dog was not significantly correlated to having atopic dermatitis in the present study. However, we estimate that this resulted from the limitation of questionnaire survey. Parents or patients may have avoided the pets from house since having atopic dermatitis. Cross sectional studies have reported impaired growth in children with atopic dermatitis (20-22). Our results show that body mass index (BMI) is correlated in 12-15 yr old children, but not in 6-12 yr old children. It may suggest it is likely to temporary and reversible if growth impairment occurs in childhood. Also, our data demonstrated paternal and maternal allergy history is very significantly correlated
Numbers in parenthesis express the percentage of food allergy among children with atopic dermatitis. AD, atopic dermatitis; FA, food allergy.
AD only FA only AD and FA
Elementary schoolchildren
Total 6,824 1,299 646 (9.5)
Seoul 2,160 405 211 (9.8)
Province 4,664 894 435 (9.3)
Middle schoolchildren
Total 1,879 755 179 (9.5)
Seoul 578 233 61 (10.6)
Province 1,301 522 118 (9.1)
Table 6.Prevalence of food allergy among children with atopic dermatitis diagnosed by medical doctors
Numbers in parenthesis express express the percentage of each food species.
6-12 yr (n=1,299) 12-15 yr (n=755)
Cow’s milk 196 (15.1) 105 (13.9)
Egg 277 (21.3) 96 (12.7)
Soybean 43 (3.3) 19 (2.5)
Peanut 36 (2.8) 14 (1.9)
Buckwheat 25 (1.9) 19 (2.5)
Wheat 12 (0.9) 11 (1.5)
Fish 194 (14.9) 94 (12.5)
Seafood 99 (7.6) 125 (16.6)
Pork 132 (10.2) 51 (6.8)
Beef 60 (4.6) 64 (8.5)
Chicken 90 (6.9) 34 (4.5)
Peach 58 (4.5) 98 (13.0)
Tomato 13 (1.0) 7 (0.9)
Apple 12 (0.9) 18 (2.4)
Banana 3 (0.2) 9 (1.2)
Other fruit 40 (30.8) 42 (5.6)
Other food 421 (32.4) 318 (42.1)
Table 7.Common food allergens identified from questionnaire for food allergy in school-aged children of Seoul Center in Korea, 2000
to developing atopic dermatitis in their offspring. Especially atopic eczema in parent was one of the strongest risk factors.
Many investigations on environmental influences have found parental history of atopy or eczema to be one of the strongest risk factors (23).
The prevalence of clinically relevant food allergy among children with atopic dermatitis remains an unanswered ques- tion. Schloss et al. (24) documented several cases of improv- ing their eczematous skin lesions after avoiding specific foods.
A number of studies followed that report with controversy about the role of specific food allergens in atopic dermatitis (25-28). They all presented that approximately one third of children with moderate to severe atopic dermatitis were deter- mined to have clinically relevant to food allergy, but the study has been criticized because of some selection bias. But, the results from our questionnaire survey present that 9.5% of children with atopic dermatitis responded to have food aller- gy in both elementary and middle school aged children. Our data was so different to the data of the previous studies in western countries. There are some reasons of difference bet- ween them. First, the triggering and risk factors may be dif- ferent among the countries according to their living cultures.
Considering that there are many triggers for atopic dermatitis including specific allergens such as aeroallergens and staphy- lococcal enterotoxins as well as food allergen, and nonspecific triggers such as heat, humidity, irritants, and stress (29). Sec- ond, most previous studies evaluated the food allergy-asso- ciated atopic dermatitis in young children less than 10 yr old or children with moderate to severe atopic dermatitis. The population of our study was 6-15 yr old school children and food allergy might be outgrown in children with atopic der- matitis as becoming older.
In the present survey, most common food allergen was egg followed by milk, fish, and seafood in 6-12 yr old children, and was seafood, followed by peach, milk, egg, and fish in 12-15 yr old children. In western country, egg, milk, peanut, wheat, and soy account for more than 85% of reactions as big 5 food allergen, and most children outgrow their aller- gies to milk, eggs, wheat, and soy, whereas patients allergic to peanut are less likely to lose their clinical response (30).
In different way to western studies, milk, peanut and wheat are rare allergens whereas buckwheat, pork, some fruits such as peach, apple are more common allergen in Korean school aged children. The present results demonstrate that species of food allergen is specific according to each country depen- dent to the living and diet culture.
In summary, the lifetime and last twelve months preva- lence of atopic dermatitis in Korean school-aged children was increased from 1995 to 2000. The present results suggest the public awareness of atopic dermatitis may have improved because of nationwide education for allergic diseases. How- ever, the diagnostic rate is higher than symptomatic rate of atopic dermatitis in our study. Living in urbanized area with air pollution is correlated to developing atopic dermatitis in
children. Parental allergies also are highly correlated to the offspring’s atopic dermatitis. The prevalence of food allergy in school-aged children was not significantly different from 1995 to 2000, and the treatment rate of food allergy was lower than the treatment rate of atopic dermatitis. In addi- tion, the correlation rate of children with atopic dermatitis responded to have food allergy was lower than the previous studies in western countries, and such differences may be explained by the different racial, environmental, and cultural factors.
ACKNOWLEDGEMENT
The authors thank the devotion and help of the Seoul School Health Center and the pediatricians, who were the members of Korean Academy of Pediatric Allergy and Respiratory Dis- ease (KAPARD) and participated in the survey.
REFERENCES
1. Barnetson RS, Rogers M. Childhood atopic eczema. BMJ 2002;
324: 1376-9.
2. Sears MR. Epidemiology of childhood asthma. Lancet 1997; 350:
1015-20.
3. Sampson HA, McCaskill CC. Food hypersensitivity and atopic der- matitis: evaluation of 113 patients. J Pediatr 1985; 107: 669-75.
4. Burks AW, Mallory SB, Williams LW, Shirrell MA. Atopic dermati- tis: Clinical relevance of food hypersensitivity reactions. J Pediatr 1988; 113: 447-51.
5. Williams H, Robertson C, Stewart A, Ait-Khaled N, Anabwani G, Andesson R, Asher I, Beasley R, Bjorksten B, Burr M, Clayton T, Crane J, Ellwood P, Keil U, Lai C, Mallol J, Martinez F, Mitchell E, Montefort S, Pearce N, Shah J, Sibbald B, Strachan D, von Mutius E, Weiland SK. Worldwide variations in the prevalence of symptoms of atopic eczema in the international study of asthma and allergies in childhood. J Allergy Clin Immunol 1999; 103: 125-38.
6. Burr ML, Butland BK, King S, Vaughan-Williams E. Changes in asthma prevalence: Two surveys 15 years apart. Arch Dis Child 1989; 64: 1452-6.
7. Aberg N, Hesselmar B, Aberg B, Eriksson B. Increase of asthma, allergic rhinitis and eczema in Swedish schoolchildren between 1979 and 1991. Clin Exp Allergy 1995; 25: 815-9.
8. Peat JK, van den Berg RH, Green WF, Mellis CM, Leeder SR, Wool- cock AJ. Changing prevalence of asthma in Australian children. BMJ 1994; 308: 1591-6.
9. Sugiura H, Umemoto N, Deguchi H, Murata Y, Tanaka K, Sawai T, Omoto M, Uchiyama M, Kiriyame T, Uehara M. Prevalence of child- hood and adolescent atopic dermatitis in a Japanese population: Com- parison with the disease frequency examined 20 years ago. Acta Derm Venereol (Stockh) 1998; 78: 293-4.
10. Mortz CG, Lauritsen JM, Bindslev-Jensen C, Andersen KE. Preva- lence of atopic dermatitis, asthma, allergic rhinitis, and hand and
contact dermatitis in adolescents. The Odense Adolescence Cohort Study on Atopic Diseases and Dermatitis. Br J Dermatol 2001; 144:
523-32.
11. Walzer M. Studies in absorption of undigested proteins in human beings: I. A simple direct method of studying the absorption of undi- gested protein. J Immunol 1997; 14: 143-74.
12. The International Study of Asthma and Allergies in Childhood (ISAAC) Steering Committee. Worldwide variation in prevalence of symptoms of asthma, allergic rhinoconjunctivitis, and atopic eczema:
ISAAC. Lancet 1998; 351: 1225-32.
13. Hanifin JM, Rajka G. Diagnostic features of atopic dermatitis. Acta Derm Venereol Suppl (Stockh) 1980; 92: 44-7.
14. Marks R, Kilkenny M, Plunkett A, Merlin K. The prevalence of com- mon skin conditions in Australian school students: II. Atopic dermati- tis. Br J Dermatol 1999; 140: 468-73.
15. Dotterud LK, Kvammen B, Lund E, Falk ES. Prevalence and some clinical aspects of atopic dermatitis in the community of S r-Varanger.
Acta Derm Venereol (Stockh) 1995; 75: 50-3.
16. Kuehr J, Frischer T, Karmaus W, Meinert R, Barth R, Urbanek R.
Clinical atopy and associated factors in primary-school pupils. Aller- gy 1992; 47: 650-5.
17. Schultz Larsen F, Hanifin JM. Secular change in the occurrence of atopic dermatitis. Acta Derm Venereol (Stockh) 1992; 176 (Suppl):
7-12.
18. Kim CW, Park CJ, Kim JW, Koo DW, Kim KW, Kim TY. Preva- lence of atopic dermatitis in Korea. Acta Derm Venereol (Stockh) 2000; 80: 353-6.
19. von Mutius E, Weiland SK, Fritzsch C, Duhme H, Keil U. Increas- ing prevalence of hay fever and atopy among children in Leipzig,
East Germany. Lancet 1998; 351: 862-6.
20. Kristmundsdottir F, David TJ. Growth impairment in children with atopic eczema. J R Soc Med 1987; 80: 9-12.
21. Pike MG, Chang CL, Atherton DJ, Carpenter RG, Preece MA. Growth in atopic eczema: a controlled study by questionnaire. Arch Dis Child 1989; 64: 1566-9.
22. Massarano AA, Hollis S, Devlin J, David TJ. Growth in atopic eczema.
Arch Dis Child 1993; 68: 677-9.
23. Schultz Larsen F. Genetic epidemiology of atopic dermatitis. In Williams HC (ed): Atopic dermatitis: The Epidemiology, causes and Preven- tion of Atopic Eczema. Cambridge, Cambridge University Press, 2000; 113-24.
24. Schloss OM. Allergy to common foods. Trans Am Pediatr Soc 1915;
27: 62-8.
25. Kaplan AP, Haak-Frendscho M, Fauci A, Dinarello C, Halbert E. A histamine-releasing factor from activated human mononuclear cells.
J Immunol 1985; 135: 2027-32.
26. Hanifin JM. Critical evaluation of food and mite allergy in the man- agement of atopic dermatitis. J Dermatol 1997; 24: 495-503.
27. Reekers R, Beyer K, Niggemann B, Wahn U, Freihorst J, Kapp A, Werfel T. The role of circulating food antigen-specific lymphocytes in food allergic children with atopic dermatitis. Br J Dermatol 1996;
135: 935-41.
28. Sampson HA, McCaskill CC. Food hypersensitivity and atopic der- matitis: evaluation of 113 patients. J Pediatr 1985; 107: 669-75.
29. Sicherer SH, Sampson HA. Food hypersensitivity and atopic der- matitis: pathophysiology, epidemiology, diagnosis, and management.
J Allergy Clin Immunol 1999; 104: S114-22.
30. Sampson HA. Food allergy. JAMA 1997; 278: 1888-94.