Copyright © 2016 The Korean Society for Bone and Mineral Research
This is an Open Access article distributed under the terms of the Creative Commons Attribution Non-Commercial Li- cense (http://creativecommons.org/licenses/by-nc/4.0/) which permits unrestricted non-commercial use, distribu- tion, and reproduction in any medium, provided the original work is properly cited.
Relationship between Heavy Metal Exposure and Bone Mineral Density in Korean Adult
Hee-Sook Lim1,2, Hae-Hyeog Lee3, Tae-Hee Kim3, Bo-Ra Lee4
1Department of Clinical Nutrition, Soonchunhyang University Bucheon Hospital, Bucheon;
2Department of Preventive Medicine, Soonchunhyang University College of Medicine, Cheonan;
3Department of Obstetrics and Gynecology, Soonchunhyang University College of Medicine, Bucheon;
4Department of Biostatistics, Clinical Trial Center, Soonchunhyang Unversity Bucheon Hospital, Bucheon, Korea
Background: Exposure to heavy metals from environmental and industrial sources re- mains a concern of serious public health risk. This study was conducted to analysis the relationship between heavy metal concentrations and bone density. Methods: This study used data from a nation-based sample of Koreans (n=2,429) from 2008 to 2011 Korea National Health and Nutrition Examination Survey. We were obtained heavy metals (lead, mercury and cadmium), socioeconomic and demographic factors and bone mineral density (BMD) measured by T-score. Results: Menopausal women, current smoker or the frequent alcohol drinking, low educational level and low family income were greater in the osteopenia or osteoporosis groups than normal group, and were associated with an increased blood heavy metal concentration levels. The highest quartile group in blood lead had a 1.47 times (95% confidence interval [CI] 1.16-1.87) risk of osteopenia or os- teoporosis. In case of blood cadmium, the risk for osteopenia or osteoporosis increased 2.1 times (95% CI 1.64-2.68). Conclusions: We observed a significant association be- tween blood heavy metals (lead and cadmium) levels and low BMD. Our findings sug- gest that heavy metal exposure may be a risk factor for osteoporosis.
Key Words: Bone density, Cadmium, Lead, Mercury, Osteoporosis
INTRODUCTION
Some metals such as zinc, iron, and copper are closely linked to human health because they are essential for maintaining normal physiological functions.[1] How- ever, there are heavy metals produced as environmental pollutants that have ad- verse health effects. Environmental exposure to heavy metals can alter genes and increase disease susceptibility.[2] Exposure to heavy metals occurs through vari- ous routes, and quantifying absorbed doses is complex because of the levels of absorption and metabolism. In addition, exposure time duration varies widely among individuals. Meanwhile, polluted fresh water, soil, air, smoking, and food are known main routes of exposure.[3-5] The World Health Organization (WHO) has classified some heavy metals such as cadmium, lead, mercury, and arsenic as chemical pollutants that require close monitoring.[6]
Accumulations of harmful heavy metals in the human body alter hormone me- tabolism and cause blood vessels to constrict, which lead to adult diseases such Corresponding author
Tae-Hee Kim
Department of Obstetrics and Gynecology, Soonchunhyang University Bucheon Hospital, 170 Jomaru-ro, Bucheon 14584, Korea Tel: +82-32-621-5380
Fax: +82-2-6008-6874 E-mail: [email protected] Received: October 19, 2016 Revised: November 6, 2016 Accepted: November 6, 2016
No potential conflict of interest relevant to this article was reported.
This work was supported by the Soonchunhyang University Research Fund.
This research was supported by High Value-added Food Technology development program, Ministry of agriculture, Food and Rural Affairs, Republic of Korea (114025-03-1-HD030).
as cancer and fetal growth restriction.[7] Such potential risks to public health pose a concern. Heavy metal concen- trations have also been reported as a risk factor for frac- tures and degenerative diseases such as osteoporosis.[8] In particular, cadmium is the most widely known to have tox- ic effects on bones. Itai-itai disease is regarded as the most well-known musculoskeletal disorder caused by cadmium build up, first found in residents living around a cadmium- polluted river in Japan.[9,10] Lead also commonly exists in the environment, making it easy to be absorbed even with- out direct contact; about 80 mg of lead can accumulate in the body throughout a person’s lifetime, mostly in the bones.
Exposure to mercury, which is closely associated with life- styles such as drinking, smoking, and occupation, affects the nervous system.[11] In Korea, studies have investigat- ed the association between cadmium concentration and the incidence of fractures in an industrial region.[12] How- ever, research on the association between heavy metals and bone health is lack.
Moreover, management of environmental factors for prevention and treatment of osteoporosis is highly impor- tant. Therefore, this study was conducted to identify the relationship between heavy metal concentrations in the body and bone density and various influential factors by using the results of the Korea National Health and Nutri- tion Examination Survey (KNHANES).
METHODS
1. Study subjectThis study was based on the data from the KNHANES be- tween 2008 and 2011. This is a nationwide cross-sectional survey composed of health interview, health examination, and nutrition surveys. Among the 37,753 initial subjects, subjects younger than 18 years (n=13,500), subjects with- out or missing bone density measurements (n=15,216), subjects without or missing heavy metal concentration (n=6,380), and subjects with missing variables (n=228) were excluded. The final analysis used the data from 2,429 subjects who were divided into the following three groups:
normal (n=883), osteopenia (n=1,077), and osteoporosis groups (n=469). The survey was approved by the Institu- tional Review Board of Centers for Disease Control and Pre- vention in Korea (IRB No. 2008-04EXP-01-C, 2009-01CON- 03-2C, 2010-02CON-21-C, 2011-02CON-06-C).
2. Variable measurements
Height and weight were measured to the nearest 0.1 cm and 0.1 kg using a portable stadiometer (SECA 225; Seca GmbH Co. KG., Hamburg, Germany) and a balanced scale (GL-6000-20; CAS, Seoul, Korea), respectively. Body mass index (BMI) was then calculated as weight (kg) divided by the square of height (m2). Blood specimens were collected by venipuncture and analysed by a laboratory certified by the Korea Ministry of Health and Welfare. Blood lead and cadmium were measured by the graphite furnace atomic absorption spectrometry using a analyzer (PerkinElmer AAnalyst 600; PerkinElmer, Turku, Finland) and blood mer- cury was measured by the gold amalgamation method us- ing a analyzer (DMA-80; TRICELL, Milestone, Italy). Self-re- ported questionnaires were applied to determine age, sex, smoking, alcohol drinking, living area, educational level, occupation, and family income.
3. Variable definitions
The study subjects were categorized into three groups according to the minimum level of bone mineral density (BMD) measured by T-score from the total proximal femur, femur neck, or L1-L4: normal (T-score>-1.0), osteopenia (-2.5≤T-score≤-1.0), and osteoporosis (T-score<-2.5).[13]
Cigarette smoking was defined as never, past, or current and alcohol drinking was defined as none, occasional, or frequent. The occasional alcohol drinking included those who drank less than once per week. Residential area was categorized according to the Korean administrative district as a rural or urban area. Educational level was categorized as less than a high school diploma, high school diploma, or college or higher. Occupation was divided into white-color (manager, professional level, office workers, service work- ers, sales), blue-color (agriculture, fishery, technicians, as- semblers, simple labor), or none (students, housewife, un- employed). Family income was calculated by dividing the monthly household income by the square root of the house- hold size and grouped into four quartiles (low, middle-low, middle-high, or high).
4. Statistical analysis
Complex sample analysis was performed to the national survey data using the weights, stratified variables, and clus- ter variables following the guidelines from the KNHANES to achieve results without biases. Weights were recalculat-
ed by combining weights of 4-year survey data. Continu- ous variables were reported as mean±standard deviation (SD), and categorical variables were reported as frequency (percentage). The group comparisons were performed us- ing chi-square test and posthoc comparison using Bonfer- roni’s correction. The linear trend of the smoking amount in current smokers according to the level of BMD measured by T-score was assessed by Jonckheere-Terpstra test. The
level of blood heavy metal concentrations per characteris- tics were summarized as geometric means with 95% confi- dence intervals (CIs) by taking the antilog of the mean of the natural log-transformed values. The log-transformed blood heavy metal concentrations were fitted to the multi- ple linear regression including the all covariates considered.
The proportional change and its 95% CIs were calculated by exponentiation of the coefficients. It means that the
Table 1. Demographic characteristics according to level of bone mineral density Normal
(n=883) Osteopenia
(n=1,077) Osteoporosis
(n=469) P-value
Age (yr), n (%) <40 40-60 ≥60
414 (46.9) 322 (36.5) 147 (16.6)
444 (41.2) 443 (41.1) 190 (17.6)
130 (27.7) 208 (44.3) 131 (27.9)
<0.001b,c)
Sex, n (%) Male
Female in menstruation Female in menopause
470 (53.2) 271 (30.7) 142 (16.1)
512 (47.5) 341 (31.7) 224 (20.8)
247 (52.7) 105 (22.4) 117 (24.9)
<0.001a,b,c)
Body mass index (kg/m2), n (%) <18.5
18.5-22.9 23.0-27.4 ≥27.5
51 (5.8) 354 (40.1) 361 (40.9) 117 (13.3)
54 (5.0) 451 (41.9) 451 (41.9) 121 (11.2)
18 (3.8) 194 (41.4) 208 (44.3) 49 (10.4)
0.408
Smoking, n (%) Never Past Current
455 (51.5) 109 (12.3) 319 (36.1)
586 (54.4) 128 (11.9) 363 (33.7)
230 (49.0) 52 (11.1) 187 (39.9)
0.207
Smoking amount in current smokers (piece/day) 14.3±7.1 14.1±7.6 16.7±8.3 0.019d)
Alcohol drinking, n (%) None
Occasional (≤1/week) Frequent (≥2/week)
176 (19.9) 499 (56.5) 208 (23.6)
253 (23.5) 598 (55.5) 226 (21.0)
111 (23.7) 239 (51.0) 119 (25.4)
0.082
Living area, n (%) Rural
Urban 108 (12.2)
775 (87.8) 206 (19.1)
871 (80.9) 97 (20.7)
372 (79.3)
<0.001a,b)
Educational level, n (%) <High school High school ≥College
217 (24.6) 327 (37.0) 339 (38.4)
291 (27.0) 430 (39.9) 356 (33.1)
194 (41.4) 149 (31.8) 126 (26.9)
<0.001b,c)
Occupation, n (%) White color Blue color None
354 (40.1) 214 (24.2) 315 (35.7)
407 (37.8) 252 (23.4) 418 (38.8)
144 (30.7) 154 (32.8) 171 (36.5)
<0.001b,c)
Family income, n (%) Low
Middle-low Middle-high High
120 (13.6) 223 (25.3) 272 (30.8) 268 (30.4)
138 (12.8) 310 (28.8) 293 (27.2) 336 (31.2)
92 (19.6) 120 (25.6) 130 (27.7) 127 (27.1)
0.006c)
The data is presented as mean±standard deviation for continuous variables and frequency (%) for categorical variables.
P-values were calculated by chi-square test except for smoking amount in current smokers.
Posthoc comparison was conducted using Bonferroni's correction.
a)There exists the significant difference between normal and osteopenia groups. b)There exists the significant difference between normal and osteopo- rosis groups. c)There exists the significant difference between osteopenia and osteoporosis groups. d)P-value was calculated by Jonckheere-Terpstra's trend test.
Table 2. Distribution of blood heavy metal concentrations per characteristics
Blood lead (μg/dL) Blood mercury (μg/L) Blood cadmium (μg/L)
Geometric mean
(95% CI) Proportional
change (95% CI)a) Geometric mean
(95% CI) Proportional
change (95% CI)a) Geometric mean
(95% CI) Proportional change (95% CI)a) Bone mineral density
Normal (>-1) 2.11 (2.05-2.17) 1.00 (Reference) 3.85 (3.7-4.01) 1.00 (Reference) 0.86 (0.83-0.89) 1.00 (Reference) Osteopenia (-1 to -2.5) 2.13 (2.08-2.18) 1.01 (0.98-1.05) 3.77 (3.63-3.92) 1 (0.95-1.05) 0.92 (0.89-0.95) 1.03 (0.99-1.08) Osteoporosis (<-2.5) 2.61 (2.5-2.73) 1.16 (1.11-1.2)d) 4.2 (3.97-4.44) 1.07 (1-1.13)b) 1.23 (1.16-1.31) 1.26 (1.19-1.33)d) Age (yr)
<40 1.87 (1.83-1.92) 1.00 (Reference) 3.53 (3.4-3.66) 1.00 (Reference) 0.72 (0.69-0.74) 1.00 (Reference) 40-60 2.45 (2.39-2.52) 1.21 (1.17-1.25)d) 4.38 (4.22-4.55) 1.21 (1.15-1.28)d) 1.13 (1.09-1.16) 1.4 (1.34-1.47)d) ≥60 2.5 (2.41-2.6) 1.17 (1.11-1.24)d) 3.68 (3.46-3.91) 1.1 (1.02-1.2)b) 1.21 (1.15-1.26) 1.39 (1.29-1.49)d) Sex
Male 2.59 (2.53-2.65) 1.27 (1.22-1.32)d) 4.73 (4.57-4.9) 1.31 (1.23-1.4)d) 0.88 (0.85-0.91) 0.65 (0.62-0.69)d) Female in menstruation 1.67 (1.63-1.72) 1.00 (Reference) 3.05 (2.94-3.17) 1.00 (Reference) 0.86 (0.82-0.9) 1.00 (Reference) Female in menopause 2.21 (2.13-2.29) 1.12 (1.07-1.18)d) 3.33 (3.16-3.51) 1.06 (0.98-1.15) 1.34 (1.29-1.39) 1.13 (1.06-1.21)d) Body mass index (kg/m2)
<18.5 1.84 (1.7-1.99) 0.98 (0.91-1.04) 2.98 (2.73-3.26) 0.92 (0.83-1.02) 0.81 (0.73-0.9) 0.95 (0.87-1.04) 18.5-22.9 2.07 (2.01-2.12) 1.00 (Reference) 3.44 (3.32-3.57) 1.00 (Reference) 0.92 (0.89-0.96) 1.00 (Reference) 23.0-27.4 2.37 (2.31-2.43) 1.03 (1-1.06) 4.36 (4.19-4.53) 1.16 (1.11-1.22)d) 0.98 (0.94-1.01) 0.99 (0.95-1.03) ≥27.5 2.33 (2.22-2.44) 1.03 (0.98-1.07) 4.36 (4.05-4.69) 1.19 (1.11-1.28)d) 1.01 (0.94-1.09) 1.04 (0.97-1.11) Smoking
Never 1.92 (1.88-1.96) 1.00 (Reference) 3.36 (3.26-3.47) 1.00 (Reference) 0.86 (0.83-0.89) 1.00 (Reference) Past 2.35 (2.23-2.46) 1.02 (0.96-1.07) 4.04 (3.74-4.36) 0.91 (0.84-0.99)b) 0.8 (0.76-0.85) 1.19 (1.11-1.27)d) Current 2.65 (2.58-2.72) 1.14 (1.1-1.18)d) 4.72 (4.53-4.91) 1.09 (1.02-1.16)c) 1.15 (1.11-1.19) 1.73 (1.64-1.83)d) Alcohol drinking
None 2.04 (1.97-2.11) 1.00 (Reference) 3.31 (3.15-3.48) 1.00 (Reference) 1.08 (1.03-1.14) 1.00 (Reference) Occasional (≤1/week) 2.07 (2.03-2.12) 1.06 (1.02-1.1)c) 3.67 (3.56-3.79) 1.05 (0.99-1.12) 0.87 (0.84-0.89) 0.96 (0.91-1) Frequent (≥2/week) 2.77 (2.68-2.86) 1.22 (1.16-1.28)d) 5.17 (4.9-5.45) 1.29 (1.2-1.39)d) 1.04 (0.99-1.09) 1.08 (1.01-1.15)b) Living area
Rural 2.33 (2.23-2.43) 1.00 (Reference) 4.2 (3.95-4.47) 1.00 (Reference) 1.07 (1.01-1.13) 1.00 (Reference) Urban 2.18 (2.14-2.22) 1 (0.96-1.04) 3.82 (3.72-3.92) 0.9 (0.85-0.96)c) 0.93 (0.9-0.95) 0.94 (0.9-0.99)b) Educational level
<High school 2.53 (2.45-2.61) 1.00 (Reference) 3.82 (3.64-4.01) 1.00 (Reference) 1.3 (1.26-1.36) 1.00 (Reference) High school 2.17 (2.11-2.23) 0.95 (0.91-0.99)b) 3.64 (3.5-3.78) 0.97 (0.91-1.03) 0.89 (0.86-0.93) 0.89 (0.84-0.94)d) ≥College 2 (1.95-2.06) 0.93 (0.89-0.97)c) 4.21 (4.04-4.39) 1.12 (1.04-1.21)c) 0.77 (0.74-0.8) 0.87 (0.81-0.93)d) Occupation
White color 2.11 (2.06-2.17) 1.01 (0.98-1.05) 4.28 (4.1-4.46) 1.1 (1.04-1.17)c) 0.83 (0.8-0.86) 0.96 (0.92-1.01) Blue color 2.66 (2.58-2.75) 1.08 (1.04-1.13)d) 4.25 (4.06-4.45) 1.04 (0.97-1.11) 1.12 (1.07-1.17) 1.08 (1.02-1.14)c) None 2.02 (1.97-2.08) 1.00 (Reference) 3.3 (3.18-3.43) 1.00 (Reference) 0.97 (0.93-1.01) 1.00 (Reference) Family income
Low 2.45 (2.33-2.56) 1.00 (Reference) 3.49 (3.26-3.74) 1.00 (Reference) 1.12 (1.06-1.19) 1.00 (Reference) Middle-low 2.26 (2.19-2.34) 0.96 (0.92-1.01) 3.64 (3.48-3.81) 1.01 (0.94-1.09) 1 (0.95-1.04) 1.03 (0.96-1.09) Middle-high 2.11 (2.05-2.18) 0.93 (0.89-0.98)c) 3.88 (3.71-4.06) 1.08 (1-1.17) 0.91 (0.87-0.95) 1.04 (0.97-1.11) High 2.13 (2.07-2.2) 0.94 (0.89-0.99)b) 4.31 (4.12-4.51) 1.15 (1.07-1.25)d) 0.87 (0.83-0.91) 1.02 (0.95-1.09)
a)The exponential β-coefficient from multiple log-linear regression including all covariates in the table. b)P<0.05. c)P<0.01. d)P<0.001.
CI, confidence interval.
proportional change in the arithmetic mean associated with each level of the covariates relative to a reference lev- el. Multiple logistic regression analyses were used to mea- sure the association between the quartiles of blood heavy metal concentration and the presence of osteopenia or os-
teoporosis. Statistical analyses were performed using R (ver- sion 3.1.3; The R Foundation for Statistical Computing, Vi- enna, Austria) and a level of P<0.05 was considered as sta- tistically significant.
RESULTS
1. Demographic factors of the participants Our study subjects consisted of 2,429 Korean adults; 1,077 (44.3%) had the T-score ranged from -2.5 to -1 and they were categorized in the osteopenia group, and 469 (19.3%) had the T-score lower than -2.5 and were categorized in the osteoporosis group. Table 1 shows the demographic characteristics of the study subjects in three groups divid- ed by the level of BMD. In the osteopenia or osteoporosis, the proportions of those aged ≥40 or the menopausal women were significantly higher than the normal group (P<0.001 in both). The current smoker or the frequent al- cohol drinking were greater in the osteoporosis groups al- though they were not statistically significant. The smoking amount in the current smokers increased according to the level of BMD measured by T-score (P for trend =0.019). Liv- ing in the urban area or having the white color jobs were more common among subjects with no osteopenia or os- teoporosis. The educational level and family income were more likely to be lower in subjects with osteopenia or os- teoporosis than normal group (Table 1). The similar ten- dency was also shown when the subjects were divided into two groups such as normal vs. osteopenia or osteoporosis (Supplementary Table 1).
2. Distribution of blood heavy metal concentrations
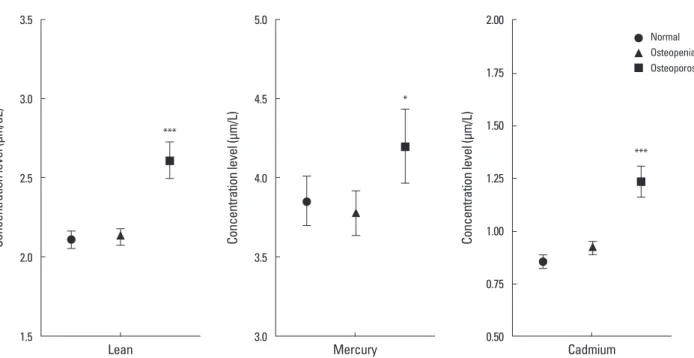
To examine the effects of demographic characteristics on blood heavy metal concentration level, multiple linear regression analyses were conducted for the blood lead, mercury, and cadmium concentration level. Three of blood heavy metal values ranged 0.51 to 24.53 μg/dL for blood lead, 0.37 to 43.10 μg/L for blood mercury, and 0.11 to 8.35 μg/L for blood cadmium, respectively. The geometric mean blood heavy metal concentration varied according to demo- graphic factors, as shown in Table 2 and Figure 1. Blood lead concentrations were highest in frequent alcohol con- sumer (2.77 μg/dL; 95% CI 2.68-2.86), followed by blue color job workers (2.66 μg/dL; 95% CI 2.58-2.75). Blood mercury concentrations were also highest in frequent alco- hol consumer (5.17 μg/L; 95% CI 4.90-5.45), followed by male (4.73 μg/L; 95% CI 4.57-4.90) while blood cadmium concentrations were highest in the menopausal women (1.34 μg/L; 95% CI 1.29-1.39). Thoroughly, menopausal women, current smoking, frequent alcohol drinking, lower educational level and family income were associated with an increased blood heavy metal concentration levels (Ta- ble 2).
Fig. 1. Distribution of the concentration level of the blood heavy metal according to bone mineral density. *P<0.05; **P<0.01; ***P<0.001 there exists the significant difference compared with the normal group.
3.5
3.0
2.5
2.0
1.5
Concentration level (μm/dL)
Lean
***
5.0
4.5
4.0
3.5
3.0
Concentration level (μm/L)
Mercury
*
2.00
1.75
1.50
1.25
1.00
0.75
0.50
Concentration level (μm/L)
Cadmium
***
Normal Osteopenia Osteoporosis
3. Risk of bone health according to the level of blood heavy metal concentration
Logistic regression analyses were designed to figure out the prevalence of osteopenia or osteoporosis according to the quartiles of blood heavy metal concentrations. The risk for osteopenia or osteoporosis increased with an increas- ing blood lead or cadmium level significantly while the risk increased with an increasing blood mercury having no sta- tistical significance. In case of blood lead, subjects in the highest quartile (≥2.933 μg/dL) had a 1.47 times (95% CI 1.16-1.87) risk of osteopenia or osteoporosis, compared with those in the lowest quartile (<1.659 μg/dL) in the crude model. After further multiple adjustment for age, sex, lifestyle behaviors, and sociodemographic factors, the odds ratios (ORs) were remained statistically significant (blood lead quartile 4: OR=1.49, 95% CI 1.12-1.97 com- pared with quartile 1). In case of blood cadmium, the risk for osteopenia or osteoporosis increased 2.1 times (95% CI 1.64-2.68) in subjects with the highest quartile of blood cadmium (≥1.439 μg/L) compared with the lowest quar- tile (<0.660 μg/L). After adjustment for the same factors in modelling blood lean previously, the ORs were attenuated
but remained significant (blood cadmium quartile 4: OR=1.8, 95% CI 1.35-2.4 compared with quartile 1) (Table 3).
DISCUSSION
In this study, we performed an analysis to determine the risk of bone density reduction associated with heavy metal concentrations by investigating demographic characteris- tics, life habits, bone density distribution, and metal con- centration levels. As a result, the variables associated with bone density included age, menopausal woman, educa- tional level, occupation, and household income, all of which are consistent with existing findings in the literature.[14,15]
Smoking amount in current smokers was significantly dif- ferent between healthy and osteoporosis groups. Myong et al.[16] reported that smoking amount in menopausal women is negatively correlated with bone density and add- ed to their analysis that high cotinine concentration in urine indicates heavy smoking and likely reduces bone density at the lumbar spine and femur.
When the mean concentration for each variable was com- pared with the analysis results of risks associated with con- Table 3. Odds ratios (95% confidence interval) for osteopenia or osteoporosis according to the level of blood heavy metal concentration in Korean adults
Variables n Model 1
OR (95% CI) Model 2
OR (95% CI) Model 3
OR (95% CI) Model 4
OR (95% CI) Blood lead (μg/dL)
Quartile 1 (<1.659) 607 1.00 (Reference) 1.00 (Reference) 1.00 (Reference) 1.00 (Reference) Quartile 2 (1.659-2.220) 607 1.06 (0.84-1.33) 1.07 (0.84-1.35) 1.08 (0.85-1.37) 1.08 (0.85-1.37) Quartile 3 (2.220-2.933) 607 1.15 (0.91-1.45) 1.15 (0.9-1.48) 1.17 (0.9-1.51) 1.18 (0.91-1.52) Quartile 4 (≥2.933) 608 1.47 (1.16-1.87)a) 1.5 (1.15-1.96)a) 1.49 (1.13-1.97)a) 1.49 (1.12-1.97)a) Blood mercury (μg/L)
Quartile 1 (<2.549) 607 1.00 (Reference) 1.00 (Reference) 1.00 (Reference) 1.00 (Reference) Quartile 2 (2.549-3.798) 607 1.01 (0.8-1.28) 1.04 (0.82-1.32) 1.03 (0.81-1.31) 1.04 (0.82-1.32) Quartile 3 (3.798-5.710) 608 0.98 (0.78-1.24) 1.01 (0.8-1.29) 1 (0.78-1.27) 1.02 (0.8-1.3)
Quartile 4 (≥5.710) 607 1.07 (0.85-1.36) 1.12 (0.87-1.43) 1.09 (0.85-1.41) 1.13 (0.87-1.46)
Blood cadmium (μg/L)
Quartile 1 (<0.660) 607 1.00 (Reference) 1.00 (Reference) 1.00 (Reference) 1.00 (Reference) Quartile 2 (0.660-0.990) 607 1.03 (0.82-1.3) 0.97 (0.77-1.23) 0.97 (0.76-1.23) 0.99 (0.77-1.26) Quartile 3 (0.990-1.439) 607 1.13 (0.9-1.42) 1.01 (0.79-1.29) 1.01 (0.78-1.3) 1.01 (0.79-1.31) Quartile 4 (≥1.439) 608 2.1 (1.64-2.68)b) 1.81 (1.39-2.36)b) 1.79 (1.35-2.38)b) 1.8 (1.35-2.4)b) Model 1: crude model.
Model 2: adjusted for age and sex.
Model 3: Model 2 plus lifestyle behaviors (smoking status, alcohol drinking, and living region).
Model 4: Model 3 plus sociodemographic factors (educational level, occupation and family income).
a)P<0.01. b)P<0.001.
OR, odds ratio; CI, confidence interval.
centration levels, the concentrations of lead, mercury, and cadmium were within the normal range by the WHO. How- ever, the OR significantly increased in the osteoporosis group, compared with those in the normal group. Lead and cad- mium were similar in that the OR were significantly increased in variables of older age, menopausal woman, smoking, frequent alcohol drinking, low educational level, and blue- color occupation. In the analysis of the risk associated with low bone density based on four concentration levels and adjusted variables, osteoporosis risk was positively corre- lated with concentration levels, increasing ORs to 1.49 and 1.8 times in lead and cadmium, respectively. A Swedish Women's Health in the Lund Area (WHILA) study reported that even low heavy metal concentrations can increase the risk of osteoporosis.[17] A Belgium study[18] also claimed that higher cadmium concentrations lead to lower bone densities. However, the mechanism involving the associa- tion between heavy metals and bone damage cannot be fully explained, although kidney damage was reported to be an important pathway for bone loss and that subsequent calcium malabsorption and iron deficiency in the body in- creases heavy metal absorption, which, if prolonged, causes proteinuria and consequent bone lesions.
This study has several limitations. First, since the data was collected in a cross-sectional design, a causal relation- ship between the level of body heavy metal concentration and the osteoporosis could not be clearly determined. Sec- ond, some factors such as the smoking and alcohol con- sumption were measured by self-reporting, it may result in a biased estimation of the association. Third, genetic char- acteristic and calcium supplement consumptions are im- portant in the measurement of BMD, but they were not collected in the KNHANES. Thus, we could not determine how the associations between the level of blood heavy met- al concentrations and the BMD may be changed by genet- ic factors and calcium supplement consumption. Never- theless, there were several strengths in this study. This was a population-based national representative study that could control for several important confounding and mediating factors, including lifestyle and sociodemographic factors.
This study showed that blood heavy metals (lead and cadmium) associated low BMD. Thus, minimizing heavy metal exposure along with changes in diet, and life habits will help prevent osteoporosis. People who are exposed to heavy metals is also needed so that management has not
decreased BMD. Further studies are needed to set the na- tional permissible limits for exposure to heavy metals and to investigate the association between heavy metals and diseases. Further in-depth analysis is also needed based on the results of the variables found as significant risk factors in this study.
REFERENCES
1. Chowdhury BA, Chandra RK. Biological and health impli- cations of toxic heavy metal and essential trace element interactions. Prog Food Nutr Sci 1987;11:55-113.
2. Maes GE, Raeymaekers JA, Hellemans B, et al. Gene tran- scription reflects poor health status of resident European eel chronically exposed to environmental pollutants. Aquat Toxicol 2013;126:242-55.
3. Chowdhury S, Mazumder MA, Al-Attas O, et al. Heavy met- als in drinking water: Occurrences, implications, and future needs in developing countries. Sci Total Environ 2016;569- 570:476-88.
4. Landsberger S, Wu D. The impact of heavy metals from environmental tobacco smoke on indoor air quality as de- termined by Compton suppression neutron activation anal- ysis. Sci Total Environ 1995;173-174:323-37.
5. Bosch AC, O'Neill B, Sigge GO, et al. Heavy metals in ma- rine fish meat and consumer health: a review. J Sci Food Agric 2016;96:32-48.
6. Rebolledo J, Fierens S, Versporten A, et al. Human biomon- itoring on heavy metals in Ath: methodological aspects.
Arch Public Health 2011;69:10.
7. Cebi A, Kaya Y, Gungor H, et al. Trace elements, heavy met- als and vitamin levels in patients with coronary artery dis- ease. Int J Med Sci 2011;8:456-60.
8. Kido S. Secondary osteoporosis or secondary contributors to bone loss in fracture. Bone metabolism and heavy met- als (cadmium and iron). Clin Calcium 2013;23:1299-306.
9. Chisolm JJ, Jr. Poisoning from heavy metals (mercury, lead, and cadmium). Pediatr Ann 1980;9:458-68.
10. Fukushima M, Ishizaki A, Sakamoto M, et al. On distribu- tion of heavy metals in rice field soil in the "Itai-itai" dis- ease epidemic district. Nihon Eiseigaku Zasshi 1970;24:
526-35.
11. Lucchini RG, Hashim D. Tremor secondary to neurotoxic exposure: mercury, lead, solvents, pesticides. Handb Clin Neurol 2015;131:241-9.
12. Kim YD, Eom SY, Yim DH, et al. Environmental exposure to arsenic, lead, and cadmium in people living near Jang- hang copper smelter in Korea. J Korean Med Sci 2016;31:
489-96.
13. Korean Society for Bone and Mineral Research. Physician’s guide for diagnosis & treatment of osteoporosis. 2015 [cit- ed by 2016 April 8]. Available from: http://www.ksbmr.org/
image/journal/골다공증%20지침서2015_final_1002.pdf 14. Lim HS, Kim SK, Lee HH, et al. Comparison in adherence to
osteoporosis guidelines according to bone health status in Korean adult. J Bone Metab 2016;23:143-8.
15. Brennan SL, Henry MJ, Wluka AE, et al. BMD in population- based adult women is associated with socioeconomic sta-
tus. J Bone Miner Res 2009;24:809-15.
16. Myong JP, Kim HR, Choi SE, et al. Dose-related effect of urinary cotinine levels on bone mineral density among Korean females. Osteoporos Int 2013;24:1339-46.
17. Akesson A, Bjellerup P, Lundh T, et al. Cadmium-induced effects on bone in a population-based study of women.
Environ Health Perspect 2006;114:830-4.
18. Staessen JA, Roels HA, Emelianov D, et al. Environmental exposure to cadmium, forearm bone density, and risk of fractures: prospective population study. Public Health and Environmental Exposure to Cadmium (PheeCad) Study Group. Lancet 1999;353:1140-4.