Introduction
Microglia, or resident brain macrophage, is the major inflam- matory cell type in the central nervous system (CNS) which has essential functions that help protect the CNS from invasion and remove debris.
1Although they are similar to peripheral tissue macrophages and monocytes in their function, very little is kn- own about their role in various brain pathologies including st- roke. Upon microglial activation, they release pro-inflammatory cytokines, oxygen free radicals, and nitric oxide and can stimu- late astrocytes.
2The release of cytokines from activated microg- lia may further exacerbate neuronal injury. Recently, a variety of mechanisms in the neuroprotective role of resident microglia cells have been suggested. Whereas microglia is capable of secret- ing neurotoxic substances, it is also capable of providing the gr- owth factors, cytokines, neurotrophins, glutamate uptake, and generating factors involved in repair.
2-6Besides, abnormality or loss of microglial cells is involved in the onset of neurodegener-
ation rather than activation of microglia cells.
7Accordingly, an understanding of the resident microglial function in the patho- logical CNS is important when aiming at a therapeutic target for stroke and neurodegenerative diseases.
It is generally accepted that metallothioneins (MTs), a family of low molecular-weight (=6,000-7,000), cysteine-rich intracellular proteins, play an important role in the homeostasis of essential metals and in the detoxification of heavy metals.
8However, MT is now thought to also play a significant role in cellular defense mechanisms.
9MT-I and MT-II can significantly reduce the in- flammatory responses, oxidative stress, and apoptotic cell death progressing to neural damage in the CNS, and they are upreg- ulated in several human neurogenerative disorders such as Alz- heimer’s disease
10-12and ischemia.
13,14In animal models, overex- pression of MT-I protects against mild focal cerebral ischemia and reperfusion,
14and MT-I&II null mice show an impaired in- flammatory response, increased oxidative stress and apoptosis, and a delayed wound healing capacity.
15,16MT-I&II expression
Cytokine Mediated Induction of Metallothionein I & II in Oxygen-Glucose Deprived BV2 Cells
Ji Hyun Kim,
1Jong Heon Kim,
1Cheil Moon,
2Hyung Soo Han
11
Department of Physiology, Kyungpook National University School of Medicine, Daegu, Korea
2
Department of Brain Science, Daegu Gyeongbuk Institute of Science and Technology, Daegu, Korea
Received February 15, 2010 Revised
March 20, 2010
Accepted June 15, 2010Correspondence Hyung Soo Han, MD, PhD Department of Physiology, Kyungpook National University School of Medicine,
517 Gukchaebosang-ro, Dongin-dong 2 ga, Jung-gu, Daegu 700-422, Korea
Tel +82-53-420-4814 Fax +82-53-424-3349 E-mail [email protected]Objectiveaa Metallothionein (MT) is a family of metal-binding cysteine-rich proteins with a neuroprotective function after brain injury. The functions of MT include detoxification of heavy metals, neutralization of free radicals, neurite outgrowth, regeneration, anti-apoptosis, and in- flammation in neurological disorders such as the stroke. In this study, we investigated the effects of oxygen glucose deprivation (OGD)+reperfusion (Rep) on the regulation of MT expression in BV2 cells.
Methodsaa BV2 cells were exposed to hypoxia and ribonucleic acid (RNA) samples were extract- ed from the cells. Reverse transcription polymerase chain reaction was performed to observe the gene expression patterns of MT-1 & II, tumor necrosis factor (TNF)-α, interleukin-6 (IL-6), and IL-10. To determine correlation between these cytokines and MT messenger RNA (mRNA) ex- pression, the cells were treated by pentoxifylline in order to inhibit TNF-α and neutralized by an- tibodies against IL-6 and IL-10.
Resultsaa The levels of MT-I&II mRNA as well as pro- and anti-inflammatory cytokines (TNF-α, IL-6, and IL-10) were increased markedly in OGD+Rep conditioned BV2 cells during the acute phase. Inhibition of cytokines down-regulated the MT-I&II expression.
Conclusionsaa The results demonstrated that TNF-α could be an MT-I&II inducer and IL-10 may affect MT-II expression in early inflammation. These provide an insight into the mechanism involved in MT-induced neuroprotection against inflammation-mediated neurodegenerative dis-
eases. Vascular Neurology 2010;2:31-36
Key Wordsaa CNS, Cytokine, Ischemia, Metallothionein, Penotoxifylline.
are inducible for cytokines, such as interleukin-1 (IL-1) and in- terleukin-6 (IL-6), tumor necrosis factor-α (TNF-α) and interfe- ron-gamma (IFN-ν), and inflammation-related compounds, such as glucocorticoids and lipopolysaccharide (LPS) in vitro and in vivo,
17-20but the underlying mechanisms are still unknown.
In this study, we investigated the cytotoxicity and microglial activation in murine microglial BV2 cells by reverse transcrip- tion polymerase chain reaction (RT-PCR) after oxygen glucose deprivation (OGD)+reperfusion (Rep). Next, we examined whe- ther the cytokine released from microglia activated by OGD+
Rep, such as TNF-α, IL-6, and IL-10, can modulate the MT-I&II expression. The results suggest that MT-I&II were upregulated in BV2 cells underlying OGD+Rep and inhibition of cytokines down-regulated the MT-I&II expression in acute OGD+Rep.
We found that activated cytokines are an MT-I&II inducer in early inflammation.
Materials and Methods
Cell culture and treatment
BV2 cells, mouse microglial cell line, were propagated in Dul- becco’s modified Eagle’s medium (DMEM) containing 5% fetal bovine serum (FBS) (HyClone, USA) at 37°C in a humidified 5% CO
2incubator.
Oxygen-glucose deprivation and reperfusion Cultures were transferred to an anaerobic chamber (Forma, Japan) with an atmosphere of 5% CO
2, 5% H
2and 90% N
2. The culture medium was replaced three times with deoxygenated, glucose-free balanced salt solution (BSS0), pH 7.4, containing Phenol Red (10 mg/L) and the following (in mM): NaCl 104.7, CaCl
21.8, MgSO
40.8, KCl 5.4, NaH
2PO
41, NaHCO
326, 4-(2-hy- droxyethyl)-1-piperazineethanesulfonic acid 10. BSS5.5 con- tains 5.5 mM glucose in BSS0. Cultures were placed in a humid- ified 37°C incubator within the anaerobic chamber for 30 min.
Oxygen tension was monitored with an oxygen electrode me- ter and was kept under 0.02%. OGD was ended by adding 5.5 mM glucose to the culture medium and returning the cultures to the incubator (reperfusion). The cultured cells and media were harvested 1 or 4 hr after reperfusion initiation.
Cytokines inhibition
To inhibit the effect of TNF-α, the cells were subjected to 1 mM pentoxifylline (PTF, Sigma) during OGD+R. Anti-IL-6 (MAB 406) and -10 (MAB417) monoclonal antibodies were obtained from Research & Diagnostics Systems, Inc. (R&D Systems, USA) and used to inhibit IL-6 or -10 as a defined concentration (0.5 μg/mL). These antibodies were produced from a hybridoma resulting from the fusion of a mouse myeloma with B cells ob- tained from a rat immunized with purified, E. coli-derived, re- combinant mouse interleukin 6 and 10 (rmIL-6; Accession # P08505 and rmIL-10; Accession # P18893) respectively.
Measurement of LDH release
Lactate dehydrogenase (LDH) was measured in cell culture supernatants using the CytoTox96 non-radioactive cytotoxicity assay (Promega, USA). Optical density was measured at 492 nm with an enzyme-linked immunosorbent assay reader.
Reverse transcription-polymerase chain reaction The cells were seeded at 1×10
6cells in 6-well culture dish with DMEM containing 5% FBS and TRIzol (GIBCO, USA) reagent was added to the cells and harvested. Total ribonucleic acid (RNA)(2 μg) was reverse transcribed by an oligo (dT) primer and moloney murine leukemia virus reverse transcriptase (Pro- mega, USA) according to the manufacture’s protocol for 90 min at 4°C. The resulting complemetary deoxyribonucleic acid frag- ments were amplified by PCR. The reactions for MT-I, MT-II, GAPDH, and β-actin were performed in 25 cycles (denaturation at 95°C for 1 min, annealing at 57°C for 1 min, polymerization at 72°C for 1 min). The reaction for TNF-α, IL-1β, IL-6, IL-10 and metal-responsive transcription factor-1 (MTF-1) was per- formed in 30 cycles (denaturation at 95°C for 1 min, annealing at 54°C for 1 min, polymerization at 72°C for 1 min). The mes- senger ribonucleic acid (mRNA) expression of β-actin was used as internal control for RNA equal loading.
The reactions for b-actin were performed in 30 cycles (dena- turation at 94°C for 30 sec, annealing at 55°C for 30 sec, polym- erization at 72°C, 1 min). The primers for TNF-α, IL-1β, IL-6, IL- 10, MT-I, II, GAPDH and β-actin were used as TNF-α: 5’- CA TCTTCTCAAAATTCGAGTGACAA-3’ (sense), 5’-ACTTG GGCAGATTGACCTCAG-3’ (antisense); IL-1β: 5’-GCAACT- GTTCCTGAACTC-3’ (sense), 5’-CTCGGAGCCTGTAGTG- CA-3’ (antisense); IL-6: 5’-GATGCAACCAAACTGGATATA- ATC-3’ (sense), 5’-GGTCCTTAGCCACTCCTTCTCTG-3’
(antisense); IL-10: 5’-AAGGCCATGAATGAATTTGA-3’
(sense), 5’-TTCGGAGAGAGGTACAAACG-3’ (antisense);
MT-I: 5’-ACCTCCTGCAAGAAGAGCTG-3’ (sense), 5’-GCT- GGGTTGGTCCGATACTA-3’ (antisense); MT-II: 5’-CCGAT CTCTCGTCGATCTTC-3’ (sense), 5’- ACTTGTCGGAAG CCTCTTTG-3’ (antisense); GAPDH: 5’-AACAGCAACTCC CACTCTTC-3’ (sense), 5’-CCTCTCTTGCTCAGTGTCCT-3’
(antisense) and β-actin: 5’-ATCCTGAAAGACCTCTATGC-3’
(sense), 5’-AACGCAGCTCAGTAACAGTC-3’ (antisense) re- spectively. For quantification, the PCR products were subjected to electrophoresis in a 1.5 % agarose gel with ethidium bromide and detected under ultraviolet light.
Statistical analysis
All experiments were repeated at least three times to ensure reproducibility. Comparisons between two means were per- formed by Student’s t-test.
In all statistical comparisons, p<0.05 was used as the criteri- on for statistical significance. All data are represented as mean±
standard deviation (SD).
Results
Effects of OGD+R on the MTs and cytokines induction in BV2 cells
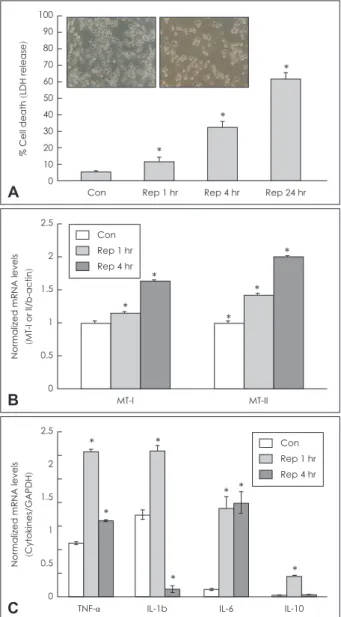
OGD+R caused cell death in BV2 cells over 24 hr in a time- dependant manner (Fig. 1A). Quantification of the cell death of BV2 cells in the OGD+R conditions were measured by the amount of LDH released from dead cells in each treatment con- dition. After exposure to 30 min of OGD following 1, 4, and 24 hr of reperfusion, the number of dead cells in BV2 cells (1 hr:
12%; 4 hr: 32%; 24 hr: 61% respectively) was significantly (p<
0.05) increased compared with the control (5.34%).
In order to confirm whether MT expression can be regulated by OGD+R in microglia, mRNA expression of MT I&II was an- alyzed by RT-PCR after 30 min OGD+R 1 and 4 hr. MT-I and MT- II mRNA levels were markedly increased to 1.2 and 1.5 folds at reperfusion 1 hr and to 1.7 and 2.0 folds at reperfusion 4 hr by OGD+R in BV2 cells compared with the control (Fig. 1B).
To examine microglial activation in BV2 cells by OGD+R conditions, the mRNA expression of the main cytokines was measured by RT-PCR. OGD+R induced the TNF-α, IL-Iβ, IL- 10, and IL-6 expression levels to 2.4, 1.7, 12, and 12 folds at reper- fusion 1 hr and the mRNA levels of TNF-α and IL-6 were sus- tained to 0.64 and 0.79 folds at reperfusion 4 hr compared with the control (Fig. 1C).
MT-I&II mRNA expression were mediated by cytokines during OGD+R induced early damage in BV2 cells
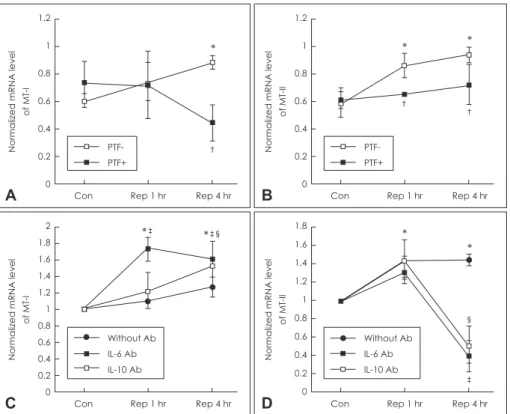
Next, we examined whether up-regulated cytokines can regu- late the MT-I&II expression in BV2 cells. The cells were subject- ed to PTF, cytokine inhibitor especially to TNF-α, during OGD+
R. The mRNA level of MT-I was significantly decreased to 0.887±0.069 vs. 0.449±0.197 (SD) at reperfusion 4hr (p<0.05) (Fig. 2A), while MT-II was decreased to 0.869±0.133 vs. 0.656
±0.019, 0.946±0.086 vs. 0.726±0.215 (SD) at 1 and 4 hr respec- tively (p<0.05)(Fig. 2B). Moreover, to examine whether MT in- ducible cytokine, IL-6 or IL-10, can affect a MT induction, we neu- tralized the cytokines using anti-mouse IL-6 or IL-10 monoclonal antibodies (0.5 μg/mL). As results shown in Fig. 2C and D, the MT-II mRNA level was significantly decreased by the addition of IL-6 (to 0.394±0.17) or IL-10 (0.519±0.25) antibodies at reper- fusion 4 hr as compared with the control (1.447±0.061), but the MT-I was not. This result suggested that TNF-α is correlated with MT-I expression and MT-II is more susceptible to other cyto- kines. To further investigate the correlation between cytokine and MT expression, we investigated the effect of PTF on the mRNA expression of metal-responsive transcription factor-1 (MTF-1) which is a MT transcription factor. A significant decline in the MTF-1 mRNA level by PTF was observed (Fig. 3A). IL-10 neutralization significantly decreased the MTF-1 mRNA level at reperfusion 4hr (approximately 1.3 folds, p<0.05)(Fig. 3B).
Discussion
The upstream of sequence encoding MT mRNA associates with several cis-acting elements. In basal transcription, the pro-
Figure 1. Cytotoxicity and MT expression by OGD-Rep in BV2 cells.
A: Light microscope panels and quantification of cell death. The mu- rine BV2 cells were exposed to 30 min of OGD and Rep 1, 4, and 24 hr respectively. Cell death was measured by the released of cellular lactate dehydrogenase. LDH was measured in cell culture super- natants using the CytoTox96 non-radioactivity cytotoxicity assay.
The absorbance was realized at a wave-length of 490 nm with ELI- SA Reader. B: Expression of MT-I&II mRNA in BV2 cell after OGD (30 min)+Rep (1 and 4 hr). Semi-quantitative RT-PCR was used for analyzing mRNA levels. C: Expression of representative cytokines mRNA by OGD+Rep. The housekeeping gene, GAPDH or β-actin, was used as an internal control. Quantitative levels of expression were calculated from band density. *Statistical significance (p<0.05) versus control. LDH: lactate dehydrogenase, mRNA: messenger ri- bonucleic acid, MT: metallothionein, TNF: tumor necrosis factor, IL-1:
interleukin-1, OGD: oxygen glucose deprivation, Rep: reperfusion, RT- PCR: reverse transcription polymerase chain reaction, GAPDH:
glyceraldehyde 3-phosphate dehydrogenase, ELISA: enzyme-linked immunosorbent assay.
100 90 80 70 60 50 40 30 20 10 0
Con Rep 1 hr Rep 4 hr Rep 24 hr
% Cell death (LDH release)
*
*
*
A
2.5 2 1.5 1 0.5
0
MT-I
*
*
*
*
*
MT-II Normalized mRNA levels (MT-I or II/b-actin)
B
Con Rep 1 hr Rep 4 hr
2.5 2 1.5 1 0.5
0 TNF-α
*
*
*
*
* *
*
IL-1b IL-6 IL-10
Normalized mRNA levels (Cytokines/GAPDH)
C
Con Rep 1 hr Rep 4 hr
moter of MT-I&II containing TATA boxes and initiator regions responds to transcription factor IID and metal response ele- ment (MRE) associating with MTF-1 and essential zinc but with a distinct sequence.
21In the present MT inductive environment or stimulation, MT-I&II are highly inducible by heavy metals
after the activation of MRE and the antioxidant response element (ARE) is responsible for free radicals and induces a MT-I mRNA expression.
22Additionally, a glucocorticoid response element is activated by steroid hormones, such as a glucocorticoid released by IL-6 and TNF-α via stimulating the pituitary/adrenal axis.
231.2 1 0.8 0.6 0.4 0.2 0
Con
*
Rep 1 hr Rep 4 hr Normalized mRNA level of MT-I
A
PTF- †
PTF+
1.2 1 0.8 0.6 0.4 0.2 0
Con
* *
Rep 1 hr Rep 4 hr Normalized mRNA level of MT-II
B
†
†
PTF- PTF+
2 1.8 1.6 1.4 1.2 1 0.8 0.6 0.4 0.2 0
Con Rep 1 hr Rep 4 hr
Normalized mRNA level of MT-I
C
Without Ab IL-6 Ab IL-10 Ab
*
‡ §*
‡Without Ab IL-6 Ab IL-10 Ab 1.8
1.6 1.4 1.2 1 0.8 0.6 0.4 0.2 0
Con
* *
Rep 1 hr Rep 4 hr Normalized mRNA level of MT-II
D
§
‡
Figure 2. Effects of pentoxifylline on MT-I&II induction in BV2 cells exposed to OGD+Rep. A: The BV2 cells were incubated with media contain- ing PTF (1 mM) or PBS in OGD (30 min)+Rep (1 and 4 hr). The alternation of MT-I mRNA expression by PTF treatment as compared with vehi- cle control was analyzed by semi-quantitative RT-PCR. B: The alternation of MT-II expression in condition as in (A). C: Effects of anti-mouse IL-6 or IL-10 monoclonal antibodies on MT-I induction in BV2 cells conditioned OGD+Rep. The OGD media treated with the presence or absence of anti-mouse IL-6 or IL-10 (0.5 μg/mL) for up to reperfusion (1 and 4 hr) respectively. D: Effects on MT-II induction in BV2 cells in same condi- tion as in (C). The housekeeping gene, β-actin, was used as an internal control. The values represent as means±SD of duplicate cultures. *vs.
control (p<0.05),
†vs. without PTF treatment (p<0.05),
‡vs. without IL-6 antibody group (p<0.05),
§vs. without IL-10 antibody group (p<0.05).
mRNA: messenger ribonucleic acid, MT: metallothionein, PTF: pentoxifylline , IL: interleukin , OGD: oxygen glucose deprivation, Rep: reperfusion, RT-PCR: reverse transcription polymerase chain reaction, PBS: phosphate buffered saline.
1.2 1 0.8 0.6 0.4 0.2 0
Con
*
*
*
Rep 1 hr Rep 4 hr Normalized mRNA level of MTF-I
A
†
†
PTF- PTF+
Without Ab IL-6 Ab IL-10 Ab 1.8
1.6 1.4 1.2 1 0.8 0.6 0.4 0.2 0
Con
*
Rep 1 hr Rep 4 hr Normalized mRNA level of MTF-I
B
§