• 검색 결과가 없습니다.

A Transthoracic Echocardiographic Follow-Up Study After Catheter Ablation of Atrial Fibrillation: Can We Detect Pulmonary Vein Stenosis by Transthoracic Echocardiography?

N/A
N/A
Protected

Academic year: 2022

Share "A Transthoracic Echocardiographic Follow-Up Study After Catheter Ablation of Atrial Fibrillation: Can We Detect Pulmonary Vein Stenosis by Transthoracic Echocardiography?"

Copied!
6
0
0

로드 중.... (전체 텍스트 보기)

전체 글

(1)

442

Open Access

A Transthoracic Echocardiographic Follow-Up Study

After Catheter Ablation of Atrial Fibrillation: Can We Detect Pulmonary Vein Stenosis by Transthoracic Echocardiography?

Dong-Hyeon Lee, MD, Yong-Seog Oh, MD, Woo-Seung Shin, MD, Ji-Hoon Kim, MD, Yun-Seok Choi, MD, Sung-Won Jang, MD, Chul-Soo Park, MD, Ho-Joong Youn, MD, Man-Young Lee, MD, Wook-Sung Chung, MD, Ki-Bae Seung, MD, Tai-Ho Rho, MD, Jae-Hyung Kim, MD and Kyu-Bo Choi, MD

Division of Cardiology, Department of Internal Medicine, College of Medicine, The Catholic University of Korea, Seoul, Korea ABSTRACT

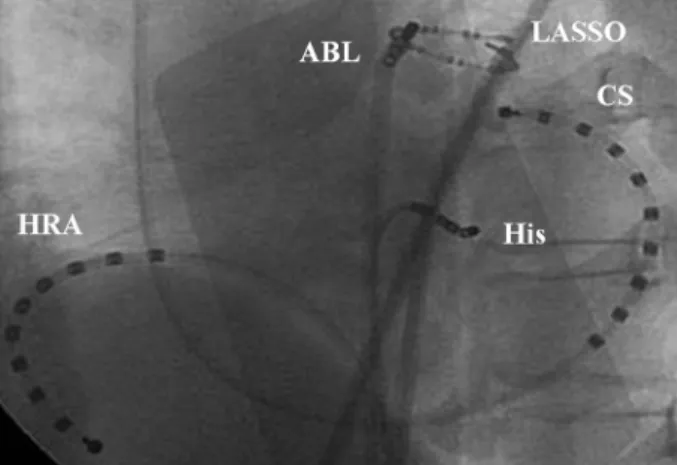
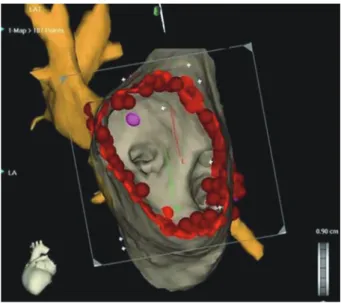
Background and Objectives: While pulmonary vein isolation (PVI) is an effective curative procedure for patients with atrial fibrillation (AF), pulmonary vein (PV) stenosis is a potential complication which may lead to symptoms that are often unrecognized. The aim of this study was to compare differences between ablation sites in pulmonary venous flow (PVF) measured by transthoracic Doppler echocardiography (TTE) before and after PVI. Subjects and Methods: One hundred five patients (M : F=64 : 41; mean age 56±10 years) with paroxysmal AF (n=78) or chronic, persistent AF (n=27) were en- rolled. PVI strategies consisted of ostial ablation (n=75; OA group) and antral ablation using an electroanatomic mapping system (n=30; AA group). The ostial diameter was estimated by magnetic resonance imaging (MRI) in patients with PVF

≥110 cm/sec by TTE after PVI. Results: No patient complained of PV stenosis-related symptoms. Changes in mean peak right PV systolic (-6.7±28.1 vs. 10.9±25.9 cm/sec, p=0.038) and diastolic (-4.1±17.0 vs. 9.9±25.9 cm/sec, p=0.021) flow ve- locities were lower in the AA group than in the OA group. Although the change in mean peak systolic flow velocity of the left PV before and after PVI in the AA group was significantly lower than the change in the OA group (-13.4±25.1 vs. 9.2±22.3 cm/

sec, p=0.016), there was no difference in peak diastolic flow velocity. Two patients in the OA group had high PVF velocities (118 cm/sec and 133 cm/sec) on TTE, and their maximum PV stenoses measured by MRI were 62.5% and 50.0%, respective- ly. Conclusion: PV stenosis after PVI could be detected by TTE, and PVI by antral ablation using an electroanatomic map- ping system might be safer and more useful for the prevention of PV stenosis. (Korean Circ J 2010;40:442-447)

KEY WORDS: Atrial fibrillation; Catheter ablation; Pulmonary veins; Echocardiography.

Received: November 24, 2009 Revision Received: March 15, 2010 Accepted: March 30, 2010

Correspondence: Yong-Seog Oh, MD, Division of Cardiology, Depart- ment of Internal Medicine, College of Medicine, The Catholic University of Korea, 505 Banpo-dong, Seocho-gu, Seoul 137-701, Korea Tel: 82-2-2258-6029, Fax: 82-2-591-1506

E-mail: [email protected]

cc

This is an Open Access article distributed under the terms of the Cre- ative Commons Attribution Non-Commercial License (http://creativecom- mons.org/licenses/by-nc/3.0) which permits unrestricted non-commer- cial use, distribution, and reproduction in any medium, provided the origi- nal work is properly cited.

Introduction

Because the pulmonary vein (PV) plays an important role in atrial fibrillation (AF), pulmonary vein isolation (PVI) us- ing high frequency energy is definitely an effective curative

procedure for patients with AF.

1-5)

PV stenosis is a rare but critical complication associated with this procedure, and re- lated symptoms can vary.

6-9)

The incidence of significant PV stenosis or total PV obstruction is 1 to 10% during a period of 1.3 to 15 months after PVI.

10-12)

Pappone et al.

13-15)

has re- ported that antral ablation is associated with high success and low complication rates, especially in paroxysmal AF, although it is only partly successful in chronic, persistent AF. Although computed tomography (CT) or magnetic resonance imaging (MRI) are currently the standard methods for predicting PV stenosis after PVI, radiation exposure and their costs remain drawbacks.

The aim of this study was to predict PV stenosis after PVI,

and compare efficacy results and pulmonary venous flows

(PVFs) using classical transthoracic Doppler echocardiogra-

phy (TTE) in patients undergoing antral ablation (AA group)

(2)

guided by an electroanatomic mapping system and patients undergoing ostial ablation (OA group).

Subjects and Methods

Subjects

The study population consisted of 105 individuals {M : F=64 : 41 (61% : 39%), mean age: 56±10 years} who underwent high- frequency catheter ablation for AF at St. Mary’s Hospital, The Catholic University of Korea, between June 2005 and June 2006.

All subjects complained of chest discomfort, and their AF had been refractory to medical treatment.

A total of 78 (74%) out of 105 enrolled patients had parox- ysmal AF; whereas 27 (26%) had chronic, persistent AF. Out of 105 individuals, 30 (29%) underwent antral ablation assist- ed by an electroanatomic mapping system, while the remain- ing 75 (71%) patients underwent ostial ablation. The mean symptomatic period was 11±7 years, and the mean period of resistance to antiarrythmic agents, including (Category I or III, such as flecainide, propafenone, amiodarone), β-blockers, calcium channel blockers, or digoxin, was 2.8±4 years.

This study was approved by our Institutional Review Com- mittee. The participants were informed of the investigative na- ture of the study, and written informed consent was obtained before enrollment.

Mapping and catheter ablation

Medical history before the procedure, physical examina- tion, electrocardiography, and TTE, including PVF velocity were obtained for all patients. PV anatomy was assessed by integrating multidetector computed tomography (MDCT) images with an electroanatomic mapping system (CARTO;

Biosense Webster Inc., Diamond Bar, CA, USA). Oral antico- agulants such as coumadin were taken 1 month before the pro- cedure and stopped 5 days prior to it. All patients also under- went transesophageal echocardiography (TEE) to rule out left atrial thrombosis. The procedure was performed as follows.

Four catheter insertion sites were obtained through the right jugular vein and bilateral femoral veins. A 10-electrode cath- eter was maneuvered into the coronary sinus through the right jugular vein, after which another 10-electrode catheter and a 6-electrode catheter were placed at the top of the right atrium and the bundle of His, respectively, through the right femo- ral vein. Finally, a pigtail catheter was placed at the right pul- monary artery through the left femoral vein, passing through the inferior vena cava, right atrium, and right ventricle. At this stage in the procedure, the outline of the PV was identified in a few seconds using selective biplane pulmonary angiogra- phy {right anterior oblique (RAO) 45°, left anterior oblique (LAO) 45°} from both the right and left sides. This anatomical image became the basis for the procedure. To isolate the PV through the left atrium, a Brockenbrough needle (Medtronic,

USA) and two 8F SL1 long transseptal sheaths (St. Jude Medi- cal, Daig Division, USA and Multipurpose, Medtronic, USA) were used to make two artificial atrial septal defects, and 5,000 IU of heparin was infused intravenously. The heparin dosage was chosen to maintain an activated clotting time of 300 seconds, measured every hour. The ablation technique for each patient was chosen as follows: ostial ablation using a Las- so catheter was performed in the first 75 patients (OA group) and then the antral ablation using the CARTOMERGE system was performed in the subsequent 30 patients (AA group).

Ostial ablation group (Fig. 1)

A LASSO variable catheter (25 mm) (Biosense-Webster, Inc.) was placed at the ostium of the PV through a long branch of the left femoral vein. Then, under LASSO guidance, an 8 mm- tip ablation catheter (Biosense-Webster, Inc.) was placed 1-2 cm away from the ostium for ablation. In patients with atrial flutter, ablation was performed at the right atrial cavotricus- pid isthmus.

Antral ablation group (Fig. 2)

Mapping catheters (Navistar; Bioscience Webster, Inc., Bel- gium) were placed into each PV and pulled toward the left atrium. Then, the CARTOMERGE system was implemented, using the 3-dimensional real-time nonradioactive electroana- tomic mapping CARTO system to obtain the structures of the left atrium and of the 2 PVs, which were integrated with MRI or CT images obtained before the procedure. When mapping was completed, a 30-mm or 35-mm LASSO catheter was po- sitioned at the antrum of the left atrium, and ablation was completed by an 4 mm-tip ablation catheter (Navistar; Bio- sense-Webster, Inc.) under LASSO and CARTOMERGE guid- ance. Patients with atrial flutter underwent ablation at the cavotricuspid isthmus.

A Stockert 70 RF Generator (500 kHz; Stockert GMBH, Fr- eiburg, Germany) was used to generate high-frequency ener-

Fig. 1. Fluoroscopic image demonstrating segmental ostial abla- tion of PV using Lasso guidance. LAO: left anterior oblique view, PV:

pulmonary vein; HRA: high right atrium, CS: coronary sinus, ABL: ab-

lation catheter.

(3)

gy, and the target temperature was set at 35°C for each move- ment, every 10-20 seconds. The maximum energy was set at 60 W. Patients with AF during the procedure received intra- cardiac cardioversion using 5-10 J.

Echocardiographic indices

All TTE and TEE assessments were carried out using the Philips Sonos 5500 (Philips Healthcare, Andover, MA, USA) and General Electric System FiVe ultrasound imaging systems.

Transesophageal echocardiography

All patients were placed in the lateral supine position under mild sedation using intravenous (IV) midazolam 2-5 mg, and oximeter surveillance. TEE was performed using a multi-

plane transducer the day before PVI. The left atrial append- age was carefully examined for thrombosis, and a blood flow of 0.4 m/sec was considered safe for procedure.

Transthoracic Doppler echocardiography (Fig. 3A) All patients underwent TTE before and after PVI. The PVF velocities of the right and left PVs were calculated by pulse-wave Doppler in the apical 4-chamber view to compare incidence rates of PV stenosis and PVF changes between the AA group and the OA group. PV stenosis was defined as a po- stprocedural maximum PVF >110 cm/sec, corresponding to data published by Yu et al.

16)

After PVI, a decrease in PV diam- eter by ≥50% measured by CT or MRI was considered signifi- cant, and we compared pre- with postprocedure PV diameters (Fig. 3B and C). The rates of ablation success, symptom recur- rence, complications such as pericardial effusion or cardiac tamponade, stroke, esophageal injury, and phrenic nerve inju- ry were also recorded.

Statistical analysis

Statistical analysis was conducted using SAS statistical soft- ware, version 9.1 (SAS Institute, Cary, NC, USA), and the re- sults were expressed as mean±standard deviation. Compari- sons of PVF before and after the two different procedures, namely AA group with CARTOMERGE and the OA group without CARTOMERGE, were done using the paired Wilcox- on signed ranks test and the Mann-Whitney U-test. A p less than 0.05 was considered statistically significant.

Results

Clinical features (Table 1)

No patient complained of PV stenosis-associated symp- Fig. 2. CARTOMERGE images of LA and PV that have registered a

3-D CT image with the GPS-like CARTO system (endoscopic view).

LA: left atrium, PV: pulmonary vein, 3-D CT: 3-dimensional comput- ed tomography, GPS: global positioning system.

Fig. 3. Doppler (A) and MR imaging (B: pre ablation, C: post ablation) of PV in patients with pulmonary vein stenosis that developed after PVI. The white arrow showed significant right superim vein stenosis. MR: magnetic resonance, PV: pulmonary vein, PVI: pulmonary vein isolation.

A B C

(4)

toms. The success rates for the OA group and AA group were both 80.0% (n=60 and n=40, respectively), and the recurrence rates of the OA group and AA group were both 20.0% (n=15 and n=6, respectively). PV stenosis was only observed in the OA group (2.7%, n= 2), and pericardial effusion or cardiac tamponade was observed in 2.7% of patients from the OA group (n=2), and 3.3% from the AA group (n=1).

Echocardiographic results before and after the procedure (Table 1 and 2)

Left ventricular ejection fractions (LVEF, %) of the OA and AA groups were 62±6% and 63±7% (p=0.136), respec- tively, and left atrial appendage (LAA) velocities were 67±21 cm/sec and 59±17 cm/sec, respectively (p=0.936) (Table 1).

Left atrial dimension changes before and after the proce- dure were 42±8 mm and 42±9 mm (p=0.832), respectively.

Left atrial end-diastolic volume (LAEDV) changes were 61

±25 mL and 59±24 mL (p=0.706), respectively; left atrial end-systolic volume (LAESV) changes were 45±21 mL and 44±21 mL (p=0.340), respectively (Table 2).

Right systolic PVF velocity changes before and after the procedure were 57±19 cm/sec and 63±26 cm/sec (p=0.098), respectively, whereas the right diastolic PVF velocity chang- es were 53±17 cm/sec and 59±23 cm/sec (p=0.067), respec- tively. Left systolic PVF velocity changes before and after the procedure were 53±20 cm/sec and 55±22 cm/sec (p=0.440), respectively; left diastolic PV velocity changes were 51±17 cm/sec and 53±19 cm/sec (p=0.370), respectively (Table 2).

Peak systolic flow velocity changes of the right PV were significantly lower in the AA group (-6.7±28.1 cm/sec) using CARTOMERGE, compared to the OA group (10.9±25.9 cm/

sec) without CARTOMERGE (p=0.038) (Fig. 4A). Similarly, peak diastolic flow velocity changes of the right PV were also significantly lower in the AA group (-4.1±17.0 cm/sec) than in the OA group (9.9±25.9 cm/sec) (p=0.021) (Fig. 4B). Peak systolic flow velocity changes of the left PV were -13.4±25.1 cm/sec and 9.2±22.3 cm/sec, for the AA and OA groups, re- spectively. The AA group had significantly lower values com- pared to the OA group (p=0.016) (Fig. 4C). The peak diastol- ic flow velocity changes of the left PV were also lower in the AA group (-4.4±25.2 cm/sec) than in the OA group (5.8±22.4 cm/sec), but the difference did not achieve statistical signifi- cance (p=0.447) (Fig. 4D).

Two patients in the OA group had PVF velocities of 118 cm/

sec and 133 cm/sec detected by TTE. By MRI assessments, the maximum stenosis of their PVs were 62.5% and 50.0%, respectively (Fig. 3B and C).

Discussion

Although high-frequency PVI is an effective procedure for treating patients with AF, complications associated with this procedure include PV stenosis, atrio-esophageal fistula, peri- esophageal vagal nerve damage, postablation atrial tachycar- dia, thromboembolism, air embolism, and cardiac tampon- ade. In our study, there were no cases of atrio-esophageal fis- tula, peri-esophageal vagal nerve damage, postablation atrial Table 1. Clinical characteristics

Variable OA group

(n=75) AA group (n=30) p

Age (years) 56±10 56±10 0.234

Gender, M (%) 14 (18.6) 17 (56.7) 0.021 Hypertension, n (%) 20 (26.7) 09 (30.0) 0.574 Diabetes mellitus, n (%) 09 (12.0) 05 (16.7) 0.446 Paroxysmal, n (%) 59 (78.7) 19 (63.3) 0.146 Systolic blood pressure (mmHg) 125±19 126±15 0.876 Diastolic blood pressure (mmHg) 077±12 079±14 0.573 Total Cholesterol (mg/dL) 186±67 182±55 0.917 Triglyceride (mg/dL) 136±97 132±64 0.902

HDL-C (mg/dL) 48±9 43±9 0.147

LDL-C (mg/dL) 111±52 111±68 0.952

hs-CRP (mg/L) 2.40±0.9 02.22±1.19 0.387

Pro-BNP (pg/mL) 063±26 055±19 0.124

Left ventricle ejection fraction (%) 62±6 63±7 0.136 Left atrium appendage velocity

(cm/sec) 067±21 059±17 0.936

Complications after ablation, n (%)

Pulmonary vein stenosis 2 (2.7) 0 (0.0) 0.396 Pericardial effusion 2 (2.7) 1 (3.3) 0.644

Stroke 0 (0.0) 0 (0.0) NS

Esophageal injury 0 (0.0) 0 (0.0) NS

Phrenic nerve injury 0 (0.0) 0 (0.0) NS Success rate, n (%) 60 (80.0) 24 (80.0) 0.988 OA: osteal ablation, AA: antral ablation, HDL-C: high density lipo- protein-cholesterol, LDL-C: low density lipoprotein-cholesterol, hs- CRP: highly sensitivity C-reactive protein, Pro-BNP: pro-brain na- triuretic peptide

Table 2. Echocardiographic findings

Variable Before

PVI After

PVI p

Left atrium dimension (mm) 42±80 42±90 0.832 Left atrium end-diastolic volume (mL) 61±25 59±24 0.706 Left atrium end-systolic volume (mL) 45±21 44±21 0.340 Right systolic pulmonary vein velocity

(cm/sec) 57±19 63±26 0.098

Right diastolic pulmonary vein velocity

(cm/sec) 53±17 59±23 0.067

Left systolic pulmonary vein velocity

(cm/sec) 53±20 55±22 0.440

Left diastolic pulmonary vein velocity

(cm/sec) 51±17 53±19 0.370

PVI: pulmonary vein isolation

(5)

tachycardia, or thromboembolism; however, there were cases of PV stenosis (n=2, 1.9%) and cardiac tamponade (n=3, 2.7%).

To diagnose these complications, various methods, includ- ing CT, MRI, TEE, lung ventilation perfusion scanning, eso- phagography, and esophageal manometry can be used.

6-9)

Our study, however, documents the effectiveness of TTE in diag- nosing PV stenosis before and after ablation, by comparing TTE measurements with MRI measurements. Recently, Pack- er et al.

17)

reported that intracardiac echocardiography can be useful for assessing endocardiac structures during PVI and preventing PV stenosis after the procedure. Also, Saad et al.

18)

stated that progression of PV stenosis is rare three months af- ter the procedure, and if it occurs, is usually stable or improves gradually. Various approaches using high-frequency catheter ablation, including PVI, PV denervation, elimination of an- chor points, vein of Marshall exclusion, elimination of AF aris- ing from the posterior LA, and reduction of antral volume, have been introduced to treat patients with AF according to its diverse etiology.

19-24)

Left atrial circumferential ablation, also known as “circum- ferential PVI,” was first attempted by Pappone et al.

13)14)

and refers to “figure-of-eight” ablation around the two left and two right PVs. The use of antral ablation to treat AF has been the subject of controversy. Stabile et al.

25)

reported a success rate of only 37% in 51 patients; whereas Oral et al.

26)

reported a high success rate of 88%. However, in our study, the AA group and

the OA group showed equivalent success rates of 80%, and although the difference did not achieve statistical significance, only the OA group developed PV stenosis (n=2, 2%).

There are several possible reasons for the high success, low recurrence, and low complication rates in the AA group of this study. First, center experience should be considered. There are reports that even highly successful centers initially have a low success rate. Second, the type of high-frequency energy source needs to be considered. Although our study used an energy source of 60 W and 55°C, other studies have reported using energy sources of 60-100 W and 50-60°C for similar research.

19)20)

Therefore, the difference in success rates could be a result of using different types of energy sources. Third, subject selection might play a role. In our study, patients with paroxysmal AF and chronic, persistent AF accounted for 74%

(n=78) and 26% (n=27) of the studied population, respec- tively. Different numbers in the types of AF making up the selected patients may explain the differences in success rates.

Finally, the technical aspect may be a factor, as the results can vary depending on the training level of the procedure administrator.

Limitations

The limitations of this study are as follows; first, although PV stenosis can be detected easily by TTE, CT or MRI are the standard methods for predicting PV stenosis after PVI. More- Fig. 4. Changes in peak flow velocity according to ablation sites and use of an electroanatomic (CARTOMERGE) mapping system. This fig- ure shows changes in peak systolic and diastolic flow velocities of RPV (A and B) and LPV (C and D) before and after PVI. RPV: right pulmo- nary vein, LPV: left pulmonary vein, PVI: pulmonary vein isolation, OA: ostial ablation, AA: antral ablation.

90.0 60.0 30.0 0.0 -30.0 -60.0

90.0 60.0 30.0 0.0 -30.0 -60.0

90.0 60.0 30.0 0.0 -30.0 -60.0

90.0 60.0 30.0 0.0 -30.0 -60.0 Ch an ge s o f p ea k sy sto lic fl ow ve lo cit y of R PV b ef or e a nd aft er P V I ( cm /se c) Ch an ge s o f p ea k sy sto lic fl ow ve lo cit y of L PV b ef or e a nd aft er P V I ( cm /se c) Ch an ge s o f p ea k sy sto lic fl ow ve lo cit y of R PV b ef or e a nd aft er P V I ( cm /se c) Ch an ge s o f p ea k sy sto lic fl ow ve lo cit y of L PV b ef or e a nd aft er P V I ( cm /se c)

OA group

OA group

OA group

OA group AA group

AA group

AA group

AA group p=0.038

p=0.016

p=0.021

p=0.447 10.9±25.9

9.2±22.3

9.9±25.9

5.8±22.4 -6.7±28.1

-13.4±25.1

-4.1±17.0

-4.4±25.2

A

C

B

D

(6)

over, we did not perform postprocedure CT or MRI in all patients after PVI; thus we cannot determine the time course of PV stenosis development. Second, the endpoint of the st- udy was unclear. The mean period for follow-up duration was 4.3±9.9 months in our study. A longer prognostic evalu- ation is necessary to prove not only the actual rate of PV ste- nosis, but also the safety and efficacy of antral ablation. Fi- nally, the accuracy of the CARTOMERGE method needs to be considered. CARTOMERGE is a nonradioactive and global positioning system (GPS)-like method, and is superior in that it uses a mapping technology. But as the timing of MD- CT imaging and the actual procedure differ, discrepancies in the length and volume of the left atrium may occur while in- tegrating the images of the CARTO apparatus and MDCT.

Conclusion

Although PVI using high-frequency energy is definitely an effective curative procedure for patients with AF, it is as- sociated with PV stenosis, a critical but rare complication.

Our study indicates that PV stenosis can be detected easily by TTE, and that antral ablation can be safely performed with the electroanatomic CARTOMERGE mapping system to mi- nimize the incidence of this complication. In all patients af- ter PVI, long-term follow-up examination of PV patency by MRI or TTE is necessary.

REFERENCES

1) Jais P, Haissaguerre M, Shah DC, et al. A focal source of atrial fibril- lation treated by discrete radiofrequency ablation. Circulation 1997;

95:572-6.

2) Haissaguerre M, Jais P, Shah DC, et al. Spontaneous initiation of atrial fibrillation by ectopic beats originating in the pulmonary veins.

N Engl J Med 1998;339:659-66.

3) Kim YH. Rhythm control versus rate control of atrial fibrillation: phar- macologic and non-pharmacologic therapy. Korean Circ J 2003;33:

553-8.

4) Hong GR, Shin DG, Park JS, et al. Effects of pulmonary vein isolation using intraoperative radiofrequency catheter ablation for the treat- ment of atrial fibrillation associated with mitral valvular heart diseas- es. Korean Circ J 2002;32:596-603.

5) Rha SW, Kim YH, Park HN, et al. Initiation and maintenance mech- anism of atrial fibrillation assessed by 3-dimensional non-contact mapping system. Korean Circ J 2004;34:195-203.

6) Robbins IM, Colvin EV, Doyle TP, et al. Pulmonary vein stenosis after catheter ablation of atrial fibrillation. Circulation 1998;98:1769-75.

7) Scanavacca MI, Kajita LJ, Vieira M, Sosa EA. Pulmonary vein ste- nosis complicating catheter ablation of focal atrial fibrillation. J Car- diovasc Electrophysiol 2000;11:677-81.

8) Yu WC, Hsu TL, Tai CT, et al. Acquired pulmonary vein stenosis af- ter radiofrequency catheter ablation of paroxysmal atrial fibrillation. J

Cardiovasc Electrophysiol 2001;12:887-92.

9) Ernst S, Ouyang F, Goya M, et al. Total pulmonary vein occlusion as a consequence of catheter ablation for atrial fibrillation mimicking primary lung disease. J Cardiovasc Electrophysiol 2003;14:366-70.

10) Saad EB, Rossillo A, Saad CP, et al. Pulmonary vein stenosis after ra- diofrequency ablation of atrial fibrillation: functional characterization, evolution and influence of the ablation strategy. Circulation 2003;

108:3102-7.

11) Haissaguerre M, Jais P, Shah DC, et al. Electrophysiological end point for catheter ablation of atrial fibrillation initiated from multiple pulmo- nary venous foci. Circulation 2000;101:1409-17.

12) Arentz T, Jander N, von Rosenthal J, et al. Incidence of pulmonary vein stenosis 2 years after radiofrequency catheter ablation of refractory at- rial fibrillation. Eur Heart J 2003;24:963-9.

13) Pappone C, Rosanio S, Oreto G, et al. Circumferential radiofrequency ablation of pulmonary vein ostia: a new anatomic approach for curing atrial fibrillation. Circulation 2000;102:2619-28.

14) Pappone C, Oreto G, Rosanio S, et al. Atrial electroanatomic remodel- ing after circumferential radiofrequency pulmonary vein ablation: ef- ficacy of an anatomic approach in a large cohort of patients with atri- al fibrillation. Circulation 2001;104:2539-44.

15) Pappone C, Rosanio S, Augello G, et al. Mortality, morbidity, and qual- ity of life after circumferential pulmonary vein ablation for atrial fibril- lation: outcomes from a controlled nonrandomized long-term study.

J Am Coll Cardiol 2003;42:185-97.

16) Yu WC, Hsu TL, Tai CT, et al. Acquired pulmonary vein stenosis af- ter radiofrequency catheter ablation of paroxysmal atrial fibrillation.

J Cardiovasc Electrophysiol 2001;12:887-92.

17) Packer DL, Stevens CL, Curley MG, et al. Intracardiac phased-array imaging: methods and initial clinical experience with high resolution, under blood visualization: initial experience with intracardiac phased- array ultrasound. J Am Coll Cardiol 2002;39:509-16.

18) Saad EB, Rossillo A, Saad CP, et al. Pulmonary vein stenosis after radiofrequency ablation of atrial fibrillation: functional characteriza- tion, evolution, and influence of the ablation strategy. Circulation 2003;

108:3102-7.

19) Jalife J, Berenfeld O, Mansour M. Mother rotors and fibrillatory con- duction: a mechanism of atrial fibrillation. Cardiovasc Res 2002;54:

204-16.

20) Jalife J. Rotors and spiral waves in atrial fibrillation. J Cardiovasc El- ectrophysiol 2003;14:776-80.

21) Hwang C, Wu TJ, Doshi RN, Peter CT, Chen PS. Vein of marshall can- nulation for the analysis of electric activity in patients with focal atri- al fibrillation. Circulation 2000;101:1503-5.

22) Haissaguerre M, Jais P, Shah DC, et al. Electrophysiological end point for catheter ablation of atrial fibrillation initiated from multiple pulmonary venous foci. Circulation 2000;101:1409-17.

23) Lin WS, Tai CT, Hsieh MH, et al. Catheter ablation of paroxysmal atrial fibrillation initiated by non-pulmonary vein ectopy. Circulation 2003;107:3176-83.

24) Moe GK. A conceptual model of atrial fibrillation. J Electrocardiol 1968;1:145-6.

25) Stabile G, Turco P, La Rocca V, Nocerino P, Stabile E, De Simone A.

Is pulmonary vein isolation necessary for curing atrial fibrillation? Cir- culation 2003;108:657-60.

26) Oral H, Scharf C, Chugh A, et al. Catheter ablation for paroxysmal

atrial fibrillation: segmental pulmonary vein ostial ablation versus

left atrial ablation. Circulation 2003;108:2355-60.

수치

Fig. 1. Fluoroscopic image demonstrating segmental ostial abla- abla-tion of PV using Lasso guidance
Fig. 3. Doppler (A) and MR imaging (B: pre ablation, C: post ablation) of PV in patients with pulmonary vein stenosis that developed after PVI
Table 2. Echocardiographic findings

참조

관련 문서

It is difficult to foresee any end to the necessity for this task in the immediate future, but then one never can tell, After the procedure is completed

3) ACC/AHA/ESC 2006 Guidelines for the Management of Patients with Atrial Fibrillation: a report of the American College of Cardiology/American Heart

Endoscopic spine surgery has become a practical, minimally invasive technique for decompression in patients with spinal disc herniation or stenosis.. However,

If the desired part of the molding material can be heated to a desired degree by using the high frequency induction heating device, it will contribute

1) It could be lengthened defected columella without additional surgical procedure. 2) It could be avoided a complication as like meganostril and delaying

Therefore, as a recovery method during exercise, it is more effective for recovery of exercise fatigue and prevention of body acidification due to high

A positive-feedback loop is formed by an amplifier and a frequency-selective network Figure 13.1 The basic structure of a sinusoidal oscillator.. A positive feedback loop is

2 0 50 , max.. 1) 1) When the section modulus is calculated, standard breadth depending on a is used for effective breadth for simplicity. But effective breadth in accordance