서론
참고구간(reference interval)은 참고 표본군의 관측값이나 모집단에서의 예측치의 간격으로 하한 참고치와 상한 참고치 값 간의 간격으로 정의되어 있다[1]. 혈액검사를 통해 얻은 측 정결과는 환자의 진단 및 치료결정을 위해 참고구간과의 비교 과정을 거친다. 이와 같이 혈액검사결과의 해석은 비교를 통한 의사결정과정이므로 모든 검사항목에 대하여 기준이 되는 참 고구간이 필요하다. 만약 적합하지 않은 참고구간을 임상결과 의 해석에 적용할 경우 잘못된 진단 및 치료결정의 위험이 있 다. 따라서 신뢰성 있는 참고구간을 확립하는 것은 임상검사실 의 중요한 업무이다.
현대사회는 급속한 인구의 고령화가 진행되고 있으며 평 균 수명의 연장과 의학이 발달함에 따라 의료기관을 방문하 는 노인 인구의 비율이 지속적으로 상승하는 추세이다[2]. 하 지만 현재 임상검사실에서 사용하고 있는 참고구간은 대부분 2050세의 건강한 성인을 대상으로 정립한 경우가 많다[3,4].
Alkaline phosphatase 등 많은 혈액검사항목에서 연령에 따 른 정상 참고구간이 달라진다는 연구결과가 보고되어 있으며 [5], 이에 따라 유・소아의 경우 성별, 연령별로 국제적 참고 구간 및 한국인의 참고구간이 거의 모든 혈액검사항목에서 정 립되어 있다[69]. 반면에 60세 이상 노인 인구를 대상으로 한 혈액검사 참고구간에 관한 연구는 국내・외적으로 거의 이루 어져 있지 않은 실정이다.
Establishing Reference Intervals for Complete Blood Cell Count in Healthy Korean Elderly Individuals
Eun Jin Lee, Miyoung Kim, Eunyup Lee, Kibum Jeon, Jiwon Lee, Han-Sung Kim, Hee Jung Kang, and Young Kyung Lee
Department of Laboratory Medicine, Hallym
University Sacred Heart Hospital, Anyang, Korea
Background: Different age groups may have different reference intervals. However, the currently used reference interval for complete blood count (CBC) in clinical laboratories is based on results from healthy adults between 20 and 50 years of age. In this study, we aimed to establish reference intervals for 16 CBC parameters in Korean healthy elderly individuals.
Methods: A total of 3,359 healthy adults were selected from 4,253 adults (aged ≥20 years) who underwent regular health check-ups, based on a medical examination by interview. The reference intervals for CBC in two groups (aged <60 and ≥60 years), and the partitioning of reference intervals between the two age groups were established.
Results: Most CBC parameters showed no significant differences in reference intervals between the two age groups. Among the men, platelet distribution width (PDW) was the only parameter that required a separate reference interval between the two age groups.
Among the women, mean corpuscular volume (MCV), mean corpuscular hemoglobin concentration (MCHC), red cell distribution width (RDW), and eosinophil % required separate reference intervals between the two age groups.
Conclusions: The reference intervals for most CBC parameters were not significantly different between the two age groups. Except for PDW in men and MCV, MCHC, RDW, and eosinophil % in women, reference intervals for CBC parameters in individuals younger than 60 years of age could also be applied to those that are 60 years of age or older.
(J Lab Med Qual Assur 2018;40:27-37)
Key Words: Complete blood cell count, Elderlies, Reference interval
Corresponding author:
Miyoung Kim
Department of Laboratory Medicine, Hallym University Sacred Heart Hospital, 22 Gwanpyeong-ro 170beon-gil, Dongan-gu, Anyang 14068, Korea
Tel: +82-31-380-1795 Fax: +82-31-380-1798
E-mail: [email protected] pISSN: 2384-2458
eISSN: 2288-7261 Received November 30, 2017, Revision received January 15, 2018, Accepted February 1, 2018
이에 본 연구에서는 국내 최초로 건강한 한국 노인을 대상 으로 하여 가장 기본이 되는 16가지 일반혈액검사항목에 대 한 참고치를 Clinical and Laboratory Standards Institute (CLSI) EP28A3에서 제시하는 비모수방법(nonparametric method)에 따라 정립하고자 하였다.
재료 및 방법
1. 연구대상
건강증진센터에서 2010년 1월부터 2016년 3월까지 건강검 진을 받은 수진자 중 20세 이상 성인 남녀를 대상으로 하였다.
건강한 대상자를 선별하기 위하여 과거 병력, 복용약물, 검사 소견 등의 기록을 참조하여 제외기준을 다음과 같이 설정하였다.
1) 최근(6개월 이내) 감염질환
(1) 염증반응이 일어날 수 있는 전신질환(폐렴 등)을 진단받 았거나 치료약물을 복용한 경우
(2) 수술력이 있는 경우
2) 간질환
A형간염, 활동성 B형간염, C형간염 및 간암, 알코올성 간질 환, 간경화 등을 진단받았거나 현재 치료 중인 간수치 상승이 있는 경우
3) 만성질환
고혈압, 당뇨, 심장병(협심증, 심근경색, 부정맥), 신증후군 을 진단받았거나 치료 중인 경우
4) 악성종양
혈액종양(백혈병 등), 빈혈, 말라리아 진단을 받은 경우
5) 약물복용
피부과 질환, 정신과 질환, 알코올중독, 갑상선질환, 류마티 스질환, 만성폐쇄성폐질환 등의 치료약물을 복용 중이거나 면 역억제제, 한약 등을 복용하는 경우
6) 검사결과 이상소견
(1) 심전도검사: ST 분절의 상승, 심근경색, pacemaker 삽 입, 허혈성 심질환 의심소견을 보인 경우
(2) 흉부방사선: 갑상선, 종격동 종양, 활동성 결핵, 폐렴, 폐암 의심소견을 보인 경우
(3) 복부초음파: 간경화, 만성간염, 췌장염, 알코올성 간질
환 소견을 보인 경우
(4) 내시경검사: 위암, 대장암, 출혈성 위염 소견을 보인 경우 7) 임신 중인 경우
2. 측정방법
진단검사의학과에서 일반혈액검사에 이용하고 있는 자동 화검사기기인 Coulter LH 750 (Beckman Coulter, Brea, CA, USA)으로 측정한 일반혈액검사결과를 이용하였다. 적 혈구(red blood cells), 혈색소(hemoglobin), 헤마토크리트 (hematocrit), 평균 적혈구용적(mean corpuscular volume, MCV), 평균 적혈구혈색소량(mean corpuscular hemoglobin, MCH), 평균 적혈구혈색소농도(mean corpuscular hemo
globin concentration, MCHC), 적혈구 크기분포(red cell distribution width, RDW), 백혈구(white blood cells), 호중구(neutrophil %), 호산구(eosinophil %), 림프구 (lymphocyte %), 호염기구(basophil %), 단구(monocyte
%), 혈소판(platelet), 평균 혈소판용적(mean platelet volume, MPV), 혈소판 크기분포(platelet distribution width, PDW)의 16가지 항목에 대하여 측정하였다.
3. 참고구간의 설정 및 평균 비교
60세 미만과 60세 이상 두 연령군의 성별, 항목별 검사결 과 분포를 살펴보고 연령군과 성별에 따라 항목별 결과에 차 이가 있는지 여부를 Mann–Whitney Utest와 independent samples ttest를 통해 평균 비교하였다. 각 환자군의 평균 비 교 시에는 P<0.05일 때 통계적 의의가 있는 것으로 평가하였 다.
참고구간은 CLSI EP28A3C에서 제시하는 비모수방법에 따라 60세 미만과 60세 이상군으로 나누어 설정하였다[1,10].
비모수방법에서는 하한 참고한계치(r1)를 2.5번째 백분위 수 {r1=0.025*(n+1)}에 해당하는 관측치로 산출하고, 상한 참 고한계치(r2)를 97.5번째 백분위수{r2=0.975*(n+1)}에 해 당하는 관측치로 산출한다. 비모수방법에서 90% 신뢰도를 가 지는 참고치를 설정하기 위한 최소 관측 수를 120명으로 설정 하고 있으므로 성별과 연령에 따라 분류한 각 아군을 120명 이 상으로 구성하였다. 이상치(outlier) 검출에는 Reed 등[11]이 제안한 방법을 사용하였다.
또한 CLSI EP28A3C에서 제시하는 참고치 분할방법인
Harris와 Boyd 방법에 따라 두 연령군의 참고치 분할에 통계
적 유의성이 있는지 평가하였다[12]. 이 방법에서는 다음의 세
가지로 아군의 참고치 분할을 권장하고 있다.
1) Standard normal deviation (z) 값이 유의치(z*=3 (n
average/120)
1/2)를 넘어서는 경우
n
average=각각의 집단의 수(n1과 n2)의 평균
2) 큰 표준편차(s
2)가 작은 표준편차(s
1)의 1.5배보다 크거나 같은 경우
3) s
2/(s
2-s
1)이 3보다 작은 경우
사용된 통계프로그램은 MedCalc ver. 17.9.7 (MedCalc Software, Ostend, Belgium), Excel 2016 (Microsoft, Redmond, WA, USA), 및 PASW SPSS ver. 18.0 (SPSS Inc., Chicago, IL, USA)였다.
Age (yr)
A
WBC(x10/L)9
2.5 12.5
10.0 7.5
5.0
85 80 75 70 65 60
Age (yr)
C
Hemoglobin(g/dL)
10 18
16
14
12
85 Age (yr)
80 75 70 65 60
D
Hematocrit(%)
30 55 50 45 40 35
85 Age (yr)
80 75 70 65 60
B
RBC(x10/L)9
3.5 6.0 5.5 5.0 4.5 4.0
85 80 75 70 65 60
E
RDW(%)
10 20 18 16 14 12
85 Age (yr)
80 75 70 65 60
F
Platelet(x10/L)9
100 400
300
200
85 Age (yr)
80 75 70 65 60
G
MCV(fL)
70 120 110
100 90 80
85 Age (yr)
80 75 70 65 60
H
MCH(pg)
25 37 35 33 31 29 27
85 Age (yr)
80 75 70 65 60
I
MCHC(g/dL)
30 36 35 34 33 32 31
85 Age (yr)
80 75 70 65 60
J
PDW(fL)
10 20 18 16 14 12
85 Age (yr)
80 75 70 65 60
K
MPV(fL)
6 12 11 10 9 8 7
85 Age (yr)
80 75 70 65 60
L
Neutrophil(%)
30 90 80 70 60 50 40
85 Age (yr)
80 75 70 65 60
P
Monocyte(%)
2.5 12.5
10.0
7.5
5.0
85 Age (yr)
80 75 70 65 60
M
Eosinophil(%)
0 20
15
10
5
85 Age (yr)
80 75 70 65 60
O
Lymphocyte(%)
0 60 50 40 30 20 10
85 Age (yr)
80 75 70 65 60
N
Basophil(%)
0 2.0
1.5
1.0
0.5
85 Age (yr)
80 75 70 65 60
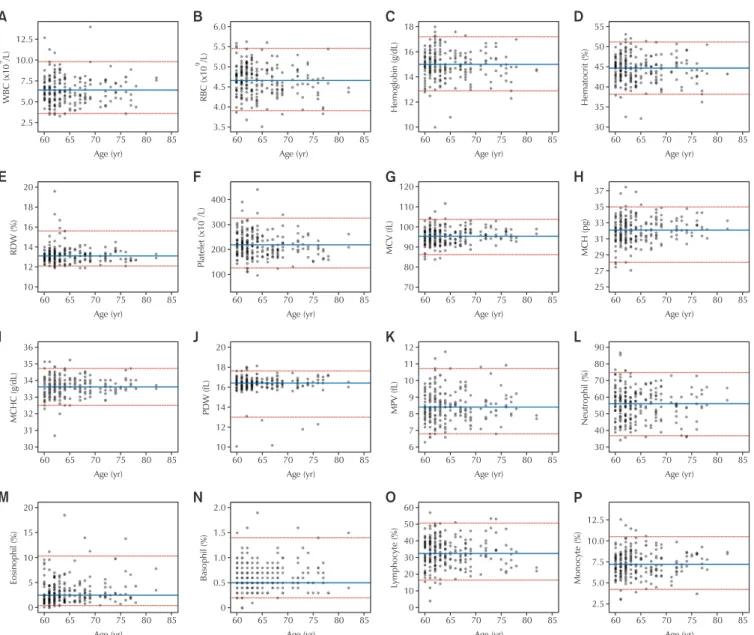
Fig. 1. Distributions for complete blood cell count in male healthy geriatric population (≥60 years old). The solid lines represent
the median values, and the dotted lines denote lower and upper reference limit, respectively. (A) WBC, (B) RBC, (C) hemoglobin,
(D) hematocrit, (E) RDW, (F) platelet, (G) MCV, (H) MCH, (I) MCHC, (J) PDW, (K) MPV, (L) neutrophil, (M) eosinophil (N)
basophil, (O) lymphocyte, and (P) monocyte. Abbreviations: WBC, white blood cells; RBC, red blood cells; RDW, red cell distri-
bution width; MCV, mean corpuscular volume; MCH, mean corpuscular hemoglobin; MCHC, mean corpuscular hemoglobin
concentration; PDW, platelet distribution width; MPV, mean platelet volume.
결과
1. 연구대상군의 선정
건강증진센터에서 2010년 1월부터 2016년 3월까지 건강검 진을 받은 20세 이상 수진자 중 Coulter LH 750으로 측정한 일반혈액검사결과가 있는 수진자는 총 4,253명이었다. 이 중 에서 제외기준에 의해 894명이 제외되었으며 총 3,359명의 수
진자가 건강한 대상자에 포함되었다. 이 중 60세 이상은 374 명이었으며 평균 연령은 65.9±5.88세였다. 남성의 경우 226 명으로 평균 연령은 65.0±5.31세였으며, 여성은 148명으로 평균 연령은 67.2±6.42였다. 60세 미만 대상자는 2,985명이 었으며 평균 연령은 46.4±7.11세였다. 남성은 1,861명이었으 며 평균 연령은 47.3±6.77세였고, 여성은 1,124명으로 평균 연령은 45.1±7.32세였다.
A B C D
E F G H
I
Age (yr)
J K L
P
M N O
Age (yr)
RBC(x10/L)9
3.0 5.5 5.0 4.5 4.0 3.5
90 80 75 70 65
60 85
Hemoglobin(g/dL)
11 16 15 14 13 12
Age (yr)
60 65 70 75 80 85 90
Hematocrit(%)
35 50
45
40
Age (yr)
90 80 75 70 65
60 85
RDW(%)
11 15
14
13
12
Age (yr)
90 80 75 70 65
60 85
Platelet(x10/L)9
100 400 350 300 250 200 150
Age (yr)
90 80 75 70 65
60 85
MCV(fL)
85 105
100
95
90
Age (yr)
90 80 75 70 65
60 85
MCH(pg)
28 34
32
30
Age (yr)
90 80 75 70 65
60 85
MCHC(g/dL)
32 35
34
33
90 80 75 70 65
60 85
PDW(fL)
10 18
16
14
12
Age (yr)
90 80 75 70 65
60 85
MPV(fL)
6 12 11 10 9 8 7
Age (yr)
60 65 70 75 80 85 90
Neutrophil(%)
20 80 70 60 50 40 30
Age (yr)
90 80 75 70 65
60 85
Eosinophil(%)
0 8
6
4
2
Age (yr)
90 80 75 70 65
60 85
Basophil(%)
0 3.0 2.5 2.0 1.5 1.0 0.5
Age (yr)
90 80 75 70 65
60 85
Lymphocyte(%)
0 60 50 40 30 20 10
Age (yr)
60 65 70 75 80 85 90
Monocyte(%)
4 14
12 10 8 6
Age (yr)
90 80 75 70 65
60 85
Age (yr)
WBC(x10/L)9
2.0 12.0 10.0 8.0 6.0 4.0
90 80 75 70 65
60 85
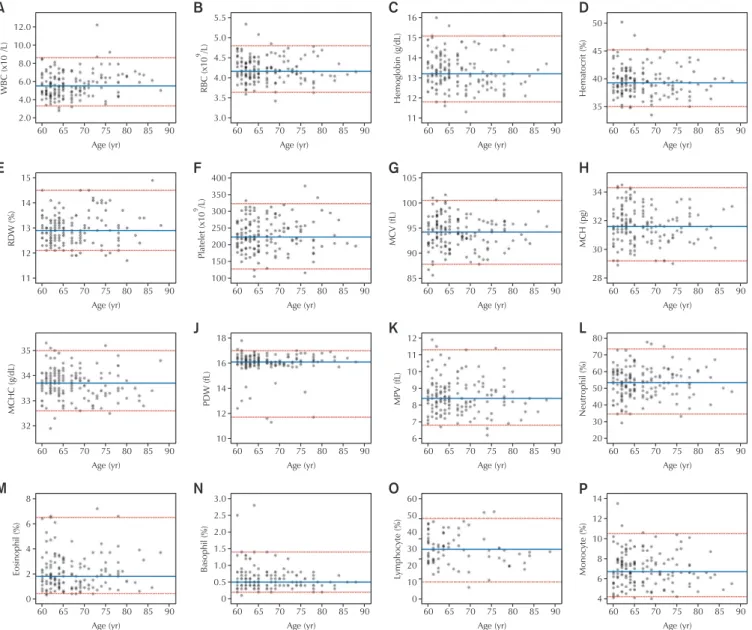
Fig. 2. Distributions for complete blood cell count in female healthy geriatric population (≥60 years old). The solid lines represent
the median values, and the dotted lines denote lower and upper reference limit, respectively. (A) WBC, (B) RBC, (C) hemoglobin,
(D) hematocrit, (E) RDW, (F) platelet, (G) MCV, (H) MCH, (I) MCHC, (J) PDW, (K) MPV, (L) neutrophil, (M) eosinophil (N)
basophil, (O) lymphocyte, and (P) monocyte. Abbreviations: WBC, white blood cells; RBC, red blood cells; RDW, red cell distri-
bution width; MCV, mean corpuscular volume; MCH, mean corpuscular hemoglobin; MCHC, mean corpuscular hemoglobin
concentration; PDW, platelet distribution width; MPV, mean platelet volume.
2. 항목별 일반혈액검사결과의 분포
60세 이상 연령군의 일반혈액검사항목별 분포는 Figs. 1, 2 와 같았다. 많은 검사항목에서 연령증가에 따른 뚜렷한 방향성 을 관찰할 수는 없었다. 60세 이상 연령군의 평균을 Mann–
Whitney Utest 를 통해 60세 미만군과 비교하였을 때 다수
의 항목에서 연령군별 평균에 유의한 차이를 보였다(Table 1).
유의한 차이를 보이지 않은 항목은 남성의 백혈구, 호산구, 호 염기구, 단구와 여성의 백혈구, 적혈구, PDW, 호염기구, 단구 였다. 60세 이상 연령군에서 남성과 여성의 아군으로 나누어 independent samples ttest로 평균을 비교하였을 때 역시 성
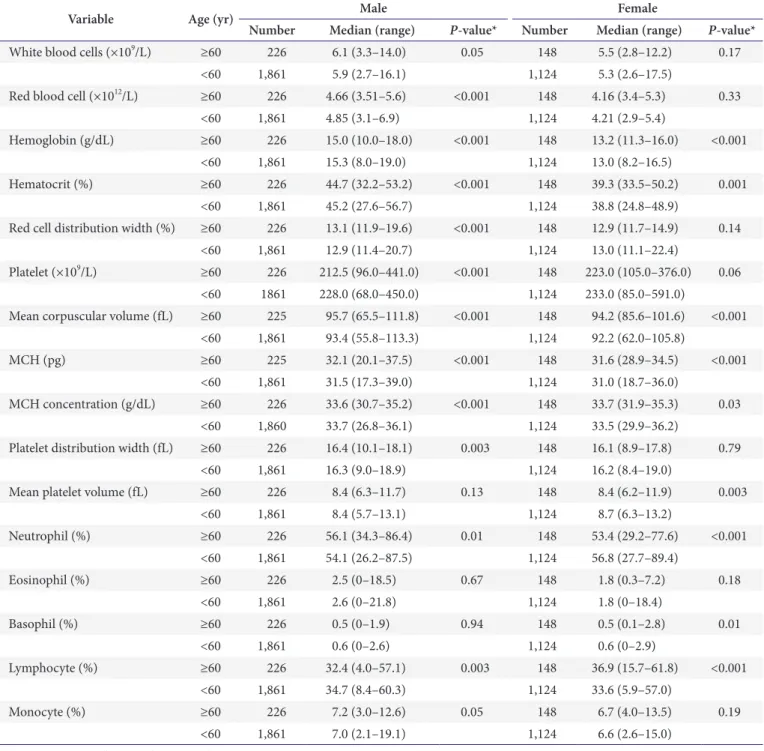
Table 1. The comparison of the median between age groups ≥60 and <60 years using Mann–Whitney U-test
Variable Age (yr) Male Female
Number Median (range) P-value* Number Median (range) P-value*
White blood cells (×109/L) ≥60 226 6.1 (3.3–14.0) 0.05 148 5.5 (2.8–12.2) 0.17
<60 1,861 5.9 (2.7–16.1) 1,124 5.3 (2.6–17.5)
Red blood cell (×1012/L) ≥60 226 4.66 (3.51–5.6) <0.001 148 4.16 (3.4–5.3) 0.33
<60 1,861 4.85 (3.1–6.9) 1,124 4.21 (2.9–5.4)
Hemoglobin (g/dL) ≥60 226 15.0 (10.0–18.0) <0.001 148 13.2 (11.3–16.0) <0.001
<60 1,861 15.3 (8.0–19.0) 1,124 13.0 (8.2–16.5)
Hematocrit (%) ≥60 226 44.7 (32.2–53.2) <0.001 148 39.3 (33.5–50.2) 0.001
<60 1,861 45.2 (27.6–56.7) 1,124 38.8 (24.8–48.9)
Red cell distribution width (%) ≥60 226 13.1 (11.9–19.6) <0.001 148 12.9 (11.7–14.9) 0.14
<60 1,861 12.9 (11.4–20.7) 1,124 13.0 (11.1–22.4)
Platelet (×109/L) ≥60 226 212.5 (96.0–441.0) <0.001 148 223.0 (105.0–376.0) 0.06
<60 1861 228.0 (68.0–450.0) 1,124 233.0 (85.0–591.0)
Mean corpuscular volume (fL) ≥60 225 95.7 (65.5–111.8) <0.001 148 94.2 (85.6–101.6) <0.001
<60 1,861 93.4 (55.8–113.3) 1,124 92.2 (62.0–105.8)
MCH (pg) ≥60 225 32.1 (20.1–37.5) <0.001 148 31.6 (28.9–34.5) <0.001
<60 1,861 31.5 (17.3–39.0) 1,124 31.0 (18.7–36.0)
MCH concentration (g/dL) ≥60 226 33.6 (30.7–35.2) <0.001 148 33.7 (31.9–35.3) 0.03
<60 1,860 33.7 (26.8–36.1) 1,124 33.5 (29.9–36.2)
Platelet distribution width (fL) ≥60 226 16.4 (10.1–18.1) 0.003 148 16.1 (8.9–17.8) 0.79
<60 1,861 16.3 (9.0–18.9) 1,124 16.2 (8.4–19.0)
Mean platelet volume (fL) ≥60 226 8.4 (6.3–11.7) 0.13 148 8.4 (6.2–11.9) 0.003
<60 1,861 8.4 (5.7–13.1) 1,124 8.7 (6.3–13.2)
Neutrophil (%) ≥60 226 56.1 (34.3–86.4) 0.01 148 53.4 (29.2–77.6) <0.001
<60 1,861 54.1 (26.2–87.5) 1,124 56.8 (27.7–89.4)
Eosinophil (%) ≥60 226 2.5 (0–18.5) 0.67 148 1.8 (0.3–7.2) 0.18
<60 1,861 2.6 (0–21.8) 1,124 1.8 (0–18.4)
Basophil (%) ≥60 226 0.5 (0–1.9) 0.94 148 0.5 (0.1–2.8) 0.01
<60 1,861 0.6 (0–2.6) 1,124 0.6 (0–2.9)
Lymphocyte (%) ≥60 226 32.4 (4.0–57.1) 0.003 148 36.9 (15.7–61.8) <0.001
<60 1,861 34.7 (8.4–60.3) 1,124 33.6 (5.9–57.0)
Monocyte (%) ≥60 226 7.2 (3.0–12.6) 0.05 148 6.7 (4.0–13.5) 0.19
<60 1,861 7.0 (2.1–19.1) 1,124 6.6 (2.6–15.0)
Values are presented as number or median (range).
Abbreviation: MCH, mean corpuscular hemoglobin.
*For each variable, two age groups were compared using the Mann–Whitney U-test. P-values ≤0.05 were considered statistically significant.
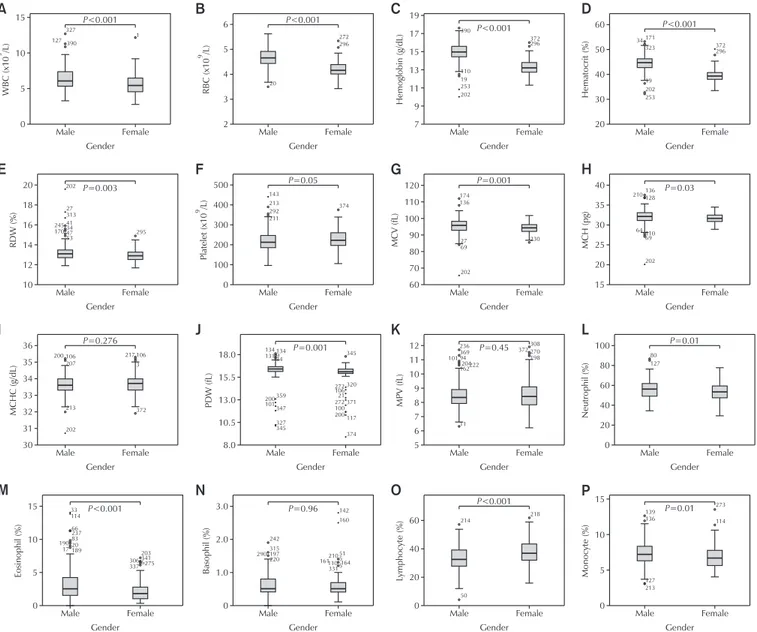
별에 따른 평균에 유의한 차이를 보였다. 유의한 차이를 보이 지 않은 항목은 혈소판, MCHC, MPV, 호염기구였다(Fig. 3).
3. 참고구간의 설정
비모수방법에 따라 성별, 연령별로 설정된 참고구간은 Tables 2, 3에 나타내었다. 남성의 일반혈액검사의 경우 거 의 모든 일반혈액검사항목에서 60세 이상 건강 노인과 60세
미만군과의 참고구간을 분할하는 것은 통계적 의의가 없었다 (Table 4). PDW에서만 큰 표준편차(s
2)가 작은 표준편차(s
1) 의 1.5배보다 커서 참고구간의 통계적 차이를 보였다. 여성에 서 z>z*의 결과를 보였거나, s
2/(s
2-s
1)이 3보다 작은 결과를 보여 참고구간의 통계적 차이가 관찰된 항목은 MCV와 MCH, RDW 및 호산구였다. 이외의 일반혈액검사항목에서 60세 이 상 건강 노인과 60세 미만군과의 참고구간은 통계적 차이가
A B C D
E F G H
I J K L
P
M N O
RBC(x10/L)9
2 6
5
4
3 Hemoglobin(g/dL)
7 19 17 15 13 11 9
Hematocrit(%)
20 60
50
40
30
RDW(%)
10 20 18 16 14
12 9 Platelet(x10/L)
0 500 400 300 200 100
MCV(fL)
60 120 110 100 90 80 70
MCH(pg)
15 40 35 30 25 20
MCHC(g/dL)
30 36 35 34 33 32 31
PDW(fL) MPV(fL)
5 12 11 10 9 8 7 6
Neutrophil(%)
Eosinophil(%) Basophil(%)
0 3.0
2.0
1.0 Lymphocyte(%)
0 60
40
20 Monocyte(%)
0 15
10
5
WBC(x10/L)9
0 15
10
5
Gender Female Male
Gender Female Male
Gender Female Male
Gender Female Male
Gender Female Male
Gender Female Male
Gender Female Male
Gender Female Male
327 127 390
P<0.001
1
20
P<0.001
272 296
390
110 19 253 202
P<0.001
372296 171
323
202 253 34
P<0.001
372 296
202
27 313 4134 4753 245 170
P=0.003
295
143 213 292 211
P 0.05=
374
174 136
27 69
202
P 0.001=
230
136 128
11069
202 210
64
P 0.03=
106 207
213
202 200
P 0.276=
106 3
372
236 36994 101
P 0.45= 308270
198
290 242 315197 220
P 0.96= 142
160 214
50
P<0.001
218 139
136
P 0.01= 273
114
Gender Female Male
Gender Female Male
Gender Female Male
Gender Female Male
Gender Female Male
8.0 18.0
15.5
13.0
10.5
1349 34 134 131
200101
P 0.001= 345
320 371 117 374
Gender Female
Male 0
100 80 60 40 20
80 127
P 0.01=
Gender Female Male
0 15
10
5
33 114
190 17
66237 83 20 189
P<0.001
203341 275
Gender Female Male
19
217
272106 21 272 100 200 359
347 327345
204222 162
11
372
3066 337
51 5164 5 210 110331 161
127 213
Fig. 3. Comparison of complete blood cell count between males and females in healthy geriatric population (≥60 years old). For each variable, the two gender groups were compared using Student t-test. P-values ≤0.05 were considered statistically signifi- cant. (A) WBC, (B) RBC, (C) hemoglobin, (D) hematocrit, (E) RDW, (F) platelet, (G) MCV, (H) MCH, (I) MCHC, (J) PDW, (K) MPV, (L) neutrophil, (M) eosinophil (N) basophil, (O) lymphocyte, and (P) monocyte. Abbreviations: WBC, white blood cells;
RBC, red blood cells; RDW, red cell distribution width; MCV, mean corpuscular volume; MCH, mean corpuscular hemoglobin;
MCHC, mean corpuscular hemoglobin concentration; PDW, platelet distribution width; MPV, mean platelet volume.
Table 2. The RIs in healthy geriatric population (≥60 years old)
Variable Male Female
RI Lower 90% CI Higher 90% CI RI Lower 90% CI Higher 90% CI
White blood cells (×109/L) 3.6–9.8 3.5–4.0 9.3–12.7 3.3–8.6 2.8–3.7 7.9–12.2
Red blood cells (×1012/L) 3.91–5.46 3.68–3.99 5.30–5.61 3.64–4.8 3.42–3.75 4.72–5.34
Hemoglobin (g/dL) 12.9–17.2 10.8–13.1 16.9–17.6 11.8–15.1 11.3–12.1 14.8–16.0
Hematocrit (%) 38.2–51.2 32.6–39.2 50.1–52.2 35–45.2 33.5–35.9 44.1–50.2
Red cell distribution width (%) 12.1–15.6 11.9–12.2 14.5–17.3 11.9–14.5 11.7–12.1 14.1–14.9
Platelet (×109/L) 125.4–325.8 110–151.0 305.0–391.0 127.6–322.6 105–159 310–376
Mean corpuscular volume (fL) 86.2–103.7 83.8–88.8 102.3–107.8 87.8–100.5 85.6–88.7 99–101.6
MCH (pg) 28.1–35 27.1–29.7 34.5–36.9 29.2–34.3 28.9–29.6 33.8–34.5
MCH concentration (g/dL) 32.5–34.7 32–32.8 34.6–35.1 32.6–35 31.9–32.7 34.7–35.3
Platelet distribution width (fL) 13–17.6 10.2–15.7 17.3–18.0 11.7–17 8.9–13.7 16.9–17.8
Mean platelet volume (fL) 6.8–10.7 6.6–7.1 10.2–11.3 6.8–11.3 6.2–7.1 10.6–11.9
Neutrophil (%) 36.9–74.7 35.8–40.3 72.6–85.1 34.6–73.4 29.2–37.8 67.6–77.6
Eosinophil (%) 0.4–10.3 0–0.7 9.0–14.0 0.4–6.5 0.3–0.5 4.9–7.2
Basophil (%) 0.2–1.4 0–0.3 1.1–1.6 0.2–1.4 0.1–0.3 1.3–2.8
Lymphocyte (%) 16.5–50.6 11.9–18.9 47.6–53.5 19.1–53.5 15.7–23.0 50.3–61.8
Monocyte (%) 4.2–10.5 3.1–5.0 9.9–11.9 4.2–10.5 4.0–4.5 9.8–13.5
All RIs were established according to the Clinical and Laboratory Standards Institute guideline EP28-A3c and 2.5th–97.5th percentile. The 90% CI was calculated according to the following formula: mean±1.645×standard deviation÷√number.
Abbreviations: RI, reference interval; CI, confidence interval; MCH, mean corpuscular hemoglobin.
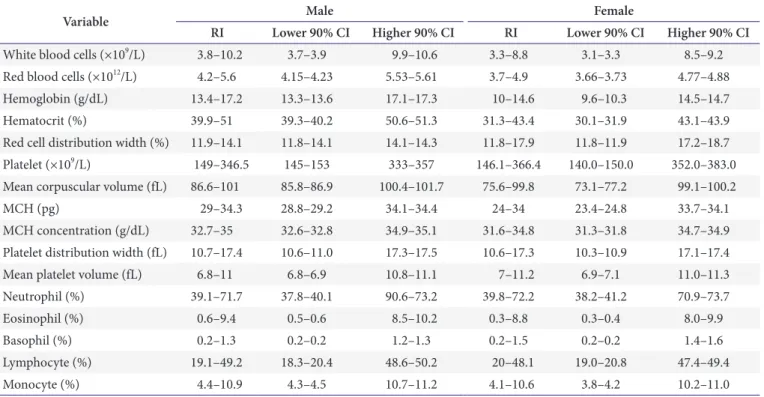
Table 3. The RIs in healthy adult population (≥20 and <60 years old)
Variable Male Female
RI Lower 90% CI Higher 90% CI RI Lower 90% CI Higher 90% CI
White blood cells (×109/L) 3.8–10.2 3.7–3.9 9.9–10.6 3.3–8.8 3.1–3.3 8.5–9.2
Red blood cells (×1012/L) 4.2–5.6 4.15–4.23 5.53–5.61 3.7–4.9 3.66–3.73 4.77–4.88
Hemoglobin (g/dL) 13.4–17.2 13.3–13.6 17.1–17.3 10–14.6 9.6–10.3 14.5–14.7
Hematocrit (%) 39.9–51 39.3–40.2 50.6–51.3 31.3–43.4 30.1–31.9 43.1–43.9
Red cell distribution width (%) 11.9–14.1 11.8–14.1 14.1–14.3 11.8–17.9 11.8–11.9 17.2–18.7
Platelet (×109/L) 149–346.5 145–153 333–357 146.1–366.4 140.0–150.0 352.0–383.0
Mean corpuscular volume (fL) 86.6–101 85.8–86.9 100.4–101.7 75.6–99.8 73.1–77.2 99.1–100.2
MCH (pg) 29–34.3 28.8–29.2 34.1–34.4 24–34 23.4–24.8 33.7–34.1
MCH concentration (g/dL) 32.7–35 32.6–32.8 34.9–35.1 31.6–34.8 31.3–31.8 34.7–34.9
Platelet distribution width (fL) 10.7–17.4 10.6–11.0 17.3–17.5 10.6–17.3 10.3–10.9 17.1–17.4
Mean platelet volume (fL) 6.8–11 6.8–6.9 10.8–11.1 7–11.2 6.9–7.1 11.0–11.3
Neutrophil (%) 39.1–71.7 37.8–40.1 90.6–73.2 39.8–72.2 38.2–41.2 70.9–73.7
Eosinophil (%) 0.6–9.4 0.5–0.6 8.5–10.2 0.3–8.8 0.3–0.4 8.0–9.9
Basophil (%) 0.2–1.3 0.2–0.2 1.2–1.3 0.2–1.5 0.2–0.2 1.4–1.6
Lymphocyte (%) 19.1–49.2 18.3–20.4 48.6–50.2 20–48.1 19.0–20.8 47.4–49.4
Monocyte (%) 4.4–10.9 4.3–4.5 10.7–11.2 4.1–10.6 3.8–4.2 10.2–11.0
All reference ranges were established according to Clinical and Laboratory Standards Institute guideline EP28-A3c and 2.5th–97.5th percentile. The 90% CI was calculated according to the following formula: mean±1.645×standard deviation÷√number.
Abbreviations: RI, reference interval; CI, confidence interval; MCH, mean corpuscular hemoglobin.
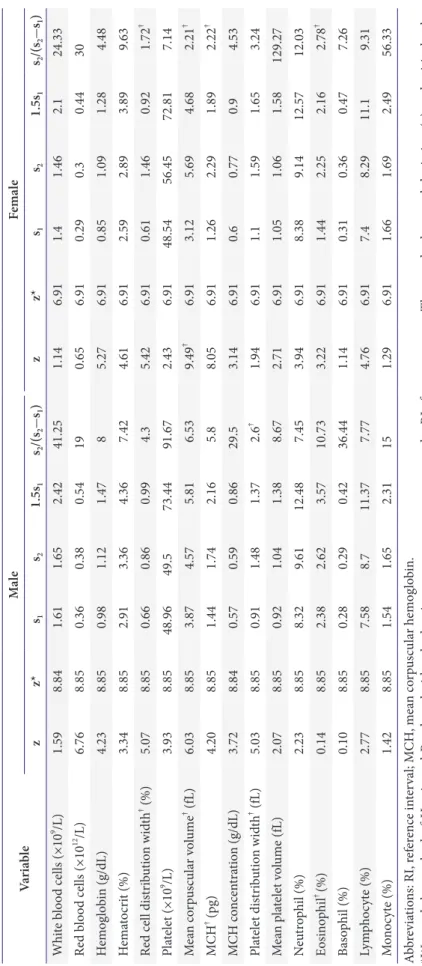
Table 4. Partitioning of RI for age groups (≥60 and <60 years old) according to Harris and Boyd method VariableMaleFemale zz*s1s21.5s1s2/(s2-s1)zz*s1s21.5s1s2/(s2-s1) White blood cells (×109 /L)1.598.841.611.652.4241.251.146.911.41.462.124.33 Red blood cells (×1012 /L)6.768.850.360.380.54190.656.910.290.30.4430 Hemoglobin (g/dL)4.238.850.981.121.4785.276.910.851.091.284.48 Hematocrit (%)3.348.852.913.364.367.424.616.912.592.893.899.63 Red cell distribution width† (%)5.078.850.660.860.994.35.426.910.611.460.921.72† Platelet (×109 /L)3.938.8548.9649.573.4491.672.436.9148.5456.4572.817.14 Mean corpuscular volume† (fL)6.038.853.874.575.816.539.49† 6.913.125.694.682.21† MCH† (pg)4.208.851.441.742.165.88.056.911.262.291.892.22† MCH concentration (g/dL)3.728.840.570.590.8629.53.146.910.60.770.94.53 Platelet distribution width† (fL)5.038.850.911.481.372.6† 1.946.911.11.591.653.24 Mean platelet volume (fL)2.078.850.921.041.388.672.716.911.051.061.58129.27 Neutrophil (%)2.238.858.329.6112.487.453.946.918.389.1412.5712.03 Eosinophil† (%)0.148.852.382.623.5710.733.226.911.442.252.162.78† Basophil (%)0.108.850.280.290.4236.441.146.910.310.360.477.26 Lymphocyte (%)2.778.857.588.711.377.774.766.917.48.2911.19.31 Monocyte (%)1.428.851.541.652.31151.296.911.661.692.4956.33 Abbreviations: RI, reference interval; MCH, mean corpuscular hemoglobin. *We used the method of Harris and Boyd to decide whether it was necessary to separate the RIs for age groups. The standard normal deviation (z) and critical value {z*=3(naverage/120)1/2 } were calculated. † If the calculated z exceeds z*, or the larger standard deviation (s2) exceeds 1.5 smaller standard deviation (s1), or s2/(s2-s1) is less than 3, it is recommended partitioning the RIs for age groups.
없었다.
고찰
평균 수명의 증가에 따른 노인 인구는 계속 증가추세에 있으 며 2016년 통계청의 조사에 따르면 한국의 60세 이상 노인 인 구는 약 1,013만 명으로 전체 인구의 약 20%에 달한다[13].
의료기관을 방문하는 노인의 비중은 인구 구성비율보다 더 높 아서, 건강보험심사평가원의 2016년 조사에 따르면 노인 인구 (65세 이상)의 진료비가 건강보험 전체 진료비의 37.5%를 차 지했다[2]. 이처럼 병원에서 노인의 참고구간에 대한 임상적 필요성은 증가하고 있지만 현재 임상검사실에서 사용하고 있 는 참고구간은 대부분 2050세의 건강한 성인을 대상으로 정 립한 경우가 많다[3,4]. 전 세계적으로도 노인 인구의 참고구 간에 관한 연구는 미미한 상태로, 본 연구에서 정립한 건강한 한국 노인 인구의 일반혈액검사 참고구간은 실제 임상검사실 에서 유용하게 이용될 수 있을 것으로 보인다.
본 연구에서 정립한 한국 노인의 일반혈액검사 참고구간은 대부분의 일반혈액검사항목에서 60세 이상 건강 노인과 60 세 미만군 간에 통계적 차이가 관찰되지 않았다. 남성의 경우 PDW를 제외한 검사항목에서 참고구간의 통계적 차이가 보이 지 않아 기존에 정립된 성인의 혈액검사 참고치를 대부분 그대 로 이용할 수 있을 것으로 생각된다. 여성에서도 많은 검사항 목에서 참고구간이 통계적 차이를 보이지 않아 기존의 정립된 성인의 혈액검사 참고치를 이용할 수 있을 것으로 생각된다.
다만 여성의 경우 60세 미만군에 비해 60세 이상군에서 MCV 와 MCH가 증가하는 경향을 보였다. 또한 RDW의 참고구간 은 좁아지고 호산구는 감소하는 경향을 보였다. 노인 인구에서 MCV 증가의 경우 기존의 문헌에서 보고한 결과들과 일치하 는 결과를 보였으며[14,15], 이는 연령의 증가에 따른 적혈구 의 수명 변화가 원인인 것으로 추측되고 있다[14]. 그 밖에 통 계적 의의가 있는 차이가 관찰된 항목의 경우 현재까지 그 의 의가 연구된 경우는 거의 없으며 노인 인구의 다른 특징적인 요소와의 관련성 및 임상적인 유용성 등의 분석이 추가적으로 필요할 것으로 생각된다.
노인의 일반혈액검사 참고구간에 대해 기존에 보고된 연구 는 미국과 중국 등 몇몇 소수의 국가에서만 존재하였으며[16
18], 이 결과들은 대부분의 항목에서 본 연구에서 정립한 결 과와 큰 차이를 보이지 않았다. 혈색소를 예시로 살펴보면, 본 연구에서는 60세 이상군에서 남성은 12.917.2, 여성은 11.8
15.1의 참고구간을 보였는데, 미국의 65세 이상 인구를 대상 으로 연구한 결과에 의하면 남성의 경우 12.617.4, 여성의 경
우 11.716.1의 참고구간을 보였다[16]. 반면 본 연구결과보 다 다소 낮은 혈색소 참고구간을 보이는 경우도 있었는데, 중 국의 60세 이상 인구를 대상으로 연구한 결과에 의하면 남성 은 12.116.5, 여성은 10.715.0의 참고구간을 보였다[17]. 이 처럼 다른 국가의 구성원 간의 일반혈액검사 참고구간은 인종 이나 경제수준 등에 따라 다를 수 있으므로 한국인을 대상으로 한 노인 인구의 참고구간을 정립하여 이용하는 것이 필요하며, 본 연구결과는 실제 한국인을 대상으로 한 진료에 유용하게 이 용될 수 있을 것으로 보인다.
참고구간의 설정에서 가장 중요한 부분은 건강군의 참고치 를 설정하는 것이다. 건강은 보편적 정의가 없는 상대적인 상 태로, 건강하다는 것을 어떻게 정의하는지가 참고치 설정의 기 본이 된다[1]. 그러나 노인의 경우 젊은 성인에 비해 기저 질 병을 가지고 있는 경우가 많으며, 약물을 복용하고 있는 경우 가 많아 그 필요성에 비해 참고구간 설정에 관한 연구에 어려 움이 있었다. 본 연구에서는 장기간의 건강검진 환자 데이터를 바탕으로 건강검진 시 작성한 문진결과에 따라 제외기준을 설 정하여 참고치 설정에 필요한 비교적 많은 수의 건강 노인의 데이터를 수집할 수 있었다.
요약하면, 본 연구에서 정립한 건강한 한국 노인의 일반혈액 검사 참고구간은 남성의 경우 대부분의 일반혈액검사항목에 서 60세 이상 건강 노인과 미만군 사이에 통계적 차이를 보이 지 않았다. 다만 여성에서는 60세 이상 건강 노인과 미만군 사 이에 통계적 차이를 보이는 구간이 다소 존재하였다. 따라서 임상검사실에서는 특히 여성 노인의 혈액검사 해석 시 기준이 되는 참고치를 검사실의 사정에 맞추어 재설정하는 과정이 필 요할 것으로 생각된다.
감사의 글
이 논문은 대한임상검사정도관리협회 2016년 학술연구비 지원에 의해 이루어졌다(201612).
REFERENCES
1. Clinical and Laboratory Standards Institute. Defining, es- tablishing, and verifying reference intervals in the clinical laboratory: approved guideline: EP28-A3c. 3rd ed. Wayne (PA): Clinical and Laboratory Standards Institute, 2010.
2. National Health Insurance Service, Health Insurance
Review and Assessment Service. 2016 Korea health insur-
ance statistics. http://www.nhis.or.kr/menu/retriveMenu-
Set.xx?menuId=F3323 (Accessed November 18, 2017).
3. Wu X, Zhao M, Pan B, Zhang J, Peng M, Wang L, et al.
Complete blood count reference intervals for healthy Han Chinese adults. PLoS One 2015;10:e0119669.
4. Park SH, Park CJ, Lee BR, Kim MJ, Han MY, Cho YU, et al. Establishment of age- and gender-specific reference ranges for 36 routine and 57 cell population data items in a new automated blood cell analyzer, Sysmex XN-2000.
Ann Lab Med 2016;36:244-9.
5. Turan S, Topcu B, Gokce I, Guran T, Atay Z, Omar A, et al. Serum alkaline phosphatase levels in healthy chil- dren and evaluation of alkaline phosphatase z-scores in different types of rickets. J Clin Res Pediatr Endocrinol 2011;3:7-11.
6. Colantonio DA, Kyriakopoulou L, Chan MK, Daly CH, Brinc D, Venner AA, et al. Closing the gaps in pediatric laboratory reference intervals: a CALIPER database of 40 biochemical markers in a healthy and multiethnic popu- lation of children. Clin Chem 2012;58:854-68.
7. Ridefelt P, Hellberg D, Aldrimer M, Gustafsson J. Esti- mating reliable paediatric reference intervals in clinical chemistry and haematology. Acta Paediatr 2014;103:10-5.
8. Lee HR, Shin S, Yoon JH, Roh EY, Chang JY. Refer- ence intervals of hematology and clinical chemistry analytes for 1-year-old Korean children. Ann Lab Med 2016;36:481-8.
9. Zierk J, Arzideh F, Rechenauer T, Haeckel R, Rascher W, Metzler M, et al. Age- and sex-specific dynamics in 22 hematologic and biochemical analytes from birth to ado- lescence. Clin Chem 2015;61:964-73.
10. Solberg HE. Approved recommendations (1987) on the theory of reference values: part 5. statistical treatment of collected reference values: determination of reference limits. J Clin Chem Clin Biochem 1987;25:645-56.
11. Reed AH, Henry RJ, Mason WB. Influence of statistical method used on the resulting estimate of normal range.
Clin Chem 1971;17:275-84.
12. Harris EK, Boyd JC. On dividing reference data into sub- groups to produce separate reference ranges. Clin Chem 1990;36:265-70.
13. Korean Statistical Information Service. http://kostat.go.kr/
portal/korea/kor_nw/2/1/index.board?bmode=read&
aSeq=362609 (Accessed November 18, 2017).
14. Gamaldo AA, Ferrucci L, Rifkind JM, Zonderman AB.
Age-related changes in mean corpuscular volume in adult whites and African Americans. J Am Geriatr Soc 2011;59:1763-4.
15. Danon D, Bologna NB, Gavendo S. Memory performance of young and old subjects related to their erythrocyte characteristics. Exp Gerontol 1992;27:275-85.
16. Yip R, Johnson C, Dallman PR. Age-related changes in laboratory values used in the diagnosis of anemia and iron deficiency. Am J Clin Nutr 1984;39:427-36.
17. Woo J, Arumanayagam M, Ho SC, Swaminathan R. He- matological indices and the prevalence of anemia in an elderly Chinese population. Pathology 1989;21:31-4.
18. Tsang CW, Lazarus R, Smith W, Mitchell P, Koutts J,
Burnett L. Hematological indices in an older population
sample: derivation of healthy reference values. Clin Chem
1998;44:96-101.
건강 노인에서의 일반혈액검사 참고구간의 설정
이은진 • 김미영 • 이은엽 • 전기범 • 이지원 • 김한성 • 강희정 • 이영경
한림대학교성심병원 진단검사의학과
배경: 많은 혈액검사항목에서 연령에 따른 정상 참고구간이 달라진다는 연구결과가 보고되어 있 다. 그러나 현재 사용하고 있는 참고구간은 대부분 20-50세의 건강한 성인을 대상으로 정립한 경 우가 많다. 이에 본 연구에서는 건강한 한국 노인을 대상으로 하여 16가지 일반혈액검사항목에 대 한 참고치를 정립하고자 하였다.
방법: 건강검진을 받은 20세 이상 수진자 4,253명 중 문진결과를 바탕으로 3,359명의 건강한 성인 을 선정하였다. 일반혈액검사항목별로 Clinical and Laboratory Standards Institute EP28-A3에서 제 시하는 비모수방법에 따라 60세 미만 연령군과 60세 이상 연령군의 참고구간을 설정하였다. 또한 남성과 여성에서 각각 Harris와 Boyd 방법에 따라 두 연령군의 참고치 분할에 통계적 유의성이 있 는지 평가하였다.
결과: 다수의 일반혈액검사항목에서 60세 이상 건강 노인군과 60세 미만 연령군의 참고구간은 통 계적 차이가 없었다. 남성의 경우 platelet distribution width을 제외한 거의 모든 일반혈액검사항목에 서 60세 이상 건강 노인과 60세 미만군과의 참고구간을 분할하는 것은 통계적 의의가 없었다. 여 성의 경우에는 mean corpuscular volume, mean corpuscular hemoglobin, red cell distribution width 및 호산구에서 연령군별 통계적 차이가 관찰되었다.
결론: 건강한 한국 노인의 일반혈액검사 참고구간은 대부분 60세 미만군의 참고구간과 유사하였으 나, 여성에서는 두 연령군의 참고구간에 통계적 차이를 보이는 구간이 존재하였다. 따라서 특히 여 성 노인에서 일반혈액검사 참고구간을 재설정하는 과정이 필요할 것으로 생각된다.
(J Lab Med Qual Assur 2018;40:27-37)
교신저자: 김미영
우)14068 안양시 동안구 관평로170번길 22, 한림대학교성심병원 진단검사의학과 Tel: 031)380-1795, Fax: 031)380-1798, E-mail: [email protected]