INTRODUCTION
In 1988, Reaven introduced the term syndrome X, which consisted a cluster of syndromes including hyperinsulinemia, hypertension, dyslipidemia, hyperglycemia, and resistance to insulin-stimulated glucose uptake (1). He claimed that insulin resistance (IR) plays a central role in the etiology and clinical course of patients with diabetes mellitus, high blood pressure (BP), and coronary heart disease (2). In 1998, the World Health Organization recognized the importance of this clustering and further defined the components of metabolic syndrome (MetS) (3). In 2001, the National Cholesterol Education Program Adult Treatment Panel III (ATP III) provided criteria for this syndrome that are now often used in general practice (4).
The components proposed in the ATP III guidelines include obesity (high waist circumference) (5), high serum triglyceride (TG) level (6), high BP (7), high fasting plasma glucose (FPG) level (8), and low level of high-density lipoprotein cholesterol (HDL-C) (9). All these parameters were associated with IR.
In addition, subjects with MetS are considered to have IR and an increased risk of cardiovascular disease (CVD) (10).
Identifying patients with IR is clinically important because IR
is associated with increased CVD-related mortality and inci- dence of diabetes mellitus (11). However, few data show whether the ATP III criteria are suitable for detecting IR.
Furthermore, the degree of IR varied with different meth- ods of measurement. Therefore, the purpose of this study was to explore the relationship between IR and the ATP III criteria for MetS and to evaluate the ability to detect IR from the method of insulin suppression test (IST) in subjects ful- filling those criteria.
MATERIALS AND METHODS Subjects
We enrolled 511 subjects (218 men and 293 women, aged 20-75 with mean 45.8±2.2 yr) during routine health check- ups at our hospital. Subjects with a history of hypertension or other clinically significant medical or surgical diseases were excluded. Subjects with diabetes were excluded after they un- derwent an oral glucose tolerance test. We excluded the dia- betic subjects because IR is the major patho physiological
465
Chang-Hsun Hsieh, Dee Pei*, Yi-Jen Hung, Shi-Wen Kuo�, Chih-Tseung He, Chien-Hsing Lee, and Chung-Ze Wu�
Department of Internal Medicine, Tri-Service General Hospital, Taipei; Department of Internal Medicine*, Cardinal Tien Hospital, Taipei; Department of Internal Medicine�, Buddhist Tzu Chi General Hospital, Taipei, Taiwan, R.O.C.
Address for correspondence Chang-Hsun Hsieh, M.D.
Division of Endocrinology and Metabolism, Department of Internal Medicine, Tri-Service General Hospital, Taipei, Taiwan, R.O.C
Tel : +011886-2-87927182, Fax : +011886-2-87927183 E-mail : [email protected]
DOI: 10.3346/jkms.2008.23.3.465
Identifying Subjects with Insulin Resistance by Using the Modified Criteria of Metabolic Syndrome
The objectives of this cohort analysis were to explore the relationship between insulin resistance (IR) and the criteria for metabolic syndrome (MetS) and to evaluate the ability to detect IR in subjects fulfilling those criteria. We enrolled 511 healthy sub- jects (218 men and 283 women) and measured their blood pressure (BP), body mass index, high-density lipoprotein cholesterol (HDL-C), triglyceride (TG), and fasting plasma glucose levels. Insulin suppression testing was done to measure insulin sensitivity as the steady-state plasma glucose (SSPG) value. Subjects with an SSPG value within the top 25% were considered to have IR. The commonest abnormality was a low HDL-C level, followed by high BP. The sensitivity to detect IR in subjects with MetS was about 47%, with a positive predictive value of about 64.8%, which has higher in men than in women. In general, the addition of compo- nents to the criteria for MetS increased the predictive value for IR. The most com- mon combination of components in subjects with MetS and IR were obesity, high BP, and low HDL-C levels. All of the components were positive except for HDL-C, which was negatively correlated with SSPG. The correlation was strongest for obesity, followed by high TG values. In subjects with MetS, sensitivity for IR was low. However, body mass index and TG values were associated with IR and may be important markers for IR in subjects with MetS.
Key Words : Insulin Resistance; Metabolic Syndrome; Obesity; Triglycerides
Received : 10 April 2007 Accepted : 1 October 2007
defect of type 2 diabetes and in most of the diabetic patients fulfilling the criteria of MetS. Thus, this might lessen the impact of the results when interpreting the data to explore our major purpose in the present study. Our hospital ethics committee approved the study. The nature, purpose, and potential risks of the study were explained to the patients, and we obtained their written informed consent to partic- ipate in the study.
Laboratory evaluation
All subjects were tested at our clinical research center. Dur- ing enrollment, all patients underwent complete routine physi- cal examination to rule out cardiovascular, respiratory, renal, or endocrine disorders. No patient had received any medica- tion known to affect glucose metabolism for at least 3 weeks before the study. Three days before the study, patients were prescribed a stable diet.
The patients’ ability to process a glucose load was estimat- ed by using the modified IST of Shen and Reaven (12). After an overnight fast, an intravenous catheter was placed in each of the patients’ arms. One arm was used to administer a 180- min infusion of somatostatin at a rate of 250 g/hr, insulin at 25 mU/m2/min, and glucose at 240 mg/m2/min. The other arm was used to collect blood samples. Blood was initially sampled every 30 min and then at 10-min intervals from min- utes 150 to 180 of the infusion. These samples were used to determine the steady-state plasma insulin (SSPI) and steady- state plasma glucose (SSPG) concentrations for each subject.
The SSPI concentrations were comparable in all individuals;
therefore, the SSPG concentrations were used to measure the efficacy of insulin in processing the infused glucose load. Inc- reasing SSPG values indicated increasing IR. Because Reav- en suggested that the top 25% of SSPG values in the gener- al population indicated IR (1), we divided our subjects into four groups by SSPG quartiles. Those with values within the top quartile were considered to have IR.
Subjects were evaluated for MetS by using the ATP III cri- teria. Their height and weight were measured to the nearest 0.5 cm and 0.1 kg, respectively. Body mass index (BMI) was calculated as weight divided by [height]2. Because waist cir- cumstances were not available for all subjects, we substitut- ed a BMI ≥27 kg/m2as an index of obesity; this was the level the Taiwanese Department of Health defined in 2002 as indicating obesity. Other four specific criteria included TG ≥1.7 mM/L, BP ≥130/85 mmHg, FPG concentra- tion ≥6.1 mM/L, and HDL-C ≤1.04 mM/L for men or 1.30 mM/L for women (4). Subjects who fulfilled at least three out of five criteria met the definition of MetS (4). BP was measured according to the criteria of the Seventh Joint National Committee on Prevention, Detection, Evaluation, and Treatment of High Blood Pressure.
Plasma was separated from the blood samples within 1 hr of their collection and stored at -30℃until analyzed. The sam-
ples obtained at -5 and 0 min were analyzed for FPG, fasting plasma insulin, and lipid levels. Plasma glucose values were determined by using a glucose oxidase method and analyzer (YSI 203 glucose analyzer; Scientific Division, Yellow Spring Instrument Company, Inc., Yellow Spring, OH, U.S.A.). In- sulin was measured by a commercial solid phase radioimmu- noassay kit (Coat-A-Count Insulin Kit, Diagnostic Products Corporation, Los Angeles, CA, U.S.A.). Intra- and interassay coefficients of variance for insulin were 3.3 and 2.5%, respec- tively. Serum TG values were measured by using the dry, mul- tilayer analytical slide method (Dri-Chem 3000 analyzer; Fuji Photo Film Corporation, Minato-Ku, Tokyo, Japan). Serum HDL-C concentrations were determined by means of an enzy- matic cholesterol assay after dextran sulfate precipitation.
We also explore the relationship between MetS diagnosed with ATP III criteria and IR. The sensitivity is the proportion of MetS cases of all IR cases in the study population. The specificity is the proportion of cases not fulfilled the MetS criteria of all of the cases without IR in the study popula- tion. Finally, the positive predictive value means the propor- tion of IR case of all MetS cases in the study population.
Statistical analysis
Analysis was performed by using software (SPSS version 10.0 statistical package for Windows; SPSS, Chicago, IL, U.S.A.). Data were tested for normal distribution with the Kolmogorov-Smirnov test and for homogeneity of variances with the Levene test. Continuous variables were expressed as the mean±standard deviation. An independent Student t-test was used to evaluate anthropometric differences between men and women. A 2test was used to test differences in prevalence in categorical variables for both sexes. Associa- tions of SSPG with the criteria for MetS were assessed by using Spearman correlation analysis. All statistical tests were two-sided, and p values<0.05 were considered to indicate a statistical significance.
RESULTS
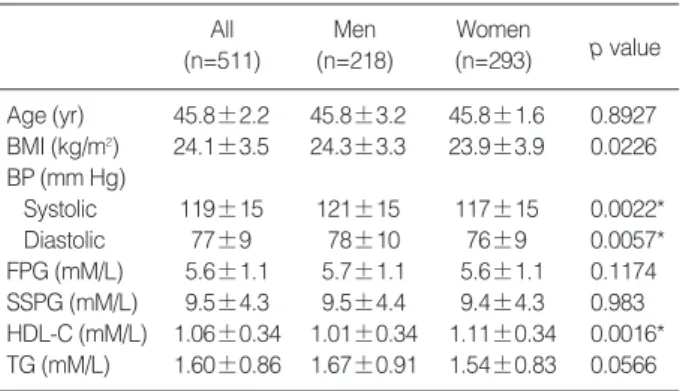
In general, men had higher BPs and BMIs and lower HDL- C levels than the women. Other metabolic characteristics were not significantly different between the sexes (Table 1).
The prevalence of various components of MetS did not dif- fer between the sexes, except that BMI was higher in men than in women. The commonest abnormality related to MetS was a low HDL-C value, followed by high BP, and then the other components (Table 2).
The sensitivity to detect IR by using the criteria for MetS was about 47% overall; the sensitivity was slightly higher in men than in women (53% vs. 41%) (Table 3). However, specificities were similar in men and women (92%). The positive predictive value was higher in men (70%) than in
women (60%), with an overall value of 64.8%.
Table 4 presents the predictive value to detect IR in sub- jects who fulfilled the criteria for MetS. In general, the pre- dictive value for IR increased as increasing numbers of com- ponents of MetS were combined. The most common com- bination in subjects with both MetS and IR were obesity, high
BP, and low HDL-C level. Table 5 shows the association be- tween components of MetS and IR. A positive correlation was seen in each component of MetS with SSPG except for HDL-C values, which had a negative correlation. The strongest factor correlated with SSPG was obesity, followed by a high TG level.
DISCUSSION
Reaven proposed that IR has a central role in MetS, and study data have confirmed that a finding of baseline IR is associated with subsequent CVD (11). The purpose of the ATP III criteria for MetS is to identity individuals at high risk for CVD. The components of MetS criteria are usually
Data are the means±standard error of the mean.
*Statistically significant between genders by Student t-test.
BMI, body mass index; BP, blood pressure; FPG, fasting plasma glucose;
SSPG, steady-state plasma glucose; HDL-C, high-density lipoprotein cholesterol; TG, triglyceride.
All Men Women
p value (n=511) (n=218) (n=293)
Age (yr) 45.8±2.2 45.8±3.2 45.8±1.6 0.8927 BMI (kg/m2) 24.1±3.5 24.3±3.3 23.9±3.9 0.0226 BP (mm Hg)
Systolic 119±15 121±15 117±15 0.0022*
Diastolic 77±9 78±10 76±9 0.0057*
FPG (mM/L) 5.6±1.1 5.7±1.1 5.6±1.1 0.1174 SSPG (mM/L) 9.5±4.3 9.5±4.4 9.4±4.3 0.983 HDL-C (mM/L) 1.06±0.34 1.01±0.34 1.11±0.34 0.0016*
TG (mM/L) 1.60±0.86 1.67±0.91 1.54±0.83 0.0566 Table 1. Baseline characteristics of the study subjects
Data in parentheses are percentages.
�Defined as ≤1.04 mM/L in men and ≤1.30 mM/L in women.
*p<0.05 with statistically significance between genders by 2-test.
BMI, body mass index; BP, blood pressure; FPG, fasting plasma glucose;
HDL-C, high-density lipoprotein cholesterol; TG, triglyceride.
Component Male Female
(n=218) (n=293)
High BMI (≥27 kg/m2)* 49 (22.5) 40 (13.7) High BP (≥130/85 mm Hg) 85 (36.9) 86 (29.4)
High FPG (≥6.1 mM/L) 38 (17.4) 43 (14.7)
Low HDL-C� 133 (61.0) 210 (71.7)
High TG (≥1.7 mM/L) 37 (17.0) 38 (13.0)
Table 2. Prevalence of each component of the metabolic syn- drome
Data are from the total subjects (men/women).
Sensitivities were 31/58=53% in men, 28/69=41% in women, and 59/127
=46.5% overall. Specificities were 147/160=92% in men, 205/224=92%
in women, and 352/384=91.7% overall. Positive predictive values were 31/44=70% in men, 28/47=60% in women, and 59/91=64.8% overall.
MetS, metabolic syndrome; SSPG, steady-state plasma glucose.
SSPG quartile
Total MetS
Upper 25% Lower 75%
Yes 59 (31/28) 32 (13/19) 91 (44/47)
No 68 (27/41) 352 (147/205) 420 (174/246)
Total 127 (58/69) 384 (160/224) 511 (218/293) Table 3. Relationship between metabolic syndrome diagnosed with ATP III criteria and IR
Data are the total subjects (men/women).
IR, insulin resistance; ATPIII, Adult Treatment Panel III; BMI, body mass index; FPG, fasting plasma glucose; TG, triglyceride; HDL-C, high-density lipoprotein cholesterol; BP, blood pressure.
Combination Metabolic Upper SSPG Positive predictive syndrome quartile value (%)
All 9 (6/3) 9 (6/3) 100 (100/100)
BMI, FPG, TG, HDL-C 5 (3/2) 5 (3/2) 100 (100/100) BP, FPG, TG, HDL-C 8 (2/6) 7 (2/5) 88 (100/83) BMI, TG, HDL-C 4 (2/2) 3 (2/1) 75 (100/50) BMI, HDL-C, FPG 3 (1/2) 2 (0/2) 67 (0/100) BMI, HDL-C, BP 18 (8/10) 12 (7/5) 67 (87.5/50) TG, HDL-C, BP 8 (3/5) 5 (2/3) 62.5 (66.7/60) BMI, BP, TG, HDL-C 7 (5/2) 4 (4/0) 57 (80/0) TG, HDL-C, FPG 7 (3/4) 4 (3/1) 57 (100/25) HDL-C, BP, FPG 11 (4/7) 5 (1/4) 45 (25/57) BMI, FPG, BP 3 (3/0) 1 (1/0) 33.3 (33.3/0) BMI, BP, FPG, HDL-C 6 (2/4) 2 (0/2) 33 (0/50)
TG, BP, FPG 1 (1/0) 0 (0/0) 0 (0/0)
BMI, TG, BP 1 (1/0) 0 (0/0) 0 (0/0)
BMI, TG, FPG 0 (0/0) 0 (0/0) 0 (0/0)
Total 91 (44/47) 59 (30/29) 65 (68/62)
Table 4. Identification of metabolic syndrome and IR by using combinations of ATP III criteria
*For all values except this one, p<0.01; tested by Spearman correlation coefficients.
IR, insulin resistance; BMI, body mass index; FPG, fasting plasma glu- cose; TG, triglyceride; HDL-C, high-density lipoprotein cholesterol; BP, blood pressure.
Component Total sample Men/women
BMI 0.481 0.517/0.461
BP
Systolic 0.221 0.146/0.286
Diastolic 0.262 0.212/0.308
FPG 0.289 0.299/0.275
TG 0.382 0.434/0.350
HDL-C -0.139 -0.244/-0.067*
Table 5. Spearman correlations between components of the me- tabolic syndrome and IR
associated with various degrees of IR. Our data showed that men had high BMIs and BPs and low HDL-C levels compared with women, a finding that might have accounted for the differences in prevalence. Traditional risk factors for CVD include abnormal lipid profiles, hypertension, obesity, and diabetes. Diabetes mellitus is now considered as a CVD equiv- alent (13). Individuals with MetS are believed have an increas- ed risk of diabetes mellitus (14). They are also prone to develop CVD. This is also true for individuals with IR, who have an increased risk for CVD and diabetes.
Several methods can be use to detect IR. The IST has a very high correlation (r=0.93) with the gold standard-hyperinsu- linemic euglycemic clamp for evaluating IR (15). Assessment for hyperinsulinemia, a surrogate measurement of IR, or the homeostatic model assessment of IR is usually used in epidemi- ologic studies. However, the results are not exactly correlat- ed with IR. The demonstration that the criteria for MetS can be used to identify subjects with IR is clinically important.
The criteria of MetS proposed by ATP III are more clinical- ly applicable than the World Health Organization criteria proposed in 1999. Our data revealed that the sensitivity to detect IR by using the ATP III criteria was less than 50%, with a slightly higher rate in men than in women. The sex- related difference may be attributed to the different prevalences of the individual components. However, specificity was sim- ilar and high (92%) in both sexes. Therefore, the criteria do not seem to be useful for evaluating subjects with MetS for detecting IR. These findings may not be initially persuasive.
The criteria for MetS included at least three component com- binations and individual components associated with IR; there- fore, subjects who fulfill the criteria for MetS might reason- ably be thought to have a high probability of IR. The high specificity may consistent with the concept. However, the relationship among these five components that can influence each other may explain the lower sensitivity to predict IR.
Our results were similar to those of a previous study in which about two-thirds of the subjects with diagnosed with MetS had IR (16). Our correlation value (r=0.139~-0.48) was rela- tively low because the association between SSPG and each component of the MetS was weaker than previously reported (r=0.39-0.59). However, a similar finding was that the two components most strongly associated with IR were obesity and high TG levels. Furthermore, we observed no sex-relat- ed difference.
All of the components of MetS were associated with IR.
However, the sensitivity to detect IR in subjects fulfilling the criteria for MetS was low (Table 4). In general, the predictive value increased as more components were included. Of inter- est, subjects with four of the criteria (all of the criteria exclud- ing TG) had a relatively low positive predictive value of 33%.
This finding may imply that subjects with MetS and having the high TG concentrations may tend to have IR. Further- more, in subjects fulfilled the MetS criteria with three-com- ponent combinations, the predictive values of three-compo-
nent combinations were 67 to 88% if BMI and HDL-C com- ponents were included. That means subjects with these both criteria may be more associated with IR. Oppositely, the rate of MetS or IR and positive predictive rate were low if three- component combinations included any two of BMI, HDL- C, and BMI plus one of BP or FPG component. These data revealed that BP and FPG may attenuate the predictive value for IR. Furthermore, our data suggest that the prevalence of IR based on individual components of the MetS was high- est for BMI and TG (60% and 52%, respectively, data not shown). When combinations of two components were eval- uated, the lowest positive predictive value for IR was for BP and FPG (0%); this supports the aforementioned findings.
Further supportive data was that the association to IR was lower in BP and FPG than that of TG and BMI. However, the highest predictive value for IR was obtained by the com- bination of BMI and low HDL-C (64%, data not shown), though the weakest association was observed between IR and HDL-C. The different prevalence (67% vs. 14%) may explain why HDL-C had a higher predictive value than that of TG. However, BMI still resulted in the highest predictive value in the setting.
Our study had several limitations. First, it was a cross-sec- tional cohort study. A population-based study should be con- ducted for further evaluation. Second, the relatively higher prevalence of low HDL-C levels in both sexes may need to be clarified. Last, we used BMI as an index of obesity with the same cut-off levels for both genders; this application might have influenced our results. Furthermore, the criteria of BMI might have contributed to the lower prevalence of MetS in this study, and thus, the interpretation of results should be accomplished cautiously with the consideration of the ATP III criteria that include the criteria of waist circumstance.
In conclusion, obesity and a high TG level were associated with IR and may be important markers for IR in subjects with MetS. However, fewer than half of our subjects with MetS had IR. Therefore, the criteria for MetS may not be practical for determining whether subjects have IR. Meanwhile, in terms of the prevention of CVD, obesity and high TG levels might play an important role than other criteria in subjects with MetS.
REFERENCES
1. Reaven GM. Banting lecture 1988. Role of insulin resistance in human disease. Diabetes 1988; 37: 1595-607.
2. Reaven GM. Role of insulin resistance in human disease (syndrome X): an expanded definition. Annu Rev Med 1993; 44: 121-31.
3. Alberti KG, Zimmet PZ. Definition, diagnosis, and classification of diabetes mellitus and its complications, I: diagnosis and classifica- tion of diabetes mellitus. Provisional report of a WHO consultation.
Diabet Med 1998; 15: 539-53.
4. Expert Panel on Detection, Evaluation, and Treatment of High Blood
Cholesterol in Adults. Executive Summary of the Third Report of the National Cholesterol Education Program (NCEP). Expert Panel on Detection, Evaluation, And Treatment of High Blood Cholesterol In Adults (Adult Treatment Panel III). JAMA 2001; 285: 2486-97.
5. Eckel RH. Obesity and heart disease: a statement for healthcare pro- fessionals from the Nutrition Committee, American Heart Associa- tion. Circulation 1997; 96: 3248-50.
6. Austin MA, Hokanson JE, Edwards KL. Hypertriglyceridemia as a cardiovascular risk factor. Am J Cardiol 1998; 81: 7-12B.
7. Havlik RJ, Hubert HB, Fabsitz RR, Feinleib M. Weight and hyperten- sion. Ann Intern Med 1983; 98: 855-9.
8. Fuller JH, Shipley MJ, Rose G, Jarrett RJ, Keen H. Coronary-heart disease risk and impaired glucose tolerance: the Whitehall Study.
Lancet 1980; 1: 1373-6.
9. Miller GJ, Miller NE. Plasma high density lipoprotein concentration and development of ischaemic heart-disease. Lancet 1975; 1: 16-9.
10. Lakka HM, Laaksonen DE, Lakka TA, Niskanen LK, Kumpusalo E, Tuomilehto J, Salonen JT. The metabolic syndrome and total cardio- vascular disease mortality in middle-aged men. JAMA 2002; 288:
2709-16.
11. Yip J, Facchini FS, Reaven GM. Resistance to insulin-medicated glu-
cose disposal as a predictor of cardiovascular disease. J Clin Endo- crinol Metab 1998; 83: 2773-6.
12. Shen SW, Reaven GM. Comparison of impedance to insulin-mediat- ed glucose uptake in normal subjects and in subjects with latent dia- betes. J Clin Invest 1970; 49: 2151-60.
13. Haffner SM, Lehto S, Ronnemaa T, Pyorala K, Laakso M. Mortality from coronary heart disease in subjects with type 2 diabetes and in nondiabetic subjects with and without prior myocardial infarction. N Engl J Med 1998; 339: 229-34.
14. Lorenzo C, Okoloise M, Williams K, Stern MP, Haffner SM; San Antonio Heart Study. The metabolic syndrome as predictor of type 2 diabetes: the San Antonio heart study. Diabetes Care 2003; 26:
3153-59.
15. Greenfield MS, Doberne L, Kraemer F, Tobey T, Reaven G. Assess- ment of insulin resistance with the insulin suppression test and the euglycemic clamp. Diabetes 1981; 30: 387-92.
16. Cheal KL, Abbasi F, Lamendola C, McLaughlin T, Reaven GM, Ford ES. Relationship to insulin resistance of the adult treatment panel III diagnostic criteria for identification of the metabolic syndrome. Dia- betes 2004; 53: 1195-200.