ISSN 2234-3806 • eISSN 2234-3814
https://doi.org/10.3343/alm.2021.41.5.469
Expanding the Non-Invasive Diagnosis of Acute
Rejection in Kidney Transplants Through Detection of Donor-Derived DNA in Urine: Proof-of-Concept Study
Jieun Kim , M.D., Ph,D.1, Dong-Moung Kim , B.A.2, Yu Jin Park , M.D., Ph.D.3, Seung-Tae Lee , M.D., Ph,D.3, Hyon-Suk Kim , M.D., Ph,D.3, Myoung Soo Kim , M.D., Ph.D.4,5, Beom Seok Kim , M.D., Ph.D.5,6,
and Jong Rak Choi , M.D., Ph.D.3
1Department of Laboratory Medicine, Soonchunhyang University College of Medicine, Seoul, Korea; 2Department of Biomedicine & Health Sciences, Graduate School, The Catholic University of Korea, Seoul, Korea; 3Department of Laboratory Medicine, Yonsei University College of Medicine, Seoul, Korea;
4Department of Surgery, Yonsei University College of Medicine, Seoul, Korea; 5Research Institute for Transplantation, Yonsei University College of Medicine, Seoul, Korea; 6Division of Nephrology, Department of Internal Medicine, Yonsei University College of Medicine, Seoul, Korea
Background: Approximately 10%–20% of kidney transplant (KT) recipients suffer from acute rejection (AR); thus, sensitive and accurate monitoring of allograft status is recom- mended. We evaluated the clinical utility of donor-derived DNA (dd-DNA) detection in the urine of KT recipients as a non-invasive means for diagnosing AR.
Methods: Urine samples serially collected from 39 KT recipients were tested for 39 single- nucleotide variant loci selected according to technical criteria (i.e., high minor allele fre- quency and low analytical error) using next-generation sequencing. The fraction of dd-DNA was calculated and normalized by the urine creatinine (UCr) level (%dd-DNA/UCr). The di- agnostic performance of %dd-DNA/UCr for AR was assessed by ROC curve analysis.
Results: There was an increasing trend of %dd-DNA/UCr in the AR group before subse- quent graft injury, which occurred before (median of 52 days) histological rejection. The serum creatinine (SCr) level differed significantly between the AR and non-AR groups at two and four months of follow-up, whereas %dd-DNA/UCr differed between the groups at six months of follow-up. The combination of %dd-DNA/UCr, SCr, and spot urine protein (UPtn)/UCr showed high discriminating power, with an area under the ROC curve of 0.93 (95% confidence interval: 0.81–1.00) and a high negative predictive value of 100.0%.
Conclusions: Although the dd-DNA–based test cannot eliminate the need for biopsy, the high negative predictive value of this marker could increase the prebiopsy probability of detecting treatable injury to make biopsy an even more effective diagnostic tool.
Key Words: Kidney transplantation, Acute rejection, Donor-derived DNA, Single-nucleotide variants, Next-generation sequencing, Urine
Received: August 4, 2020
Revision received: September 15, 2020 Accepted: March 16, 2021
Corresponding author:
Jong Rak Choi, M.D., Ph.D.
Department of Laboratory Medicine, Yonsei University College of Medicine, 50-1 Yonsei-ro, Seodaemun-gu, Seoul 03722, Korea
Tel: +82-2-2228-6111 Fax: +82-2-313-8289 E-mail: [email protected]
© Korean Society for Laboratory Medicine This is an Open Access article distributed under the terms of the Creative Commons Attribution Non-Commercial License (https://creativecom- mons.org/licenses/by-nc/4.0) which permits unrestricted non-commercial use, distribution, and reproduction in any medium, provided the original work is properly cited.
INTRODUCTION
Kidney transplantation (KT) is the preferred treatment for pa- tients with end-stage renal disease (ESRD). Although KT is a life-saving treatment, transplant recipients require lifelong follow-
up, with intensive surveillance of allograft function. Approxi- mately 10% and 20% of KT recipients suffer from acute rejec- tion (AR), which is a major risk factor of graft failure [1].
Diagnostic biopsies are performed in cases with a strong clini- cal suspicion of AR, which mainly depends on the deterioration
2017-03-16 https://crossmark-cdn.crossref.org/widget/v2.0/logos/CROSSMARK_Color_square.svg
of graft function determined as the estimated glomerular filtra- tion rate (eGFR) measured in terms of serum creatinine (SCr) levels [2]. However, the level and rate of SCr change poorly pre- dict graft failure, since the deterioration of kidney function fol- lows graft injury [3]. Moreover, alterations in SCr levels are not specific, as they may also indicate an intrinsic process such as renal artery stenosis, recurrence of original disease, a transient process, or AR [4]. However, the current strategies for monitor- ing graft dysfunction are not sufficient for indicating the need for biopsy since up to 10.8% of grafts have normal histological re- sults [5]. Therefore, a novel strategy is needed to decide whether to perform diagnostic biopsy in a timely manner.
Surrogate markers such as transcriptomic molecular profiles related to graft injury have been evaluated for the diagnosis of AR [6–9]. Although these markers can provide rich biological information, the degradative nature of RNA is a major barrier to their widespread adoption for clinical diagnosis [10]. In addition, these markers cannot accurately discriminate between various origins of damage, since they can be released from a remnant kidney or can be due to kidney-intrinsic etiologies [11].
Donor-derived DNAs (dd-DNAs) exist as extracellular cell-free DNA (dd-cfDNA) in the recipient or as an intracellular compo- nent of a donor cell (cellular dd-DNA), and both forms are likely to be released from necrotic or apoptotic cells in a transplanted organ [12, 13]. As the levels of dd-DNAs increase when an al- lograft is damaged by rejection or viral infection, they can be used as markers for graft injury [14, 15]. To distinguish dd-DNA from recipient DNA, detection of autosomal single-nucleotide variants (SNVs), given their wide range of uses, increases the discriminating power of dd-DNAs [13, 16].
Since graft cells or DNA can gain access to the urinary space, urine represents an appropriate sample type to investigate intra- graft events [17]. Therefore, the urine of KT recipients may serve as a form of liquid biopsy, offering a truly non-invasive di- agnostic method. Along with urinary tubule protein marker lev- els, the urinary dd-DNA level may increase after graft injury [18].
In this study, we evaluated the utility of urinary dd-DNA com- bined with other laboratory parameters to guide the timeliness of diagnostic biopsy. We evaluated clinical characteristics asso- ciated with outcomes and serially increasing levels of urinary dd-DNAs by multiplexing 39 autosomal informative SNVs identi- fied through next-generation sequencing (NGS), and compared the time of urinary dd-DNA to increase with the time point of histological AR.
MATERIALS AND METHODS
Study population and samplesForty-three patients with ESRD who had undergone scheduled KT from related or unrelated living donors from December 2014 to June 2015 at Severance Hospital, Seoul, Korea, were in- cluded in this observational prospective (sample collection and tests were performed the day before KT) and retrospective (clin- ical data were collected from medical records) study. Sample size was calculated based on the formula described by Buderer [19], with a maximum clinically acceptable two-tailed 95% con- fidence interval (CI) width of 0.1, estimated disease prevalence of 0.2, expected sensitivity of 0.9, and expected specificity of 0.9. Blood samples (>3 mL) were collected before KT to assess informative SNVs, whereas post-KT urine (>10 mL) and blood samples (>3 mL) were prospectively collected at the time of se- rial follow-up visits at 1 week; 2 weeks; and 1, 2, 4, and 6 months, as regular intervals; and at the time of biopsy. However, collection was discontinued at the time of AR detection (Fig. 1).
Patients’ demographic and clinical data were extracted by ret- rospectively reviewing electronic medical records. AR was diag- nosed by graft biopsy, which was performed for patients with deteriorating graft function. Histological diagnosis of AR was made by a single pathologist according to the Banff 2007 crite- ria [20]. The Institutional Review Board (IRB) of Severance Hos- pital approved this study (IRB 2015-1707-001). Written in- formed consent was obtained from all patients in accordance with the Declaration of Helsinki.
Sample collection and processing
First morning concentrated midstream urine samples (10–15 mL) were collected in sterile containers. Within 2 hours of col- lection, the samples were centrifuged at 2,000×g for 20 min- utes at room temperature (20–25°C). To acquire urinary cellular dd-DNA and to avoid its degradation, the supernatant was sep- arated from the urine pellet containing cells and cell debris. The cell pellet was transferred to a 1.5-mL microcentrifuge tube containing 1 mL of TRIzol (Invitrogen, Carlsbad, CA, USA) and stored at −80°C for further analysis. SCr, spot urine protein (UPtn), and urine creatinine (UCr) levels were measured using a Beckman Coulter AU680 analyzer (Beckman Coulter, Fuller- ton, CA, USA).
DNA extraction and multiplex PCR targeted amplicon sequencing
Genomic DNA was extracted from urinary cell pellets using QIA-
amp MinElute Column kit (Qiagen, Hilden, Germany) according to the standard procedure. For library construction, the optimal input DNA was 20 ng according to the manufacturer’s protocol;
samples of two recipients with a urinary DNA level <10 ng/μL or failed amplification (PCR-failed samples), and samples of two recipients with urinary tract infections (UTIs) were excluded.
Thirty-nine SNVs were selected according to the following cri- teria: minor allele frequency (MAF) >0.4, known low polymerase error, high coverage ( >1,000 counts) in the dbSNP database (http://www.ncbi.nlm.nih.gov/SNP), low linkage (>500-kb apart), no more than one additional SNV with MAF >0.1 in the ampli- con, and no known association with disease. In addition, targets of interest were selected if the adjacent allele was less than 5-bp away with a MAF of >0.5 to visually detect the sequencing bias.
Amplicons were indexed with dual-matched adapters (i5 and i7) with Unique Molecular Indices (UMI) designed to signifi- cantly reduce index misassignment. All 39 libraries were se-
quenced on a NextSeq550 flowcell (Illumina, San Diego, CA, USA) using a V3 NextSeq550 sequencing kit (Illumina). Further data analysis, including quality check, sequence alignment, and variant calling, were performed with a customized bioinformat- ics pipeline.
Analytical performance of SNV markers
The limit of detection (LoD) for dd-DNA measurement was esti- mated by serially diluting equimolar amounts of DNA extracted from the whole blood of two unrelated individuals (normal con- trols) using dilution factors of 50%, 10%, 1%, 0.1%, 0.01%, 0.001%, and 0.0001%. The dilution factors were transformed to log base 10 to warrant low-level values. The estimation was performed using fragmented DNA at a total input mass of 20 ng. We used the linear regression model to fit the data to the re- gression line and G-test to determine the appropriateness of the model [21].
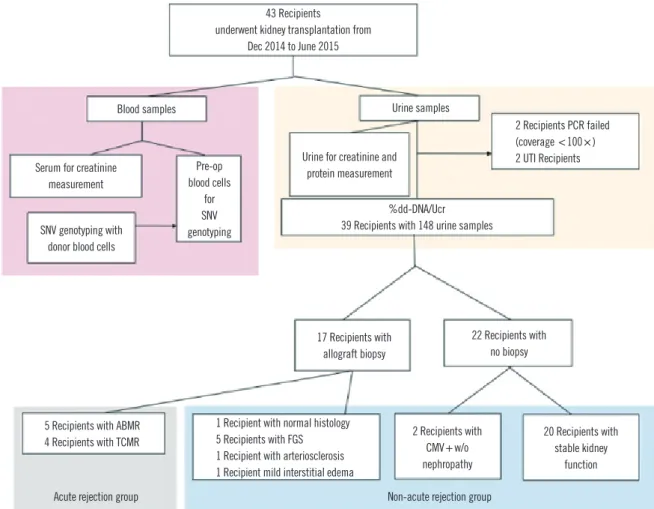
Fig. 1. Flow diagram of this study. A total of 39 recipients were evaluated for %dd-DNA/UCr. Two of four recipients with inadequate PCR results and two other recipients with bacterial UTIs were excluded.
Abbreviations: dd-DNA, donor-derived DNA; UCr, urine creatinine; UTIs, urinary tract infections; SNV, single-nucleotide polymorphism; ABMR, antibody- mediated rejection; TCMR, T cell-mediated rejection; FGS, focal glomerulosclerosis; CMV, cytomegalovirus.
43 Recipients underwent kidney transplantation from
Dec 2014 to June 2015
Blood samples
%dd-DNA/Ucr 39 Recipients with 148 urine samples Urine for creatinine and
protein measurement
Acute rejection group Non-acute rejection group
Serum for creatinine measurement
SNV genotyping with donor blood cells
17 Recipients with allograft biopsy
5 Recipients with ABMR
4 Recipients with TCMR 2 Recipients with
CMV+ w/o nephropathy
20 Recipients with stable kidney
function 1 Recipient with normal histology
5 Recipients with FGS 1 Recipient with arteriosclerosis 1 Recipient mild interstitial edema
22 Recipients with no biopsy Pre-op
blood cells for SNV genotyping
2 Recipients PCR failed (coverage <100×) 2 UTI Recipients Urine samples
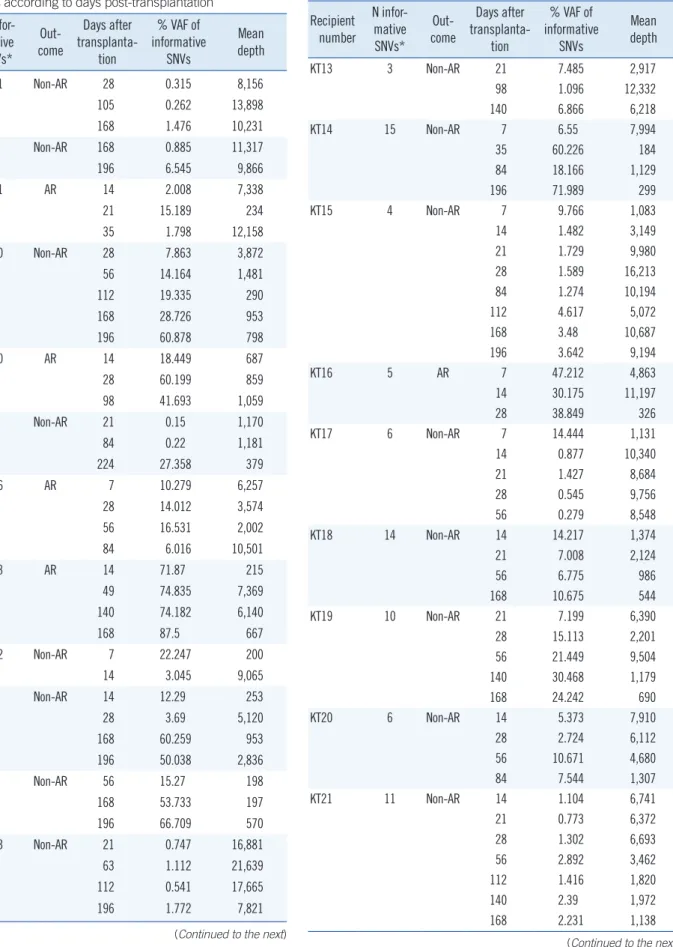
Table 1. Informative SNVs and variant allele frequency distributions of 39 recipients according to days post-transplantation
Recipient number
N infor- mative SNVs*
Out- come
Days after trans planta-
tion
% VAF of infor mative
SNVs
Mean depth
KT01 11 Non-AR 28 0.315 8,156
105 0.262 13,898
168 1.476 10,231
KT02 7 Non-AR 168 0.885 11,317
196 6.545 9,866
KT03 11 AR 14 2.008 7,338
21 15.189 234
35 1.798 12,158
KT04 10 Non-AR 28 7.863 3,872
56 14.164 1,481
112 19.335 290
168 28.726 953
196 60.878 798
KT05 10 AR 14 18.449 687
28 60.199 859
98 41.693 1,059
KT06 6 Non-AR 21 0.15 1,170
84 0.22 1,181
224 27.358 379
KT07 16 AR 7 10.279 6,257
28 14.012 3,574
56 16.531 2,002
84 6.016 10,501
KT08 13 AR 14 71.87 215
49 74.835 7,369
140 74.182 6,140
168 87.5 667
KT09 12 Non-AR 7 22.247 200
14 3.045 9,065
KT10 6 Non-AR 14 12.29 253
28 3.69 5,120
168 60.259 953
196 50.038 2,836
KT11 7 Non-AR 56 15.27 198
168 53.733 197
196 66.709 570
KT12 13 Non-AR 21 0.747 16,881
63 1.112 21,639
112 0.541 17,665
196 1.772 7,821
(Continued to the next)
Recipient number
N infor- mative SNVs*
Out- come
Days after trans planta-
tion
% VAF of infor mative
SNVs
Mean depth
KT13 3 Non-AR 21 7.485 2,917
98 1.096 12,332
140 6.866 6,218
KT14 15 Non-AR 7 6.55 7,994
35 60.226 184
84 18.166 1,129
196 71.989 299
KT15 4 Non-AR 7 9.766 1,083
14 1.482 3,149
21 1.729 9,980
28 1.589 16,213
84 1.274 10,194
112 4.617 5,072
168 3.48 10,687
196 3.642 9,194
KT16 5 AR 7 47.212 4,863
14 30.175 11,197
28 38.849 326
KT17 6 Non-AR 7 14.444 1,131
14 0.877 10,340
21 1.427 8,684
28 0.545 9,756
56 0.279 8,548
KT18 14 Non-AR 14 14.217 1,374
21 7.008 2,124
56 6.775 986
168 10.675 544
KT19 10 Non-AR 21 7.199 6,390
28 15.113 2,201
56 21.449 9,504
140 30.468 1,179
168 24.242 690
KT20 6 Non-AR 14 5.373 7,910
28 2.724 6,112
56 10.671 4,680
84 7.544 1,307
KT21 11 Non-AR 14 1.104 6,741
21 0.773 6,372
28 1.302 6,693
56 2.892 3,462
112 1.416 1,820
140 2.39 1,972
168 2.231 1,138
Table 1. Continued
(Continued to the next)
Recipient number
N infor- mative SNVs*
Out- come
Days after trans planta-
tion
% VAF of infor mative
SNVs
Mean depth
KT22 10 AR 7 37.995 595
28 2.386 7,236
35 5.667 1,772
KT23 7 Non-AR 21 57.325 443
28 9.601 694
56 44.057 3,159
140 12.425 1,103
168 26.747 164
KT24 12 Non-AR 7 0.779 7,900
14 20.215 212
KT25 6 Non-AR 21 31.853 1,733
28 76.37 1,202
56 39.785 529
98 11.965 1,084
140 34.996 155
168 67.116 358
KT26 14 Non-AR 7 4.451 2,753
21 3.166 6,206
28 1.564 577
56 7.804 5,964
168 6.526 3,915
196 27.5 117
KT27 13 Non-AR 21 75.125 4,275
28 70.905 861
56 47.568 179
84 69.772 575
112 62.085 319
140 55.039 1,018
KT28 18 Non-AR 7 73.252 4,460
21 51.656 298
28 71.759 2,175
49 68.115 2,853
84 69.13 2,829
112 70.321 1,243
140 64.442 6,659
KT29 16 Non-AR 7 81.141 1,448
14 87.269 156
KT30 19 Non-AR 7 59.978 215
21 83.587 607
KT31 10 Non-AR 7 3.449 15,343
14 3.683 2,645
Table 1. Continued
(Continued to the next)
Recipient number
N infor- mative SNVs*
Out- come
Days after trans planta-
tion
% VAF of infor mative
SNVs
Mean depth
KT32 12 Non-AR 7 1.42 4,315
14 9.069 314
KT33 11 AR 7 22.03 7,999
21 5.062 19,788
56 4.564 20,496
KT34 7 Non-AR 14 9.213 293
21 6.532 13,266
28 9.941 2,271
56 10.483 5,422
KT35 9 Non-AR 14 10.816 517
28 11.187 2,630
56 23.901 177
84 17.485 271
KT36 14 Non-AR 14 27.191 814
28 14.659 1,620
56 18.461 201
KT37 13 AR 14 14.544 2,919
21 14.918 3,103
56 28.527 1,219
63 22.442 2,787
KT38 10 Non-AR 7 45.796 156
28 14.405 159
KT39 10 AR 14 2.542 7,328
28 49.321 402
35 4.727 499
*The following 39 SNV markers were used for the chimerism calculation:
rs3738561, rs6480497, rs4757113, rs7983800, rs3745331, rs10426644, rs2540307, rs1358833, rs62270249, rs1436501, rs9386037, rs2159478, rs11023112, rs6589967, rs8022985, rs1202017, rs645107, rs6921313, rs4072990, rs6676162, rs72735619, rs11187560, rs10832201, rs7950719, rs6590643, rs1731550, rs10777988, rs4496026, rs12327492, rs1348784, rs281544, rs6445350, rs3819864, rs6863833, rs1423013, rs1561681, rs73230060, rs6995506, and rs16904057.
Abbreviations: SNV, single-nucleotide variant; VAF, variant allele frequency;
AR, acute rejection, including acute antibody-mediated rejection and T cell- mediated rejection.
Table 1. Continued
Linear regression analysis indicated a good linear correlation (R2=0.89, P =0.001), and the LoD was validated from 0.01%
of the NGS results (% NGS=1.38×% theoretical dilution−0.33).
The mean number of informative SNVs per patient was 10.4, with actual numbers ranging from 3 to 19. The average sequenc- ing depth per sample was 4,199.5±4,749.8 reads. The infor- mative markers were distributed across 18 chromosomes, with a mean product size of 83.6±6.2 bp and a mean distance be-
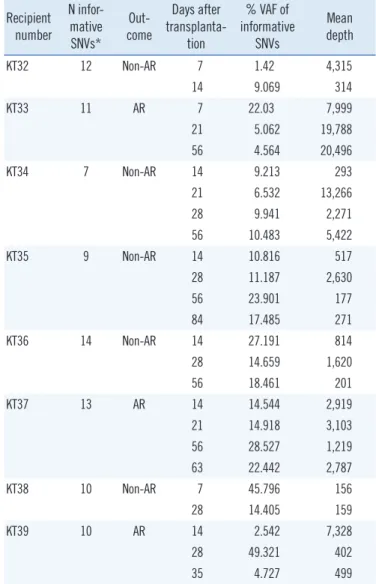
Table 2. Demographic data of the 39 donors and recipients
Characteristics* AR group (N=9) Non-AR group (N=30) P†
Age at transplantation (yr)
Recipient 49.0 (44.0–53.0) 44.0 (36.0–54.0) 0.385
Donor 47.0 (45.0–53.0) 40.0 (33.0–49.0) 0.054
Sex
Female/Male 2/7 (28.6%) 9/21 (42.9%) 0.595
Body mass index (kg/m2)
Recipient 22.4 (20.6–24.2) 22.5 (18.7–25.9) 0.958
Donor 22.3 (21.0–23.5) 22.5 (20.4–24.7) 0.741
Allograft length (cm) 10.5 (10.3–11.4) 11.0 (10.3–11.3) 0.446
Donor type (living)
Genetically related 2/9 (22.2%) 22/30 (73.3%) 0.001
Parent 0 12
Sibling 2 10
Genetically unrelated (Spouse) 7/9 (77.8%) 8/30 (26.7%)
Tacrolimus trough level (ng/mL) 3.60 (3.10–4.85) 4.73 (3.8–5.82) 0.110
ABO incompatibilities, N (%) (donor→recipient) 1 (11.1%) 10 (33.3%) 0.421
HLA mismatch (HLA-A, B, DR) 5 (3–6) 3 (2–4) 0.044
PRA Screening (%) (average) 0.0 (0.0–0.0) 0.0 (0.0–0.75) 0.208
*All data are shown as median (IQR) unless otherwise indicated (i.e., N, %); †Significant P values are in bold.
Abbreviations: AR, acute rejection, including acute antibody-mediated rejection and T cell- mediated rejection; PRA, panel-reactive antibody; SD, standard deviation.
tween markers on the same chromosome of 99.8 ±67.9 Mb (Table 1).
Measurement of dd-DNA
The fraction of dd-DNA (%dd-DNA) was calculated by dividing the read numbers of variant sequences corresponding to a do- nor genotype by the total coverage numbers of target sequences in each informative SNV. Averaging percentages were calculated for all informative SNVs. If a donor-specific genotype was het- erozygous, recipient-specific variant read numbers were multi- plied by two based on the method described in our previous study [22]. Background levels of an alternate allele resulting from an amplification or sequencing error were subtracted from the alternate allele frequency for each SNV site. The calculated
%dd-DNA was normalized against the UCr level of a sample.
The maximal %dd-DNA/UCr was defined as the highest %dd- DNA/UCr level among serial %dd-DNA/UCr values measured for each recipient (in both the AR and non-AR groups) at a cer- tain time point and as indicative of the occurrence of severe molecular injury.
Statistical analysis
Continuous variables with non-normal distribution, including the age and body mass index (BMI) of the recipient and donor, al- lograft length, number of mismatched HLA types, and average percentage of screened panel-reactive antibody (PRA), are pre- sented as median (interquartile range [IQR]). Continuous values such as %dd-DNA/UCr and SCr levels between the two groups (AR and non-AR) were compared based on the Mann-Whitney rank-sum test and are presented as median (range). Categorical variables, including the sex of recipient and donor, relation be- tween the recipient and donor, and ABO compatibility, are pre- sented as numbers and percentages. These variables were compared using either the chi-square test or Fisher’s exact test, as appropriate. The diagnostic performance of %dd-DNA/UCr (maximal %dd-DNA/UCr) was evaluated by receiver operating characteristic (ROC) curve analysis, and the glm function for modeling and visualization of plots was used in the R software, version 3.5.2, 64-bit (R Foundation for Statistical Computing, Vienna, Austria). The sensitivity and specificity in the ROC curve analysis were estimated using the Youden index. P <0.05 was considered statistically significant.
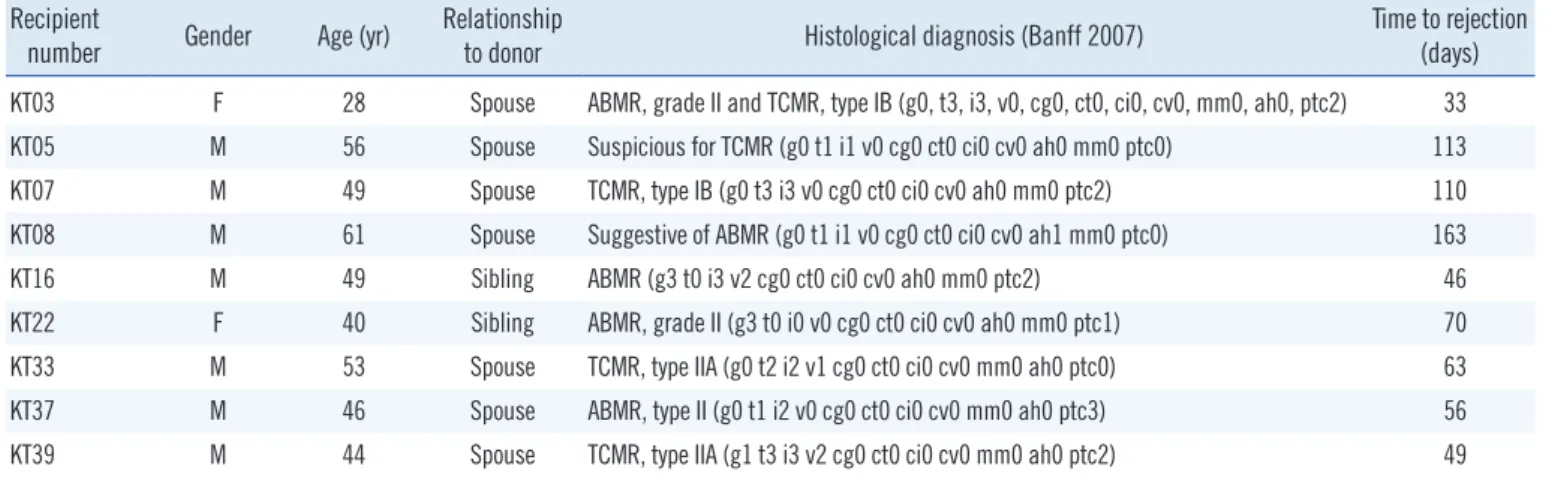
Table 3. Histological results for patients with AR Recipient
number Gender Age (yr) Relationship
to donor Histological diagnosis (Banff 2007) Time to rejection (days) KT03 F 28 Spouse ABMR, grade II and TCMR, type IB (g0, t3, i3, v0, cg0, ct0, ci0, cv0, mm0, ah0, ptc2) 33
KT05 M 56 Spouse Suspicious for TCMR (g0 t1 i1 v0 cg0 ct0 ci0 cv0 ah0 mm0 ptc0) 113
KT07 M 49 Spouse TCMR, type IB (g0 t3 i3 v0 cg0 ct0 ci0 cv0 ah0 mm0 ptc2) 110
KT08 M 61 Spouse Suggestive of ABMR (g0 t1 i1 v0 cg0 ct0 ci0 cv0 ah1 mm0 ptc0) 163
KT16 M 49 Sibling ABMR (g3 t0 i3 v2 cg0 ct0 ci0 cv0 ah0 mm0 ptc2) 46
KT22 F 40 Sibling ABMR, grade II (g3 t0 i0 v0 cg0 ct0 ci0 cv0 ah0 mm0 ptc1) 70
KT33 M 53 Spouse TCMR, type IIA (g0 t2 i2 v1 cg0 ct0 ci0 cv0 mm0 ah0 ptc0) 63
KT37 M 46 Spouse ABMR, type II (g0 t1 i2 v0 cg0 ct0 ci0 cv0 mm0 ah0 ptc3) 56
KT39 M 44 Spouse TCMR, type IIA (g1 t3 i3 v2 cg0 ct0 ci0 cv0 mm0 ah0 ptc2) 49
Abbreviations: KT, kidney transplantation; AR, acute rejection; ABMR, antibody-mediated rejection; TCMR, T-cell mediated rejection.
RESULTS
Patient characteristics and %dd-DNA/UCr
AR was more likely to occur in recipients who had received a transplant from an unrelated donor (P =0.001) and had a greater number of mismatched HLA types (P =0.044). There were no significant differences between the AR and non-AR groups in the age at KT (recipient and donor), sex of the recipi- ent, BMI (recipient and donor), allograft length, tacrolimus trough level, ABO incompatibility, and average % PRA (Table 2).
AR diagnosis and %dd-DNA/UCr
AR was diagnosed in nine recipients. Five recipients had acute antibody-mediated rejection and four had acute T-cell mediated rejection (Table 3). AR occurred at a median of 63 (47.5–111.5)
days after the KT. Eight of the nine recipients developed rejec- tion in the first four months after KT.
There was wide intra-recipient variation of %dd-DNA/UCr in the urine, even when considering all 56 samples of the 20 re- cipients in the non-AR group whose allograft remained stable (dd-DNA/UCr range: 0.10%–48.92%), suggesting that there might be a response to other subclinical acute graft injuries.
However, there was an increasing trend of %dd-DNA/UCr in the AR group before subsequent graft injury. The elevation of %dd- DNA/UCr occurred from 85 days to 12 days earlier (median of 52 days) than histological rejection.
The SCr differed significantly between the AR and non-AR groups at 2 and 4 months (P <0.05), whereas %dd-DNA/UCr differed significantly at 6 months of the follow-up period (Fig. 2)
Fig. 2. Comparison of SCr and %dd-DNA)/UCr between groups (AR vs. Non-AR). (A) SCr and (B) %dd-DNA)/UCr between the AR and non-AR groups at different time points (at 2 weeks 2, months 1, 2, 4, and 6) after transplantation. P values are presented above the box plots. Median (interquartile range [IQR]) values are presented at the bottom of graphs, outside of the box plots.
Abbreviations: SCr, serum creatinine; dd-DNA, donor-derived DNA; UCr, urine creatinine; AR acute rejection; Non-AR, non-acute rejection.
200
150
100
50
0
%dd-DNA/UCr
Time from transplant
MEDIAN 17.68 15.24 33.05 7.85 41.40 14.41 19.67 11.67 59.00 13.13 IQR 15.55,44.49 2.67,20.97 20.4,38.93 3.6,24.73 22.83,49.4 7.83,34.92 17.28,22.05 3.05,16.79 NA 7.28,23.36
2 weeks P =0.822
1 month P =0.957
2 months P =0.968
4 months P =0.968
6 months P =0.043*
AR group Non-AR group 8
6
4
2
0
Serum creatinine (mg/dL)
Time from transplant
MEDIAN 1.26 1.08 1.35 1.12 1.57 1.07 1.50 1.12 1.51 1.13 IQR 1.1, 1.51 0.87, 1.20 1.16,1.42 0.89,1.20 1.47,1.67 0.95,1.18 1.44,1.57 1.02,1.27 NA 1.02,1.25
2 weeks P =0.088
1 month P =0.088
2 months P =0.005*
4 months P =0.028*
6 months P =0.088
AR group Non-AR group
A B
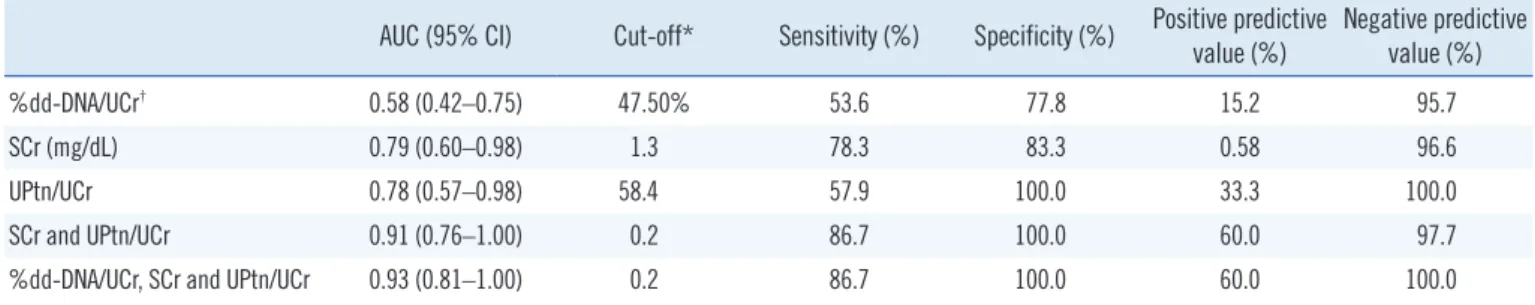
Table 4. Comparison of AUC values of ROC curves for % maximal dd-DNA/UCr, SCr, UPtn/UCr, and their combinations AUC (95% CI) Cut-off* Sensitivity (%) Specificity (%) Positive predictive
value (%) Negative predictive value (%)
%dd-DNA/UCr† 0.58 (0.42–0.75) 47.50% 53.6 77.8 15.2 95.7
SCr (mg/dL) 0.79 (0.60–0.98) 1.3 78.3 83.3 0.58 96.6
UPtn/UCr 0.78 (0.57–0.98) 58.4 57.9 100.0 33.3 100.0
SCr and UPtn/UCr 0.91 (0.76–1.00) 0.2 86.7 100.0 60.0 97.7
%dd-DNA/UCr, SCr and UPtn/UCr 0.93 (0.81–1.00) 0.2 86.7 100.0 60.0 100.0
*The cut-off values for %dd-DNA/UCr, SCr, and UPtn/UCr were individually selected to yield the highest Youden index, whereas the cut-offs for their combi- nations were determined using a non-parametric general linear model. †The diagnostic performance of %dd-DNA/UCr, evaluated by ROC curve analysis, were values of maximal %dd-DNA/UCr, which is defined as the highest %dd-DNA/UCr level among serial %dd-DNA/UCr values measured for each recipient (in both the AR and non-AR groups) at a certain time point.
Abbreviations: AUC, area under the curve; ROC, receiver operating characteristic; CI, confidence interval; dd-DNA, donor-derived DNA; UCr, urine creati- nine; SCr, serum creatinine; UPtn, spot urine protein.
Diagnostic performance of dd-DNA for AR
The area under the ROC curve (AUC) for discriminating AR from non-AR groups was poor for %dd-DNA/UCr alone, which cannot be used to establish the diagnosis of AR. The AUC of SCr alone and UPtn/UCr alone were higher than that of %dd- DNA/UCr alone. The discriminating power improved with the combination of %dd-DNA/UCr, SCr, and UPtn/UCr (0.93), which was similar to that observed with the combination of SCr and UPtn/UCr (0.91).
The positive predictive value (PPV) of %dd-DNA/UCr alone compared to SCr alone showed improved performance (15.2%
vs. 0.58%) when screening AR; however, the performance was still inferior to that of UPtn/UCr (33.3%). The PPV of %dd-DNA/
UCr alone improved with the combination of SCr and UPtn/UCr to 60.0%. However, a high negative predictive value (NPV) was found for %dd-DNA/UCr, SCr, and Uptn/UCr, both individually and in combination (Table 4).
DISCUSSION
In this study, the clinical performance of %dd-DNA/UCr for AR diagnosis was assessed and compared with the performance of standard diagnostic tools such as allograft biopsy and traditional analyses of laboratory parameters, including SCr and UPtn. We applied 39 highly discriminative autosomal SNVs with analytic accuracy. We suggest autosomal SNVs as the most appropriate markers of allograft rejection in clinical practice because analy- sis of the Y chromosome is only suitable for female KT recipi- ents from male donors, and more than half of KT in Korea are from genetically related donors [23, 24].
Several studies have employed methods that quantify dd- DNA, including quantitative PCR, digital-droplet PCR (dPCR),
and targeted NGS [16]. dPCR is a sensitive and cost-effective method to quantify circulating nucleic acids; however, depend- ing on the instrument, it is susceptible to poor test design, lead- ing to cross-reactivity and false positives [25]. NGS also has the potential to introduce biases such as pre-amplification of dd- DNA [26]. Thus, we selected targets of interest with a GC con- tent <61% and adjacent alleles within a 5-bp region having an MAF of >0.5 to visually detect any sequencing bias. Since NGS-based multiplex platforms are feasible for hundreds of primer pairs and their cost is continuously reducing, their wide- spread utility is expected, especially for the monitoring of multi- ple organ transplantations from different donors.
Numerous types of nucleic acids can be measured in the urine, including cfDNA, cellular DNA, and RNAs such as mi- croRNAs, long non-coding RNAs, and mRNAs. The fraction of cellular DNA in the urine is far greater than that of cfDNA, which occurs in donor-derived vascular/tubular cells and lym- phocytes in the urine of KT recipients [18, 27]. Many clinical studies have evaluated the diagnostic value of dd-DNA, espe- cially in the form of plasma and urinary cell-free dd-DNA (dd- cfDNA), for the prediction of AR [14, 15, 28–30]. The levels of dd-cfDNA were shown to be sensitive to graft injury, with unsta- ble kinetics in the early post-transplantation phase [31]. This means that their fluctuations need to be interpreted in conjunc- tion with other clinical and laboratory parameters [16]. More- over, the low level of cfDNA is problematic, as many molecular techniques require higher DNA amounts, and contamination by cellular DNA or PCR inhibitors affects NGS performance [32].
Therefore, we concluded that cellular dd-DNA is more suitable for multiplex PCR enrichment for urine samples of KT recipi- ents, and the abundant cellular dd-DNA is more adequate to conduct monitoring.
We excluded patients with UTI to minimize confounding fac- tors. High intra-recipient variation, with dd-DNA/UCr ranging from 0.10% to 48.92%, was observed in non-AR recipients.
This result was not surprising because cellular dd-DNA reflects tissue breakdown due to injury in a donor organ, and regenera- tion of a transplanted kidney is a normal physiological process after transplantation [33, 34]. However, the observed %dd- DNA/UCr fluctuation could not be histologically explained, since a protocol biopsy was not obtained at each time point.
Increased %dd-DNA/UCr before AR was observed and was significantly discriminable from that in the non-AR group at 6-month follow-up, whereas a difference in SCr levels was ob- served between the AR and non-AR groups at the 2-month and 4-month follow-ups. The inclusion of %dd-DNA/UCr with SCr and UPtn/UCr did not affect the diagnostic performance , which may be due to relatively scant number of urine samples avail- able for %dd-DNA/UCr measurements owing to the unpredict- able timing of AR and biological variation among urine samples.
However, molecular injury, represented as the maximal %dd- DNA/UCr, occurred earlier than clinical or histological AR, with a median of 52 days, which implies that %dd-DNA/UCr is a sensitive marker for AR.
This study has several limitations. First, we did not perform a protocol biopsy for surveillance and the total number of biopsy- confirmed AR allografts was small. Therefore, we could not esti- mate the baseline %dd-DNA/UCr for all biopsy-confirmed stable allografts. Second, only living-donor KT recipients were included in the study since part of the samples and consent had to be obtained before KT. Since the majority of transplantations use organs derived from deceased donors, the translation of our re- sults to the deceased donor pool remains to be confirmed.
To the best of our knowledge, this is the first study to examine cellular dd-DNA from the urine samples of KT recipients using an SNV-based NGS approach and to evaluate the diagnostic performance of this approach with adjunctive biomarkers. Our results might help patients identify a possibility of transplant re- jection before deciding on proceeding with a kidney biopsy. In- formed biopsy decisions are needed to reduce morbidity and increase the cost-effectiveness of transplant recipient surveil- lance. Our strategy would be especially useful for patients who are on anticoagulation therapy or have other reasons to avoid biopsy. Based on our research, additional studies regarding an- alytical standardization and validation of urinary dd-DNA are needed for its clinical application.
ACKNOWLEDGEMENTS
We thank Ju Han Lee at Research Institute for Transplanta- tion, Yonsei University College of Medicine, for cooperation, and Dxome (Seoul, Korea) for technical assistance.
AUTHOR CONTRIBUTIONS
Kim J participated in research design and in the writing of the paper. Kim DM participated in the performance of the research.
Park YJ participated in the acquisition of data. Lee ST contrib- uted provided technical and analytical support. Kim HS partici- pated in advising research methodology. Kim MS participated in research design and collection of samples. Kim BS participated in critically revising the study. Choi JR supervised the full study and acquired financial support.
CONFLICTS OF INTEREST
The authors declare no conflicts of interest.
RESEARCH FUNDING
This study was supported by a grant (NRF-2015R1D1A1A01059210) of the National Research Foundation of Korea, a faculty research grant (6-2015-0164) of Yonsei University College of Medicine, and the Soonchunhyang University Research Fund, Korea.
ORCID
Jieun Kim https://orcid.org/0000-0002-7794-3475 Dong-Moung Kim https://orcid.org/0000-0003-0098-2334 Yu Jin Park https://orcid.org/0000-0002-8673-5256 Seung-Tae Lee https://orcid.org/0000-0003-1047-1415 Hyon-Suk Kim https://orcid.org/0000-0001-5662-7740 Myoung Soo Kim https://orcid.org/0000-0002-8975-8381 Beom Seok Kim https://orcid.org/0000-0002-5732-2583 Jong Rak Choi https://orcid.org/0000-0002-0608-2989
REFERENCES
1. Harada KM, Mandia-Sampaio EL, de Sandes-Freitas TV, Felipe CR, Park SI, Pinheiro-Machado PG, et al. Risk factors associated with graft loss and patient survival after kidney transplantation. Transplant Proc 2009;41:3667-70.
2. Thomas ME, Blaine C, Dawnay A, Devonald MA, Ftouh S, Laing C, et al. The definition of acute kidney injury and its use in practice. Kidney
Int 2015;87:62-73.
3. Lachenbruch PA, Rosenberg AS, Bonvini E, Cavaillé-Coll MW, Colvin RB. Biomarkers and surrogate endpoints in renal transplantation: pres- ent status and considerations for clinical trial design. Am J Transplant 2004;4:451-7.
4. Josephson MA. Monitoring and managing graft health in the kidney transplant recipient. Clin J Am Soc Nephrol 2011;6:1774-80.
5. Devadass CW, Vanikar AV, Nigam LK, Kanodia KV, Patel RD, Vinay KS, et al. Evaluation of renal allograft biopsies for graft dysfunction and rele- vance of C4d staining in antibody mediated rejection. J Clin Diagn Res 2016;10:EC11-5.
6. Held PJ, McCormick F, Ojo A, Roberts JP. A cost-benefit analysis of government compensation of kidney donors. Am J Transplant 2016;16:
877-5.
7. Shahbaz SK, Pourrezagholi F, Barabadi M, Foroughi F, Hosseinzadeh M, Ahmadpoor P, et al. High expression of TIM-3 and KIM-1 in blood and urine of renal allograft rejection patients. Transpl Immunol 2017;43- 44:11-20.
8. Lorenzen JM, Volkmann I, Fiedler J, Schmidt M, Scheffner I, Haller H, et al. Urinary miR-210 as a mediator of acute T-cell mediated rejection in renal allograft recipients. Am J Transplant 2011;11:2221-7.
9. Lorenzen JM, Schauerte C, Kölling M, Hübner A, Knapp M, Haller H, et al. Long noncoding RNAs in urine are detectable and may enable early detection of acute T cell-mediated rejection of renal allografts. Clin Chem 2015;61:1505-14.
10. Srinivasan M, Sedmak D, Jewell S. Effect of fixatives and tissue pro- cessing on the content and integrity of nucleic acids. Am J Pathol 2002;
161:1961-71.
11. Vaidya VS, Ferguson MA, Bonventre JV. Biomarkers of acute kidney in- jury. Annu Rev Pharmacol Toxicol 2008;48:463-93.
12. Lo YM, Tein MS, Pang CC, Yeung CK, Tong KL, Hjelm NM. Presence of donor-specific DNA in plasma of kidney and liver-transplant recipients.
Lancet 1998;351:1329-30.
13. Beck J, Bierau S, Balzer S, Andag R, Kanzow P, Schmitz J, et al. Digital droplet PCR for rapid quantification of donor DNA in the circulation of transplant recipients as a potential universal biomarker of graft injury.
Clin Chem 2013;59:1732-41.
14. Whitlam JB, Ling L, Skene A, Kanellis J, Ierino FL, Slater HR, et al. Di- agnostic application of kidney allograft-derived absolute cell-free DNA levels during transplant dysfunction. Am J Transplant 2019;19:1037- 49.
15. Bloom RD, Bromberg JS, Poggio ED, Bunnapradist S, Langone AJ, Sood P, et al. Cell-free DNA and active rejection in kidney allografts. J Am Soc Nephrol 2017;28:2221-32.
16. Knight SR, Thorne A, Lo Faro ML. Donor-specific cell-free DNA as a bio- marker in solid organ transplantation. A systematic review. Transplanta- tion 2019;103:273-83.
17. Nissaisorakarn V, Lee JR, Lubetzky M, Suthanthiran M. Urine biomark- ers informative of human kidney allograft rejection and tolerance. Hum Immunol 2018;79:343-55.
18. Zhang Z, Ohkohchi N, Sakurada M, Mizuno Y, Miyagi S, Satomi S, et al.
Analysis of urinary donor-derived DNA in renal transplant recipients
with acute rejection. Clin Transpl 2002;16(S8):45-50.
19. Buderer NMF. Statistical methodology: I. Incorporating the prevalence of disease into the sample size calculation for sensitivity and specificity.
Acad Emerg Med 1996;3:895-900.
20. Solez K, Colvin RB, Racusen LC, Haas M, Sis B, Mengel M, et al. Banff 07 classification of renal allograft pathology: updates and future direc- tions. Am J Transplant 2008;8:753-60.
21. Jhang JS, Chang CC, Fink DJ, Kroll MH. Evaluation of linearity in the clinical laboratory. Arch Pathol Lab Med 2004;128:44-8.
22. Kim J, Hwang IS, Shin S, Choi JR, Lee ST. SNP-based next-generation sequencing reveals low-level mixed chimerism after allogeneic hemato- poietic stem cell transplantation. Ann Hematol 2018;97:1731-4.
23. Sigdel TK, Vitalone MJ, Tran TQ, Dai H, Hsieh SC, Salvatierra O, et al. A rapid noninvasive assay for the detection of renal transplant injury.
Transplantation 2013;96:97-101.
24. Chung BH, Jung MH, Bae SH, Kang SH, Hwang HS, Hyoung BJ, et al.
Changing donor source pattern for kidney transplantation over 40 years:
a single-center experience. Korean J Intern Med 2010;25:288-93.
25. Huggett JF, Cowen S, Foy CA. Considerations for digital PCR as an ac- curate molecular diagnostic tool. Clin Chem 2015;61:79-88.
26. Aird D, Ross MG, Chen WS, Danielsson M, Fennell T, Russ C, et al. An- alyzing and minimizing PCR amplification bias in Illumina sequencing libraries. Genome Biol 2011;12:R18.
27. Augustus E, Van Casteren K, Sorber L, van Dam P, Roeyen G, Peeters M, et al. The art of obtaining a high yield of cell-free DNA from urine. PloS One 2020;15:e0231058.
28. Grskovic M, Hiller DJ, Eubank LA, Sninsky JJ, Christopherson C, Collins JP, et al. Validation of a clinical-grade assay to measure donor-derived cell-free DNA in solid organ transplant recipients. J Mol Diagn 2016;
18:890-902.
29. Jordan SC, Bunnapradist S, Bromberg JS, Langone AJ, Hiller D, Yee JP, et al. Donor-derived cell-free DNA identifies antibody-mediated rejection in donor specific antibody positive kidney transplant recipients. Trans- plant Direct 2018;4:e379.
30. Lee H, Park YM, We YM, Han DJ, Seo JW, Moon H, et al. Evaluation of digital PCR as a technique for monitoring acute rejection in kidney transplantation. Genomics Inform 2017;15:2-10.
31. Gielis EM, Beirnaert C, Dendooven A, Meysman P, Laukens K, De Schrijver J, et al. Plasma donor-derived cell-free DNA kinetics after kid- ney transplantation using a single tube multiplex PCR assay. PloS One 2018;13:e0208207.
32. Johansson G, Andersson D, Filges S, Li J, Muth A, Godfrey TE, et al.
Considerations and quality controls when analyzing cell-free tumor DNA. Biomol Detect Quantif 2019;17:100078.
33. Hung ECW, Shing TKF, Chim SSC, Yeung PC, Chan RW, Chik KW, et al.
Presence of donor-derived DNA and cells in the urine of sex-mis- matched hematopoietic stem cell transplant recipients: implication for the transrenal hypothesis. Clin Chem 2009;55:715-22.
34. Franquesa M, Flaquer M, Cruzado JM, Grinyó JM. Kidney regeneration and repair after transplantation. Curr Opin Organ Transplant 2013;18:
191-6.