INTRODUCTION
Self‐rated health status and healthcare service utilization are valuable determinants for assessing the performance of the health system [1].
They are the most important outcome indicators for patients who use primary care services, and even self‐rated health status alone is consid- ered to be a sensitive indicator [2].
The Medicaid program provides medical assistance for low income people. According to the Korea National Health Institute [3], the esti- mated percentage of Medicaid beneficiaries was 3.2% of the total Korean population in 2011. The quantity and quality of Medicaid program ben- efits have increased over time, leading to concerns over increases in health care utilization and expenditures [4, 5]. Researchers suggest that the moral hazard of both beneficiaries and providers lead to a higher utilization of health care services [6]. Moral hazard refers to consumer behavior that leads to higher utilization when services are covered by in-
surance [7]. In order to control healthcare utilization, the Medicaid pro- gram limits the coverage period to 356 days per year, which was the only incentive for beneficiaries to reduce their utilization prior to 2007. In 2007, the Medicaid program adopted cost sharing for Medicaid Type 1 beneficiaries [8, 9]. In April 2009, a few Medicaid beneficiaries with chronic illnesses and those under 18 years among the group just above the poverty line were categorized as National Health Insurance benefi- ciaries with support from the government for their healthcare expendi- tures [10].
Previous studies have examined the levels of health services utiliza- tion among Medicaid beneficiaries and those of National Healthcare In- surance (NHI) beneficiaries, but did not account for the need aspects of these two populations [11]. It is unclear why health services utilization by Medicaid beneficiaries is greater than that of those who fall under the NHI program. In 2004, Lee and Kim [6] studied the behavior and extent of health care utilization by Medicaid beneficiaries using the behavioral
Corresponding author: Eun-Ok Choi
Inje University College of Medicine, Department of Nursing, Gaegeum-Dong Busanjin-Gu, Busan 47392, Korea Tel: +82-51-890-6822, Fax: +82-51-896-9840, E-mail: [email protected]
Received: June 21, 2016 Revised: July 21, 2016 Accepted: August 5, 2016
This is an Open Access article distributed under the terms of the Creative Commons Attribution Non-Commercial License (http://creativecommons.org/licenses/by-nc/4.0) which permits unrestricted non-commercial use, distribution, and reproduction in any medium, provided the original work is properly cited.
Health Status and Health Service Utilization: Barriers and Facilitators for Korea Medicaid Beneficiaries
Sung-Heui Bae
1, Eun-Ok Choi
2, In sook Lee
3, In Young Lee
4, Chae min Chun
51Ewha Womans University, College of Nursing; 2Inje University College of Medicine; Department of Nursing; 3Seoul National University, College of Nursing;
4Gangbukgu Public health center; 5Korea Centers for Disease Control & Prevention, Division of Chronic Disease Surveillance, Korea
Purpose: This study compares beneficiaries of Korean Medicaid with those under the National Health Insurance program, seeking to
understand how each group utilizes their healthcare. Methods: Data were obtained from a Health Promotion Survey in 2005. Health status was measured by the respondents’ perception of health. Health service utilization included the availability of healthcare servic- es, the type of healthcare institution, and intent to revisit. Predisposing and enabling factors, as well as health care needs were used for this study. Results: Compared to National Health Insurance beneficiaries, Medicaid beneficiaries reported lower levels of health status and fewer enabling factors. They had more chronic diseases and disabilities. Education level, existence of chronic diseases, ex- ercise patterns, and disabilities were associated with health status. Conclusion: We found that Medicaid beneficiaries had fewer re- sources and higher levels of health needs. As Medicaid is reformed, policy makers and administrators should understand healthcare utilization behaviors of Medicaid beneficiaries and the factors hindering access to care.
Key Words: Healthcare utilization, Health policy, Self‐rated health, Health disparity
model [12] and discovered several factors affecting the behavior of Med- icaid beneficiaries regarding healthcare utilization, including issues such as perceived health status, age, and gender. However, there is limited un- derstanding of the barriers and facilitators of health service utilization by Medicaid beneficiaries and whether these lead to an increase of healthcare utilization by the Medicaid beneficiaries.
Therefore, this study examined the behavior of healthcare utilization in Medicaid beneficiaries and factors associated with health status and utilization in Medicaid program beneficiaries by adapting the Anderson behavioral model [12]. Medicaid does not provide medical assistance for all poor people. Certain categories of individuals can apply for eligibility.
The Medicaid program serviced approximately 1.8 million low‐income Koreans in 2008 and 1.61 million low‐income Koreans in 2011 [3,4]. The healthcare utilization and expenditure of the Medicaid program has been increasing. Compared to 2002, the number of visits per person and the total expenditure of the program increased by 25.9% and 60% in 2005, respectively [4]. Interestingly, the days of care for Medicaid benefi- ciaries were 80.0% greater than those for the NHI beneficiaries [4]. In or- der to reduce healthcare utilization and expenditure of the Medicaid program, the Korean government adapted a new system to assess the healthcare utilization of Medicaid beneficiaries and offered financial in- centives to reduce moral hazard, such as cost sharing in 2007. According to Choi et al. [4], the new Medicaid program decreased healthcare utili- zation and expenditure in 2008. However, due to limited understanding of how Medicaid beneficiaries utilize their healthcare, the new system may hinder access to care for Medicaid beneficiaries.
The behavioral health service model [12] has been widely used as a guideline for predicting healthcare utilization. The model categorizes influential factors for service utilization into three components: predis- posing, enabling, and need factors. Predisposing factors include demo- graphic characteristics such as age, sex, and education which may influ- ence the status of health and the use of healthcare services. Enabling variables encompass a variety of resources that provide means to health- care services, including income, health insurance, living arrangement, and the existence of a spouse or social network. Physical health condi- tions, such as chronic diseases, and smoking and drinking behavior, represent the need for healthcare services. Although the Medicaid pro- gram might increase enabling factors for beneficiaries to use healthcare services, Medicaid beneficiaries still have barriers to access healthcare services, such as the lack of information (lower education levels), poor
health status, chronic diseases, and lack of people who can help with ac- cess to healthcare services [6,13].
Therefore, the purpose of this study is to understand how predispos- ing, enabling, and need factors influence the health status and the healthcare service utilization of Medicaid beneficiaries. Additionally, healthcare service utilization amongst a low income population that share resident environments with Medicaid beneficiaries was examined, as this population is likely to be Medicaid beneficiaries.
METHODS
Design and Sample
The current study used data from the Health Promotion Survey col- lected by the Gangbukgu Community Health Center in South Korea in 2005 [14], initially collected to investigate the health care needs of a low income population. This survey collected basic demographic data, health promotion behavior, health status, health service needs, and healthcare environment. This study performs secondary data analysis using a cross‐sectional study design. The survey was targeted to a resi- dent from each household living in a lower income bracket, located in a special government‐housing complex in Seoul. In order to reside in the special government‐housing complex, applicants needed to meet certain criteria for eligibility, which are a combination of income level, disability, and veteran status. According to the eligibility criteria for the Medicaid program, residents are categorized under the Medicaid program or the NHI program. For those under the NHI program, although they are NHI beneficiaries, they can be considered potential Medicaid beneficia- ries based on the Medicaid eligibility criteria.
The survey questionnaire was completed through a face‐to‐face inter- view. The data consisted of 365 responses collected from July 2005 through September 2005. In this study, we used data collected from resi- dents aged 50 or older who were Medicaid beneficiaries or NHI benefi- ciaries because of similar levels of healthcare services needs in the low income population at this age level (aged 50 or older). The total number of eligible participants was 211 out of 365 (57.8%) respondents. Due to missing data within select variables, the final dataset for the current study consisted of 207 people.
Measures
Table 1 presents the study variables. In general, measurement of these
variables was straightforward. However, our approach to several of the outcome and explanatory variables (e.g., predisposing factors, enabling factors, health needs) requires additional explanation.
Outcome variables
In this study, there were two outcome variables, including health status and health service utilization. Health status was measured by subjective perception of health. The item asked “How would you rate your overall
health at the present time?” The total scores ranged from 0 (negative health perception: feel ready to die) to 10 (positive health perception: very healthy). Health service utilization included the following three catego- ries: (a) whether respondents use healthcare services when they are sick (yes/no), (b) what kind of healthcare institution was accessed most often (respondents selected one or two out of five options including hospitals, clinics, oriental medicine clinics, community health centers, and other), and (c) would they revisit the healthcare institution, using a yes/no format.
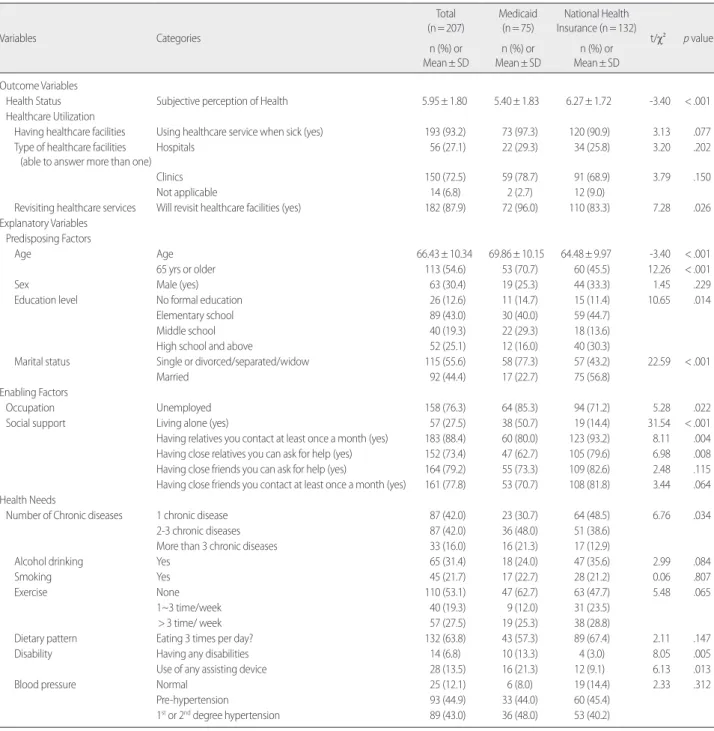
Table 1. Summary Statistics on the Sample of Survey Respondents (N=207)
Variables Categories
Total (n= 207)
Medicaid (n= 75)
National Health Insurance (n= 132)
t/χ² p value n (%) or
Mean± SD
n (%) or Mean± SD
n (%) or Mean± SD
Outcome Variables
Health Status Subjective perception of Health 5.95± 1.80 5.40± 1.83 6.27± 1.72 -3.40 < .001
Healthcare Utilization
Having healthcare facilities Using healthcare service when sick (yes) 193 (93.2) 73 (97.3) 120 (90.9) 3.13 .077 Type of healthcare facilities
(able to answer more than one)
Hospitals 56 (27.1) 22 (29.3) 34 (25.8) 3.20 .202
Clinics 150 (72.5) 59 (78.7) 91 (68.9) 3.79 .150
Not applicable 14 (6.8) 2 (2.7) 12 (9.0)
Revisiting healthcare services Will revisit healthcare facilities (yes) 182 (87.9) 72 (96.0) 110 (83.3) 7.28 .026
Explanatory Variables
Predisposing Factors
Age Age 66.43± 10.34 69.86± 10.15 64.48± 9.97 -3.40 < .001
65 yrs or older 113 (54.6) 53 (70.7) 60 (45.5) 12.26 < .001
Sex Male (yes) 63 (30.4) 19 (25.3) 44 (33.3) 1.45 .229
Education level No formal education 26 (12.6) 11 (14.7) 15 (11.4) 10.65 .014
Elementary school 89 (43.0) 30 (40.0) 59 (44.7)
Middle school 40 (19.3) 22 (29.3) 18 (13.6)
High school and above 52 (25.1) 12 (16.0) 40 (30.3)
Marital status Single or divorced/separated/widow 115 (55.6) 58 (77.3) 57 (43.2) 22.59 < .001
Married 92 (44.4) 17 (22.7) 75 (56.8)
Enabling Factors
Occupation Unemployed 158 (76.3) 64 (85.3) 94 (71.2) 5.28 .022
Social support Living alone (yes) 57 (27.5) 38 (50.7) 19 (14.4) 31.54 < .001
Having relatives you contact at least once a month (yes) 183 (88.4) 60 (80.0) 123 (93.2) 8.11 .004
Having close relatives you can ask for help (yes) 152 (73.4) 47 (62.7) 105 (79.6) 6.98 .008
Having close friends you can ask for help (yes) 164 (79.2) 55 (73.3) 109 (82.6) 2.48 .115
Having close friends you contact at least once a month (yes) 161 (77.8) 53 (70.7) 108 (81.8) 3.44 .064
Health Needs
Number of Chronic diseases 1 chronic disease 87 (42.0) 23 (30.7) 64 (48.5) 6.76 .034
2-3 chronic diseases 87 (42.0) 36 (48.0) 51 (38.6)
More than 3 chronic diseases 33 (16.0) 16 (21.3) 17 (12.9)
Alcohol drinking Yes 65 (31.4) 18 (24.0) 47 (35.6) 2.99 .084
Smoking Yes 45 (21.7) 17 (22.7) 28 (21.2) 0.06 .807
Exercise None 110 (53.1) 47 (62.7) 63 (47.7) 5.48 .065
1~3 time/week 40 (19.3) 9 (12.0) 31 (23.5)
> 3 time/ week 57 (27.5) 19 (25.3) 38 (28.8)
Dietary pattern Eating 3 times per day? 132 (63.8) 43 (57.3) 89 (67.4) 2.11 .147
Disability Having any disabilities 14 (6.8) 10 (13.3) 4 (3.0) 8.05 .005
Use of any assisting device 28 (13.5) 16 (21.3) 12 (9.1) 6.13 .013
Blood pressure Normal 25 (12.1) 6 (8.0) 19 (14.4) 2.33 .312
Pre-hypertension 93 (44.9) 33 (44.0) 60 (45.4)
1st or 2nd degree hypertension 89 (43.0) 36 (48.0) 53 (40.2)
Predisposing Factors
Age, sex, and educational level were selected as predisposing variables.
Enabling Factors
Occupation and social support were included as enabling factors. Oc- cupation was measured by whether the participant had, or did not have, a job. Five items were used to measure social support (Table 1). These items included living alone, contact with relatives, relatives that respon- dents can ask for help, contact with friends, and friends that respondents can ask for help.
Health Needs
Respondents reported any chronic disease diagnoses. Responses were categorized based on the number of chronic diseases they reported (1 chronic disease, 2 to 3 chronic diseases, and more than 3 chronic diseases).
Alcohol and smoking behaviors were measured by a dichotomous yes/no variable. Exercise pattern was also measured by a categorical variable; the number of days per week that respondents worked out (none, 1 to 3 days, and more than 3 days). Dietary pattern was measured by whether or not respondents eat 3 times per day, and disability was measured by using two variables; presence of disability diagnosis and the use of any assisting de- vices. We also used blood pressure (BP) information. As can be seen in Ta- ble 1, the variable of BP was measured by three categorical variables includ- ing normal, pre‐hypertension, and 1st or 2nd degree hypertension [15].
Data Analysis
Multiple linear regression analysis was conducted to assess the mod- els of subjective perception of health, and a logit model was used to esti- mate the odds for the binary variable for the level of healthcare service utilization. To examine how the predisposing, enabling, and need fac- tors are related to outcome variables, we used stepwise regression. The binary relationship between study variables and the main outcome vari- ables (subjective perception of health and healthcare utilization) were examined with ANOVA, t‐test, and Chi‐squared test. For each type of model, sets of predictors were entered in the following order: predispos- ing factors, enabling factors, and health needs.
RESULTS
The means, or percentages, and standard deviations for the study
variables are presented in Table 1. Results of the chi‐squared test, t‐test, and ANOVA are presented in Table 2. The results of a multiple linear re- gression with explanatory variables are presented in Table 3. The results of logistic regression are shown in Table 4.
Across the 207 respondents, 132 (63.8%) were NHI beneficiaries, and 75 (36.2%) were Medicaid beneficiaries. NHI program beneficiaries re- ported significantly higher levels of perceived health status (6.27 vs. 5.40).
More than 90.0% of both Medicaid beneficiaries and NHI beneficiaries accessed healthcare services when they were sick. Physician clinics were the healthcare institution that respondents accessed most. While 96% of Medicaid beneficiaries would like to revisit health care facilities, only 83.3% of NHI beneficiaries responded that they wanted to revisit the health care facilities, which was significantly different (Table 1).
Among the predisposing factors, we found significant differences in age, education level, and marital status between the two groups. Medic- aid beneficiaries were older and overall less educated than NHI benefi- ciaries. More of the NHI beneficiaries were married (56.8% vs. 22.7%) (Table 1).
Regarding enabling factors, Medicaid beneficiaries (85.3%) were more likely to be unemployed than NHI beneficiaries (71.2%). 50.7% of Med- icaid beneficiaries were living alone while only 14.4% of the NHI benefi- ciaries lived alone. A lower proportion of Medicaid beneficiaries had rel- atives that they could contact at least once a month (80.0%) and ask for help (62.7%); NHI beneficiaries had a much higher level (93.2% and 79.6%, respectively), which was significant. In terms of having close friends, NHI beneficiaries reported a higher proportion of having close friends that they could ask for help and contact at least once a month.
Medicaid beneficiaries had a lower number of friends, but this difference was not significant (Table 1).
We found several significant differences in health needs between
Medicaid beneficiaries and NHI beneficiaries. Medicaid beneficiaries
were diagnosed with more chronic diseases than NHI beneficiaries ‐
21.3% of Medicaid beneficiaries reported having more than 3 chronic
diseases, compared to 12.9% for the NHI beneficiaries. There were no
significant differences between the types of beneficiaries regarding alco-
hol and smoking. On average, 31.4% reported drinking alcohol and
21.7% answered yes to smoking. 62.7% of Medicaid beneficiaries an-
swered that they did not work out, while 12.0% worked out 1 to 3 days
per week. This was compared to 47.7% of NHI program beneficiaries
who reporting not working out and 23.5% who worked out 1 to 3 days
per week although this relationship was not statistically significant. On average, 63.8% of respondents responded that they eat 3 times a day and there was no difference in dietary pattern between the two groups. A higher proportion of Medicaid beneficiaries had disabilities (13.3% vs 3.0%) and a higher proportion also used assisting devices (21.3% vs 9.1%).
This is an expected finding because disability status is an eligibility crite- rion for Medicaid. We did not find any differences in blood pressure
and hypertension between the two groups (Table 1).
Table 3 presents the models used to examine factors associated with health status. The model using all samples, including health needs, showed the greatest significant increase in R squared (from .16 to .28).
After including all factors in the model, we found that factors associated with health status were as follows; education, chronic disease diagnoses, exercise, and disability. Compared to those with a high school education
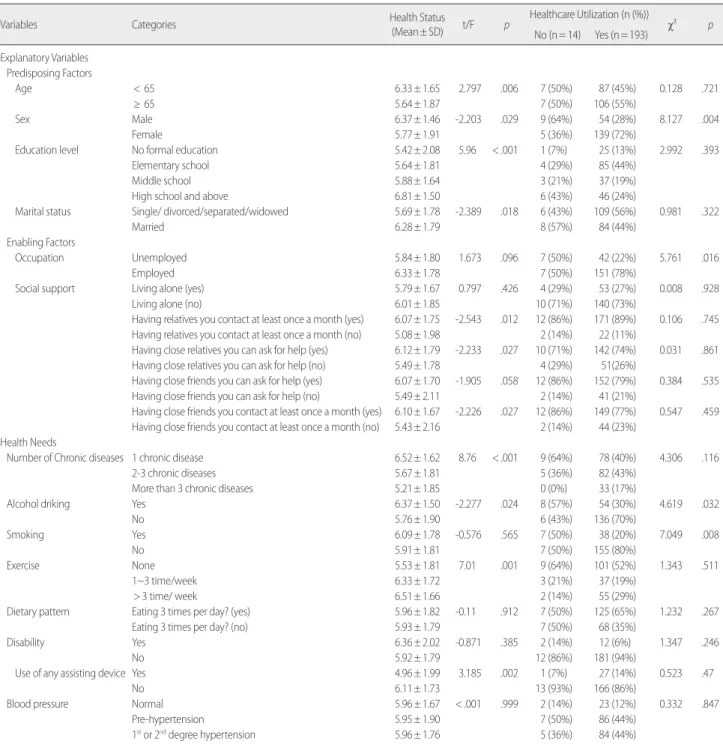
Table 2. Health Status and Healthcare Utilization by Explanatory Variables (N=207)
Variables Categories Health Status
(Mean± SD) t/F p Healthcare Utilization (n (%))
χ² p
No (n= 14) Yes (n= 193)
Explanatory Variables
Predisposing Factors
Age < 65 6.33± 1.65 2.797 .006 7 (50%) 87 (45%) 0.128 .721
≥ 65 5.64± 1.87 7 (50%) 106 (55%)
Sex Male 6.37± 1.46 -2.203 .029 9 (64%) 54 (28%) 8.127 .004
Female 5.77± 1.91 5 (36%) 139 (72%)
Education level No formal education 5.42± 2.08 5.96 < .001 1 (7%) 25 (13%) 2.992 .393
Elementary school 5.64± 1.81 4 (29%) 85 (44%)
Middle school 5.88± 1.64 3 (21%) 37 (19%)
High school and above 6.81± 1.50 6 (43%) 46 (24%)
Marital status Single/ divorced/separated/widowed 5.69± 1.78 -2.389 .018 6 (43%) 109 (56%) 0.981 .322
Married 6.28± 1.79 8 (57%) 84 (44%)
Enabling Factors
Occupation Unemployed 5.84± 1.80 1.673 .096 7 (50%) 42 (22%) 5.761 .016
Employed 6.33± 1.78 7 (50%) 151 (78%)
Social support Living alone (yes) 5.79± 1.67 0.797 .426 4 (29%) 53 (27%) 0.008 .928
Living alone (no) 6.01± 1.85 10 (71%) 140 (73%)
Having relatives you contact at least once a month (yes) 6.07± 1.75 -2.543 .012 12 (86%) 171 (89%) 0.106 .745
Having relatives you contact at least once a month (no) 5.08± 1.98 2 (14%) 22 (11%)
Having close relatives you can ask for help (yes) 6.12± 1.79 -2.233 .027 10 (71%) 142 (74%) 0.031 .861
Having close relatives you can ask for help (no) 5.49± 1.78 4 (29%) 51(26%)
Having close friends you can ask for help (yes) 6.07± 1.70 -1.905 .058 12 (86%) 152 (79%) 0.384 .535
Having close friends you can ask for help (no) 5.49± 2.11 2 (14%) 41 (21%)
Having close friends you contact at least once a month (yes) 6.10± 1.67 -2.226 .027 12 (86%) 149 (77%) 0.547 .459
Having close friends you contact at least once a month (no) 5.43± 2.16 2 (14%) 44 (23%)
Health Needs
Number of Chronic diseases 1 chronic disease 6.52± 1.62 8.76 < .001 9 (64%) 78 (40%) 4.306 .116
2-3 chronic diseases 5.67± 1.81 5 (36%) 82 (43%)
More than 3 chronic diseases 5.21± 1.85 0 (0%) 33 (17%)
Alcohol driking Yes 6.37± 1.50 -2.277 .024 8 (57%) 54 (30%) 4.619 .032
No 5.76± 1.90 6 (43%) 136 (70%)
Smoking Yes 6.09± 1.78 -0.576 .565 7 (50%) 38 (20%) 7.049 .008
No 5.91± 1.81 7 (50%) 155 (80%)
Exercise None 5.53± 1.81 7.01 .001 9 (64%) 101 (52%) 1.343 .511
1~3 time/week 6.33± 1.72 3 (21%) 37 (19%)
> 3 time/ week 6.51± 1.66 2 (14%) 55 (29%)
Dietary pattern Eating 3 times per day? (yes) 5.96± 1.82 -0.11 .912 7 (50%) 125 (65%) 1.232 .267
Eating 3 times per day? (no) 5.93± 1.79 7 (50%) 68 (35%)
Disability Yes 6.36± 2.02 -0.871 .385 2 (14%) 12 (6%) 1.347 .246
No 5.92± 1.79 12 (86%) 181 (94%)
Use of any assisting device Yes 4.96± 1.99 3.185 .002 1 (7%) 27 (14%) 0.523 .47
No 6.11± 1.73 13 (93%) 166 (86%)
Blood pressure Normal 5.96± 1.67 < .001 .999 2 (14%) 23 (12%) 0.332 .847
Pre-hypertension 5.95± 1.90 7 (50%) 86 (44%)
1st or 2nd degree hypertension 5.96± 1.76 5 (36%) 84 (44%)
or greater, respondents with elementary education reported lower levels of perceived health status (ß = ‐0.88, p =.004). On average, those with 2 to 3 chronic diseases (ß = ‐0.62, p =.019) or more than 3 chronic diseas-
es (ß = ‐0.94, p =.006) reported lower levels of perceived health status than those with one chronic disease, all other things being equal. Those who worked out more than 3 days per week reported higher levels of
Table 3. Factors Associated with Health Status Using Robust Standard Errors (OLS)Variables Health Status (Coef. (SE))
Total (n= 207) National Health Insurance (n= 132) Medicaid (n= 75)
Predisposing Factors
Age -.009
(.012) -.001
(.014) .010
(.013) .001
(.017) .009
(.021) .009
(0.019) -.006
(.021) -.014
(.020) -.003 (.023)
Sex (Ref: female) .196
(.236) .311
(.247) .211
(.306) -.089
(.291) -.156
(.299) -.244
(.397) .854
(.460) 1.095
(.499)* .907
(.451)*
Education level (Ref: high school and above)
No official education -1.082
(.482)* -.901
(.497) -.668
(.494) -1.352
(.629)* -1.604
(.631)* -1.149
(.663) -1.066 (.788) -.374
(.854) -.231
(.810)
Elementary school -1.033
(.289)** -.849
(.312)* -.878
(.300)** -.780
(.353)* -.952
(.395)* -.930
(.374)* -1.850
(.567)* -1.434
(.715)* -1.378 (.728)
Middle school -.806
(.329)* -.562
(.359) -.465
(.348) -.722
(.445) -.713
(.459) -.521
(.473) -1.016
(.569) -.767
(.709) -.488 (.768) Marital status (Ref: Single or divorced/separated/
widowed)
.440
(.241) .433
(.290) .311
(.284) .288
(.269) .090
(.340) -.013
(.340) .124
(.620) 1.195 (.601)* .914
(.653)
Enabling Factors
Insurances (Ref: Medicaid) .561
(.294) .528
(.284)
Unemployment -.058
(.317) -.007
(.327) -.498
(.389) -.361
(.448) .373
(.537) .190
(.592)
Social support
Living alone .339
(.350) .321
(.348) -.403
(.535) -.400
(.567) 1.058
(.450)* .916 (.480) Having relatives you contact at least once a month .695
(.459) .683
(.422) -.596
(.583) .213
(.607) .643
(.681) .622 (.623) Having close relatives you can ask for help .177
(.327) .069
(.318) .108
(.407) .239
(.435) .471
(.534) .266
(.518) Having close friends you can ask for help -.474
(1.298) -.976
(1.083) .792
(.531) .418
(.699) -1.532
(1.794) -1.515 (1.579) Having close friends you contact at least once a month .768
(1.262) .864
(1.028) -1.107
(.458)* -1.167
(.600) 2.385
(1.769) 2.170 (1.405)
Health Needs
Chronic diseases (Ref: 1 chronic disease)
2-3 chronic diseases -.624
(.264)* -.487
(.357) -.780
(.447)
More than 3 chronic diseases -.944
(.341)** -.538
(.466) -1.428
(.502)**
Alcohol drinking .264
(.281) .305
(.405) .121
(.609)
Smoking -.325
(.342) -.190
(.482) -.247
(.520)
Exercise (Ref: none)
1 to 3 days .504
(.316) .514
(.416) .437
(.494)
More than 3 days .907
(.251)** 1.060
(.344)** .739
(.416)
Dietary pattern (Re: irregular) .071
(.278) -.042
(.398) .344
(.437)
Disability
Having any disabilities 1.261
(.394)** 1.336
(.551)** .889
(.585)
Using any assisting devices -.741
(.382) -.780
(.529) -.571
(.600)
Blood pressure (Ref: 1st or 2nd degree hypertension)
Normal -.118
(.414) .243
(.571) -.002
(.864)
Pre-hypertension -.012
(.251) -.228
(.331) .494
(.380)
Constant 7.030
(.779)** 4.940
(1.171)** 4.684
(1.074)** 6.715
(.975)** 6.402
(1.464)** 6.878
(1.335)** 6.768
(1.610)** 4.476 (1.858)* 4.257
(1.793)*
R2 0.104** 0.162** 0.280** 0.072 0.102 0.226 0.183* 0.373** 0.509**
*p< .05; **p< .01; Coefficient (standard errors) presented.
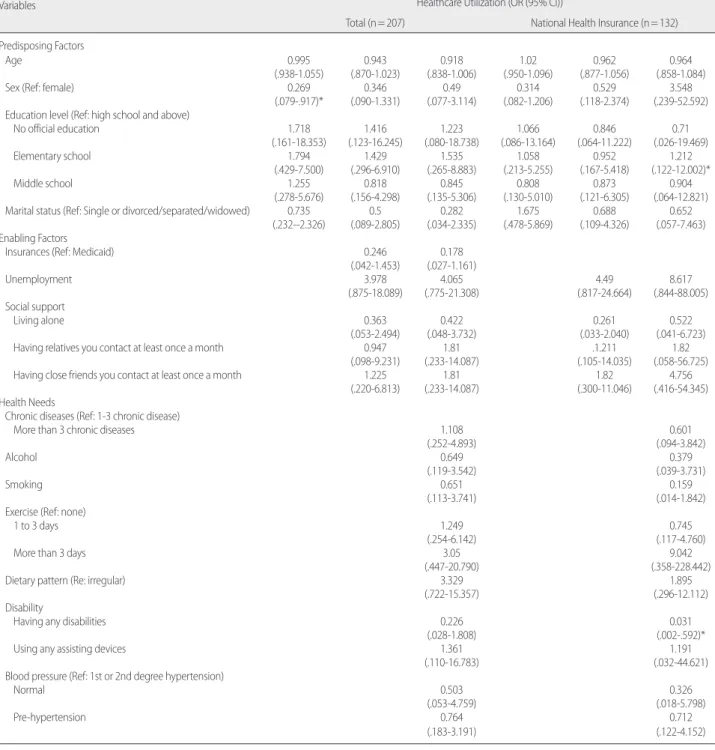
Table 4. Factors Associated with Healthcare Utilization (Logit model) Variables
Healthcare Utilization (OR (95% CI))
Total (n= 207) National Health Insurance (n= 132)
Predisposing Factors
Age 0.995 0.943 0.918 1.02 0.962 0.964
(.938-1.055) (.870-1.023) (.838-1.006) (.950-1.096) (.877-1.056) (.858-1.084)
Sex (Ref: female) 0.269 0.346 0.49 0.314 0.529 3.548
(.079-.917)* (.090-1.331) (.077-3.114) (.082-1.206) (.118-2.374) (.239-52.592)
Education level (Ref: high school and above)
No official education 1.718 1.416 1.223 1.066 0.846 0.71
(.161-18.353) (.123-16.245) (.080-18.738) (.086-13.164) (.064-11.222) (.026-19.469)
Elementary school 1.794 1.429 1.535 1.058 0.952 1.212
(.429-7.500) (.296-6.910) (.265-8.883) (.213-5.255) (.167-5.418) (.122-12.002)*
Middle school 1.255 0.818 0.845 0.808 0.873 0.904
(.278-5.676) (.156-4.298) (.135-5.306) (.130-5.010) (.121-6.305) (.064-12.821)
Marital status (Ref: Single or divorced/separated/widowed) 0.735 0.5 0.282 1.675 0.688 0.652
(.232--2.326) (.089-2.805) (.034-2.335) (.478-5.869) (.109-4.326) (.057-7.463)
Enabling Factors
Insurances (Ref: Medicaid) 0.246 0.178
(.042-1.453) (.027-1.161)
Unemployment 3.978 4.065 4.49 8.617
(.875-18.089) (.775-21.308) (.817-24.664) (.844-88.005)
Social support
Living alone 0.363 0.422 0.261 0.522
(.053-2.494) (.048-3.732) (.033-2.040) (.041-6.723)
Having relatives you contact at least once a month 0.947 1.81 .1.211 1.82
(.098-9.231) (.233-14.087) (.105-14.035) (.058-56.725)
Having close friends you contact at least once a month 1.225 1.81 1.82 4.756
(.220-6.813) (.233-14.087) (.300-11.046) (.416-54.345)
Health Needs
Chronic diseases (Ref: 1-3 chronic disease)
More than 3 chronic diseases 1.108 0.601
(.252-4.893) (.094-3.842)
Alcohol 0.649 0.379
(.119-3.542) (.039-3.731)
Smoking 0.651 0.159
(.113-3.741) (.014-1.842)
Exercise (Ref: none)
1 to 3 days 1.249 0.745
(.254-6.142) (.117-4.760)
More than 3 days 3.05 9.042
(.447-20.790) (.358-228.442)
Dietary pattern (Re: irregular) 3.329 1.895
(.722-15.357) (.296-12.112)
Disability
Having any disabilities 0.226 0.031
(.028-1.808) (.002-.592)*
Using any assisting devices 1.361 1.191
(.110-16.783) (.032-44.621)
Blood pressure (Ref: 1st or 2nd degree hypertension)
Normal 0.503 0.326
(.053-4.759) (.018-5.798)
Pre-hypertension 0.764 0.712
(.183-3.191) (.122-4.152)
*p< .05; **p< .01; Odds ratio (95% confidence interval) presented Because of perfect predictors, Medicaid models could not analyzed.
health status than those who did not work out (ß = ‐0.91, p =.001). In- terestingly, respondents who had any disability had higher levels of per- ceived health status than those who did not have disabilities (ß = 1.26, p
=.002). The model of health status using NHI beneficiaries have several factors related to health status including having elementary education (ß
=‐.93, p =.014), exercising more than 3 days a week (ß =1.06, p =.003),
and having disability (ß =1.34, p =.017). In the model using Medicaid
beneficiaries, factors associated with health status were as follows; sex
and chronic diseases. In this model, male beneficiaries reported higher
levels of health status than females (ß = 0.91, p =.049). As expected,
those who had more than 3 chronic diseases reported lower levels of health status than those who did not have any (ß =‐1.43, p =.006).
Table 4 presents the results of logistic regression analysis for health- care utilization. In the model using all samples, after including all factors in the model, we did not find any factors significantly related to health- care utilization. The model of healthcare utilization using the National Health Insurance program indicated that the likelihood of healthcare utilization was higher for those with elementary school education and lower among those with any disabilities.
DISCUSSION
Although the Medicaid program provides medical assistance for the low income population, there are challenges and barriers to accessing care. This study examined potential barriers to accessing healthcare ser- vices, and compared Medicaid beneficiaries with NHI beneficiaries us- ing a sample from all residents of the housing complex categorized un- der the low income population. Using a cross sectional design, this study found that Medicaid beneficiaries reported lower levels of perceived health status than NHI beneficiaries (Table 1). However, when we con- trolled all other factors, we did not find this difference in health status between Medicaid and NHI beneficiaries (Table 3). Medicaid beneficia- ries had lower resources and higher levels of health needs than NHI beneficiaries.
One important finding is that Medicaid beneficiaries had lower levels of enabling factors: more likely to live alone, not married, and not having relatives to ask for help. In order to access healthcare, it is important to not only have healthcare services and facilities, but also social support which can help with access to care [16]. Also Medicaid beneficiaries re- ported significantly higher levels of health needs, including chronic dis- eases and disabilities. Medicaid beneficiaries had less social support and higher health needs than NHI beneficiaries. Similarly, they reported lower levels of health status and male patients reported higher levels of health status than female Medicaid beneficiaries. This result was consis- tent with Lee and Kim’s research [5]. Additionally, more than 3 chronic disease factors influenced health status. This result was consistent with Knesebeck et al.’s research [17]. Because Medicaid beneficiaries do not need to pay out of pocket to utilize healthcare service, they had equal or better levels of healthcare utilization including having healthcare facili- ties and revisiting healthcare services. This result was consistent with
Lee and Kim’s research [5]. These results are valuable because they pro- vide information on the trends of health status, and healthcare utiliza- tion when compared with recent and future research results.
One practical implication of this finding is that providing healthcare service assistance to Medicaid beneficiaries might not be enough to im- prove their health status. Medicaid beneficiaries indicated a weak social support network. The new system of Medicaid now supports a health maintenance fund to beneficiaries of about $70 per month, in addition to the healthcare services [4]. Although this can help the utilization of care for Medicaid beneficiaries, they need social support to access this care such as transportation and other people for advice and support.
Therefore, the new Medicaid system might need to consider including a social support system to increase access to care.
Another practical implication is related to health maintenance activi- ty for Medicaid beneficiaries. Compared to NHI beneficiaries, Medicaid beneficiaries reported lower levels of health maintenance activities such as exercise and dietary pattern. In addition to the healthcare services that Medicaid beneficiaries currently receive, health maintenance activi- ties can be provided by community health centers to improve the health status of Medicaid beneficiaries. When we consider that Medicaid bene- ficiaries had lower levels of social support and higher levels of health needs, such health maintenance activities might be a tool to provide health services to prevent diseases and promote the health status of Medicaid beneficiaries.
Much like other studies, this study has limitations, which are related to using a cross‐sectional study design with a local population to access data. In order to compare Medicaid and NHI beneficiaries, we used data from a low income population residing in a special government‐housing complex. Although differences in health needs and social support be- tween Medicaid and NHI beneficiaries were examined, this sample can- not represent all Medicaid and NHI beneficiaries, nor can the findings be applied to other populations. Furthermore, the relationships we found cannot be interpreted as a causal relationship. Therefore, future research needs to use a larger population and longitudinal data to exam- ine factors related to health status and health care utilization. Addition- ally, another limitation of this study is related to healthcare utilization variables. Because secondary data analysis was used, this study could not introduce more detailed variables to examine health service utilization.
The variables we used in this study were simple and cannot completely
capture health service utilization among Medicaid and NHI beneficia-
ries. Thus, future studies need to include quantitative data to measure health service utilization.
Currently, the new Medicaid policy includes a health care mainte- nance fund for beneficiaries, and is working to strengthen the evaluation system of Medicaid to screen for wasted healthcare resources. Therefore, further research needs to examine whether such policy changes will lead to better health status and a decrease in health care utilization by Medic- aid beneficiaries, without creating other barriers to access healthcare services. Continued efforts to increase access to care for Medicaid bene- ficiaries need to be a focus of the current Medicaid system, and research- ers need to continue to study policy changes and their impact on access to care by Medicaid beneficiaries.
CONCLUSIONS
This study found that compared to National Health Insurance bene- ficiaries, Medicaid beneficiaries reported lower levels of health status and fewer enabling factors. They also had more chronic diseases and disabilities. Health status was associated with education level, chronic disease, exercise pattern, and disability. We found that Medicaid benefi- ciaries had fewer resources and higher levels of health needs. As the new Medicaid policy includes a health care maintenance fund for Medicaid beneficiaries to strengthen the evaluation system of Medicaid to screen for wasted healthcare resources, it is important to understand the healthcare utilization behaviors of Medicaid beneficiaries and factors hindering their access to care.
REFERENCES
1. Tran BX, Nguyen LH, Nong VM, Nguyen CT. Health status and health service utilization in remote and mountainous areas in Vietnam. Health Qual Life Outcomes. 2016;14(85):1-9. http://dx.doi.org/10.1186/s12955‐016‐0485‐8 2. Rohrer JE, Arif A, Denison AD, Young R, Adamson S. Overall self‐rated health
as an outcome indicator in primary care. Journal of Evaluation in Clinical Prac- tice. 2007;13(6):882‐888. http://dx.doi.org/10.1111/j.1365-2753.2006.00766.x 3. Institute of Korea National Health Insurance Service. Annual statistical review.
Wonju, 2012. Cited by Shim, S. Impact of policy change in the coverage for lower‐income group from Medicaid to national health insurance: an interrupt- ed time series analysis [master’s thesis]. Seoul: Yonsei University; 2016. p1-50.
4. Choi KC, Bae SI, Kim KH, & Lee DH. 2007 Medicaid innovation, analysis, and viewpoints. Final Report. Wonju: Korea National Health Insurance Corpora- tion; 2008 Dec. Report No.:2008-25.
5. Lee HO, Kim K. Health care utilization and health related quality of life between the insured in national health insurance and the recipients in medical aid pro- gram. Korean Journal of Social Welfare Research. 2015;44:187‐210. http://
dx.doi.org/10.17997/SWRY.44.1.8
6. Lee IS, Kim SW. The factors influencing behavior of health care of Medicaid re- cipients. Yonsei Social Welfare Review. 2004;11:66‐99.
7. Feldstein PJ. Health Care Economics. 4th ed. New York: Delmar Publishing;
1993. p. 1-125.
8. Lee H, Lim J-Y. The effects of introduction of co-payment system on the Medi- cal Aid beneficiaries’healthcare usage in Korea. Korean Journal of Health Eco- nomics and Policy. 2013;19(3):23-49.
9. Hong SW. The effects of copayments on health services utilization in the type I Medicaid beneficiaries. Journal of Korean Academy of Nursing Administra- tion. 2009;15:136‐146.
10. Shim, S. Impact of policy change in the coverage for lower‐income group from Medicaid to national health insurance: an interrupted time series analysis [mas- ter’s thesis]. Seoul: Yonsei University; 2016. p1-50.
11. Cho K-H. Health service utilization patterns among the chronically disabled aged in Korea. Journal of Korean Geriatrics Society. 1997;1(1):55-64.
12. Anderson RM. Revisiting the behavioral model and access to medical care:
Does it matter? Journal of Health and Social Behavior. 1995;36(1):1‐10.
13. Lee TW, Ko IS, Lee KJ, Kang KH. Health status, health perception, and health promotion behaviors of low‐income community dwelling elderly. Journal of Korean Academy of Nursing. 2005;35(2):252‐261.
14. Lee YI. Survey proposal: A study of healthcare needs analysis to increase access to care in a low‐income population. Seoul: Gangbukgu Public Health Center;
2005 Dec. Report No.: 1.
15. Chobanian AV, Barkris GL, Black HR, et al. Seventh report of the Joint National Committee on prevention, detection, evaluation, and treatment of high blood pressure: the JNC 7 report. Journal of American Medical Association. 2003;
289(19):2590-72.
16. Gong CH, Kendig H., He X. Factors predicting health services use among older people in China: An analysis of the Chia health and retirement longitudinal study 2013. BMC Health Services Research. 2016;18:16‐63. doi: 10.1186/
s12913‐016‐1307‐8.
17. von dem Knesebeck O. et al. Social inequalities in patient‐reported outcomes among older multimorbid patients‐results of the MultiCare cohort study. Inter- national Journal for Equity in Health. 2015;14:17. http://dx.doi.org/10.1186/
s12939‐015‐0142‐6.