Clin Nutr Res 2013;2:81-90
http://dx.doi.org/10.7762/cnr.2013.2.2.81 pISSN 2287-3732 ∙ eISSN 2287-3740
© 2013 The Korean Society of Clinical Nutrition
Introduction
Meeting the basic nutritional requirements of the mother while maintaining proper storage of nutrients is essential for the proper development of the fetus within the maternal body [1]. As such, appropriate nutritional management of pregnant women is very important for the growth of the fetus. Rec- ommended macronutrient and micronutrient intake levels for pregnant women are similar to those for healthy non- pregnant women with the exception of those for several vita- mins and minerals, including folic acid, iron, and vitamin D, for
This is an Open Access article distributed under the terms of the Creative Commons Attribution Non-Commercial License (http://creativecommons.org/licenses/by-nc/3.0/) which permits unrestricted non-commercial use, distribution, and reproduction in any medium, provided the original work is properly cited.
*Corresponding author Jin-Hee Lee
Address The Catholic Institute of Ubiquitous Health Care, The Cath- olic University of Korea, 222 Banpo-daero, Seocho-gu, Seoul 137- 701, Korea Tel +82-2-2258-8298 Fax +82-2-2258-8297 E-mail [email protected]
Received June 3, 2013 Revised July 5, 2013 Accepted July 8, 2013
*Corresponding author Kun-Ho Yoon
Address Department of Endocrinology and Metabolism, College of Medicine, The Catholic University of Korea, 222 Banpo-daero, Seocho-gu, Seoul 137-701, Korea Tel +82-2-2258-6007
Fax +82-2-2258-8297 E-mail [email protected]
Nutritional Intake of Pregnant Women with Gestational Diabetes or Type 2 Diabetes Mellitus
Sun-Young Lim
1, Hyun-Jung Yoo
1, Ae-Lan Kim
1, Jeong-Ah Oh
1, Hun-Sung Kim
1,2, Yoon-Hee Choi
1,2, Jae-Hyoung Cho
1,2, Jin-Hee Lee
1*, Kun-Ho Yoon
1,2*1The Catholic Institute of Ubiquitous Health Care, The Catholic University of Korea, Seoul 137-701, Korea
2Department of Endocrinology and Metabolism, College of Medicine, The Catholic University of Korea, Seoul 137-701, Korea
Adequate intake of nutrients by pregnant women diagnosed with gestational diabetes mellitus (GDM) or type 2 diabetes (T2DM) is very important for appropriate weight gain and maintenance of normoglycemia without ketonuria. The aim of this study was to investigate the nutritional intake of pregnant women with GDM or T2DM who had not been provided with nutritional educa- tion regarding blood glucose management. Between June 2008 and May 2010, 125 pregnant women who had been diagnosed with GDM or T2DM and had not received any nutrition education regarding glycemic control and proper diet during pregnancy were interviewed to collect data regarding background characteristics, health-related behaviors, and course of pregnancy and instructed to record their dietary intake using a 24-hour recall method for one day. Using the collected data, the index of nutri- tional quality, nutrient adequacy ratio, and mean adequacy ratio values of the subjects were calculated. Analysis of the values indicated that the majority of the subjects did not meet recommended intake levels for most micronutrients and consumed an undesirable ratio of macronutrients, specifically a higher percentage of total carbohydrates than the current recommendation level. The GDM and T2DM groups obtained 56.6% and 63.6%, respectively (p = 0.012), of their calories by carbohydrate intake, which exceeded the recommended levels (125.8% in GDM groups, 141.3% in T2DM groups).
Key Words: Nutrient intake, Gestational diabetes mellitus, Type 2 diabetes mellitus
which, in addition to calories, recommended levels are higher.
Inadequate caloric and nutrient intake during pregnancy may lead to anemia, toxemia, and a variety of obstetric complica- tions for the mother, as well as immaturity and neonatal death of the fetus [2,3]. For this reason, particular emphasis is paid on the importance of maintaining a healthy and balanced diet during pregnancy.
Maintaining proper nutrition during pregnancy becomes even more significant when the pregnant women have diabe- tes. Pregnant women who have been diagnosed with type 2 diabetes mellitus (T2DM) pregestation or who develop gesta- tional diabetes mellitus (GDM) during gestation face increased risk of perinatal complications, including macrosomia, shoulder dystocia, birth injuries, hypoglycemia, and hyperbilirubinemia [4,5]. For these women, proper dietary intake is important for not only providing nutrients for maternal health and fetal growth but also maintaining proper blood glucose and ideal weight gain without ketonenemia [5-8]. The dietary plan for a woman with GDM should be based on the aim of maternal blood glucose control and consideration of the physiological effects that may occur during pregnancy [6]. As exposure to hyperglycemia in early pregnancy increases the risk of fetal complications [9,10], maintaining proper blood glucose control throughout early pregnancy by nutritional management is es- pecially important.
In South Korea, guidance and recommendations regarding clinical nutrition therapy is provided to pregnant women with GDM or T2DM by Korean Diabetes Association and Korean Di- etetic Association [11,12]. Nevertheless, few practical national guidelines or educational programs regarding proper nutrition during pregnancy have been developed, and limited research has been conducted into the nutritional intake of women with GDM, leading to lack of understanding of actual nutritional intake. Although several studies have examined the nutrient intake and eating habits of women with GDM [13,14], these studies began collecting data before the pregnant subjects had been diagnosed with GDM, as their study goal had been evaluation of the association between nutrient intake or eating habits and risk of GDM. Thus, the present study aimed to in- vestigate the calorie, macronutrient, and micronutrient intake of pregnant women who have been diagnosed with GDM or T2DM but have received no education from health care practi- tioners regarding proper dietary intakes during pregnancy. This study could serve as the basis for a proposal to develop nu- tritional education programs for prevention of the nutrition-
related problems that pregnant women with GDM and T2DM are likely to face during the course of pregnancy.
Materials and Methods
Subject selection
The study subjects were selected from pregnant women who were receiving prenatal care at the department of obstet- rics and gynecology of a university hospital or a secondary hospital in Seoul, Korea, between June 2008 and May 2010.
Those who had been diagnosed with T2DM before pregnancy or had been diagnosed with GDM during pregnancy were asked for the study participation. Diagnosis of GDM had been performed after the completion of two forms of screening and diagnostic testing [15]. Initial screening was performed by measuring the plasma glucose concentration 1-hour after a 50-g oral glucose tolerance test (OGTT). Those with higher values than 140 mg/dL in screening test were considered ab- normal and received 100-g OGTT to diagnose of GDM. The criteria of diagnostic OGTT by Americal Diabetes Association is as follows: fasting 95 mg/dL, 1-hour 180 mg/dL, 2-hour 155 mg/dL and 3-hour 140 mg/dL. We identified the women who had two or more the plasma concentrations met or exceeded to the thresholds as GDM. In addition to the inclusion criteria of current pregnancy and diagnosis of GDM or T2DM, all sub- jects met the inclusion criteria of having knowledge of their diabetic status, not having received any nutrition education regarding glycemic control and proper diet during pregnancy, and being solely responsible for their dietary intake. Of the 132 potential subjects, 7 were excluded because they met one of the exclusion criteria of carrying multiple fetuses and consum- ing either fewer than 500 kcal/day or more than 4,000 kcal/
day. This study was approved by the Seoul St. Mary’s Hospital Institutional Review Board (KC10RIMI0190).
Collection of general and clinical data
Data regarding the subjects’ background characteristics, personal and family medical history, lifestyle habits and behaviors, and course of pregnancy were collected by expe- rienced research nurses via face-to-face interviews. The col- lected data included age, occupation, education, physical ac- tivity level, alcohol consumption, smoking status, risk factors associated with GDM (history of GDM, macrosomia, polycystic ovary syndrome, and impaired glucose tolerance), and treat- ment and family history of diabetes. The subjects’ height and
weight were measured for pre-pregnancy body mass index (BMI) calculated as kg/m2. Appropriate weight gain by gesta- tional age, with the first period ranging from week 0 to week 14, the second period from week 14 to week 28, and the third period from week 28 to birth, on the basis of weight status before pregnancy [16], was determined.
Dietary assessment
Dietary intake data were collected by trained nutritionists using a 24-hour recall method for one day. To ensure that the subjects accurately reported their dietary intake, trained nutri- tionists instructed them in the use of the 24-hour dietary re- call method using aids, such as food models and photographs, to improve accuracy. The nutritionists also asked the subjects whether the meals that they recorded by the 24-hour recall method were similar to the meals that they had eaten after being diagnosed of GDM. Intake of nutritional supplements was not recorded or included in the analysis. The CAN Pro 3.0 (Korean Nutrition Society, Seoul, Korea) was used to analyze nutrient intake of the study subjects.
The regularity of intake and distribution of caloric and car- bohydrate intake among meals and snacks throughout the day were determined. Individual caloric recommendations were calculated in consideration of pre-pregnancy weight status (underweight, normal, overweight, or obese) and amount of weight gain during pregnancy (within normal range or exces- sive) [11]. Nutrient intake recommendations were determined according to the recommended nutrient intake (RNI) of Ko- rean Dietary Reference Intakes (KDRIs) for pregnant women [17]. The appropriate carbohydrate:protein:fat ratio was set at 45:20:35 [11] of caloric intake according to the education guide for diabetes of Korean Diabetes Association and compared with the actual ratio of the subjects. Qualitative measurement of nutrient intake was performed by determination of the nu- trient adequacy ratio (NAR), the mean adequacy ratio (MAR), and the index of nutritional quality (INQ).
NAR = nutrient intake of an individual / RNI of the nutrient MAR = sum of the NAR for each nutrient / number of nutrients INQ = amount of nutrients in 1,000 kcal / RNI in 1,000 kcal
Statistical analysis
The collected data were analyzed using the Statistical Analysis System ver. 9.1 (SAS Institute, Cary, NC, USA). Sub- jects were divided into a group that had been diagnosed with GDM during pregnancy and a group that had been diagnosed
with T2DM before pregnancy. The results were expressed as mean, standard deviation, frequency, and the percentage values. Baseline characteristics and nutrient intakes were first assessed for normality and then compared between groups using the Fisher’s exact test or Wilcoxon rank-sum test of in- dependence.
Results
General characteristics of study subjects
Table 1 shows the general characteristics of the study sub- jects according to diabetic status. As can be observed, the mean age and gestational week were 32.9 years and 26.2 weeks for the GDM group and 31.6 years and 11.2 weeks for the T2DM group. The pregestation BMI of the GDM and T2DM groups was 23.3 and 25.7 kg/m2, respectively, and the per- centage of subjects with weight gain above the recommended level during pregnancy was 21.6% and 42.9%, respectively.
Regularity of meal and snack consumption
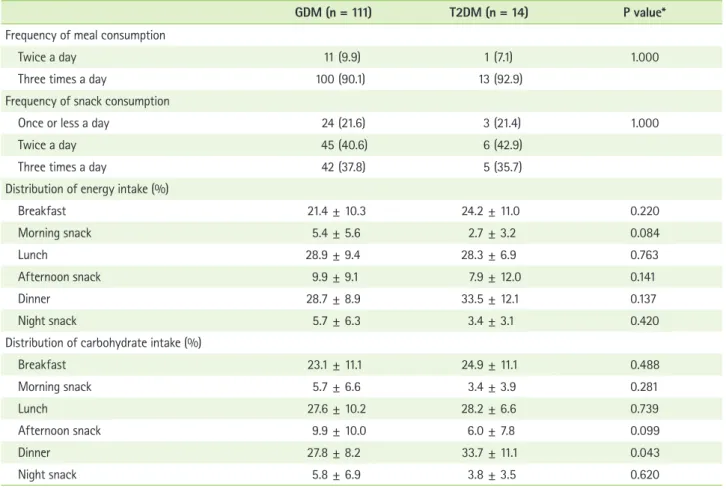
Table 2 shows the regularity of the meal and snack con- sumption of the subjects. More than 90% of all subjects consumed 3 meals a day, and approximately 35% consumed 3 snacks a day (one each in the morning, afternoon, and eve- ning). The percentage of total calories consumed at breakfast, morning snack, lunch, lunch snack, supper, and evening snack was 21.4%, 5.4%, 28.9%, 9.9%, 28.7%, and 5.7%, respectively, for the GDM group and 24.2%, 2.7%, 28.3%, 7.9%, 33.5%, and 3.4%, respectively, for the T2DM group. Both groups consumed a relatively high percentage of carbohydrates at breakfast (GDM and T2DM, 23.1% and 24.9%, respectively), and a relatively low percentage at snacks. Women with GDM had lower proportion of carbohydrate intake at dinner than did women with T2DM (27.8 ± 8.2 vs. 33.7 ± 11.1, p = 0.043).
Assessment of micronutrient intake levels
Table 3 shows the subjects’ actual caloric and nutrient in- take levels compared with the recommended levels. Caloric intake of the GDM and T2DM groups was 1,596.6 kcal, 86.1%
of the recommended level, and 1,408.2 kcal, 91.4% of the rec- ommended level, respectively. Women with GDM had higher intakes of protein (p = 0.043), fat (p = 0.005), calcium (p = 0.0.019), zinc (p = 0.009), vitamin B1 (p = 0.0.008) and vitamin B2 (p = 0.001) than did women with T2DM. While the vitamin A and C, sodium intake of both groups exceeded recommended
Table 1. General characteristics of the subjects according to the type of diabetes
GDM (n = 111) T2DM (n = 14) P value*
Age, years 32.9 ± 3.6 31.6 ± 3.8 0.097
Gestational age at admission, weeks 26.2 ± 6.9 11.2 ± 7.2 < 0.001
Height, cm 160.6 ± 4.7 161.5 ± 3.4 0.537
Assessment of weight gain at admission
Under weight gain 11 (9.9) 1 (7.1) 0.182
Appropriate weight gain 76 (68.5) 7 (50.0)
Over weight gain 24 (21.6) 6 (42.9)
Pre-pregnancy weight, kg 60.3 ± 12.8 67.1 ± 13.9 0.485
Pre-pregnancy BMI, kg/m2 23.3 ± 4.7 25.7 ± 5.4 0.102
Therapy using Insulin
Yes 71 (64.0) 13 (92.9) 0.133
Family history of DM
Yes 38 (34.2) 7 (50.0) 0.254
Conditions increasing risk of DM†
Yes 19 (17.1) 8 (57.1) 0.002
Alcohol consumption status
Ever 32 (28.8) 6 (42.9) 0.355
Never 79 (71.2) 8 (57.1)
Smoking status
Ever 14 (12.6) 2 (14.3) 1.000
Never 97 (87.4) 12 (85.7)
Physical activity status
Light 100 (90.1) 11 (78.6) 0.364
Regular 10 (9.0) 3 (21.4)
Heavy 1 (0.9) 0 (0.0)
Job
Housewife 65 (63.1) 9 (64.3) 0.025
Public servant / Specialized job 31 (30.1) 1 (7.1)
Administrator 5 (4.9) 1 (7.1)
Service / Sales woman 2 (1.9) 3 (21.4)
No answer 8
Education level
High school 18 (16.2) 8 (57.1) 0.011
College 19 (17.1) 1 (7.1)
University or more 74 (66.7) 5 (35.7)
Parity
0 50 (45.1) 4 (28.6) 0.181
1 24 (21.6) 3 (21.4)
2 23 (20.7) 2 (14.3)
≥3 14 (12.6) 5 (35.7)
levels, the calcium, iron, zinc, niacin, vitamins B1, vitamin B2, vitamin B6, and folic acid intake of both groups was less than the recommended levels. A particularly notable finding was that iron and folic acid intake was less than 60% of the RNI.
Assessment of macronutrient intake levels
Figure 1 shows the percentage of calories from carbohy- drate, protein, and fat intake. The GDM and T2DM groups obtained 56.6% and 63.6%, respectively (p = 0.012), of their calories by carbohydrate intake, which exceeded (125.8% and Table 1. Continued
GDM (n = 111) T2DM (n = 14) P value*
Supplements use
Yes 98 (96.1) 11 (84.6) 0.136
No answer 9 1
Type of medical institution
Secondary 91 (82.0) 11 (78.6) 0.721
Tertiary 20 (18.0) 3 (21.4)
Values are presented as mean ± SD or n (column %).
BMI: body mass index, GDM: gestational diabetes mellitus, T2DM: type 2 diabetes mellitus.
*Continuous variables: based on Wilcoxon rank-sum test, Categorical variables: based on Fisher’s exact test; †Previous history of gestational diabetes or macro- somic baby, polycystic ovary syndrome, and impaired glucose tolerance.
Table 2. Meal regularity of the subjects
GDM (n = 111) T2DM (n = 14) P value*
Frequency of meal consumption
Twice a day 11 (9.9) 1 (7.1) 1.000
Three times a day 100 (90.1) 13 (92.9)
Frequency of snack consumption
Once or less a day 24 (21.6) 3 (21.4) 1.000
Twice a day 45 (40.6) 6 (42.9)
Three times a day 42 (37.8) 5 (35.7)
Distribution of energy intake (%)
Breakfast 21.4 ± 10.3 24.2 ± 11.0 0.220
Morning snack 5.4 ± 5.6 2.7 ± 3.2 0.084
Lunch 28.9 ± 9.4 28.3 ± 6.9 0.763
Afternoon snack 9.9 ± 9.1 7.9 ± 12.0 0.141
Dinner 28.7 ± 8.9 33.5 ± 12.1 0.137
Night snack 5.7 ± 6.3 3.4 ± 3.1 0.420
Distribution of carbohydrate intake (%)
Breakfast 23.1 ± 11.1 24.9 ± 11.1 0.488
Morning snack 5.7 ± 6.6 3.4 ± 3.9 0.281
Lunch 27.6 ± 10.2 28.2 ± 6.6 0.739
Afternoon snack 9.9 ± 10.0 6.0 ± 7.8 0.099
Dinner 27.8 ± 8.2 33.7 ± 11.1 0.043
Night snack 5.8 ± 6.9 3.8 ± 3.5 0.620
Values are presented as mean ± SD or n(column %).
*Categorical variables: based on Fisher’s exact test, Continuous variables: based on Wilcoxon rank-sum test.
141.3%, respectively) the recommended levels. In contrast, the GDM and T2DM groups obtained 17.4% and 16.6%, re- spectively, of their calories by protein intake, which were lower
(87.0% and 83.0%, respectively) than the recommended levels.
Interestingly, the GDM and T2DM groups obtained only 26.0%
and 19.7%, respectively, of their calories by fat intake, which were far less than the recommended intake of 35%, and this trend was more pronounced in T2DM women (p = 0.006).
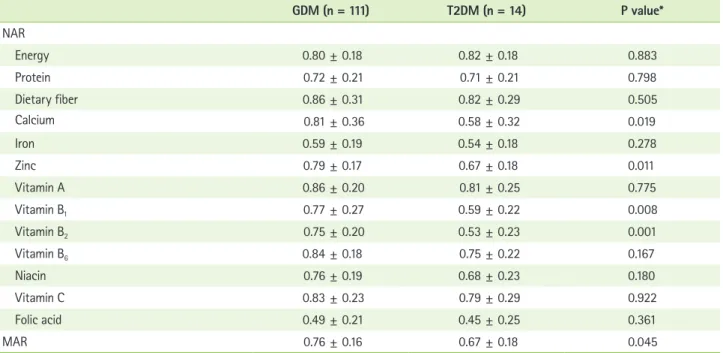
Assessment of micronutrient intake levels
Table 4 shows the NAR and MAR values and Table 5 shows the INQ values for the GDM and T2DM groups. The NAR val- ues, indicators of the ratio of nutrient intake levels compared to the recommended levels, for all nutrients and calories for both groups were below 1, as were the MAR values (GDM group, 0.73 and T2DM group, 0.65, p = 0.045). The INQ values of the GDM group were greater than 1 for dietary fiber, zinc, vitamin A, vitamin B6, and vitamin C, but were less than 1 for the remaining 7 nutrients, indicating intake values lower than recommended levels despite adequate caloric intake. None of the INQ values of the T2DM group exceeded 1 except those for vitamin A and vitamin C, indicating adequate intake of only these 2 nutrients. The INQ values of calcium (p = 0.007), zinc (p = 0.003), vitamin B1 (p < 0.001), vitamin B2 (p < 0.001), and Table 3. Nutrient intake status of the subjects
GDM (n = 111) T2DM (n = 14) P value*
Energy, kcal 1596.6 ± 422.3 (86.1†) 1408.2 ± 370.8 (91.4) 0 . 111
Carbohydrate, g 224.3 ± 63.9 223.9 ± 68.4 0 . 946
Protein, g 69.5 ± 21.5 58.6 ± 19.1 0 . 043
Fat, g 46.8 ± 20.0 30.9 ± 14.0 0 . 005
Dietary fiber, g 21.6 ± 7.8 (86.3) 20.5 ± 7.3 (82.1) 0 . 505
Calcium, mg 752.2 ± 338.5 (80.9) 541.6 ± 302.2 (58.2) 0 . 019
Iron, mg 14.2 ± 4.9 (59.1) 13.3 ± 5.2 (55.2) 0 . 278
Sodium, mg 3930.0 ± 1694.0 (163.8) 4471.8 ± 1856.5 (186.3) 0 . 329
Potassium, mg 2891.0 ± 969.5 (82.6) 2716.7 ± 1296.2 (77.6) 0 . 234
Zinc, mg 9.7 ± 8.5 (92.5) 7.3 ± 2.7 (69.7) 0 . 009
Vitamin A, μg RE 1035.3 ± 907.0 (143.8) 775.8 ± 421.7 (107.8) 0 . 374
Vitamin B1, mg 1.2 ± 0.4 (77.1) 0.9 ± 0.3 (59.1) 0 . 008
Vitamin B2, mg 1.3 ± 0.5 (80.6) 0.9 ± 0.4 (54.3) 0 . 001
Vitamin B6, mg 2.1 ± 0.7 (94.0) 1.7 ± 0.6 (76.8) 0 . 073
Niacin, mg 14.4 ± 4.9 (80.3) 12.8 ± 5.2 (70.9) 0 . 174
Vitamin C, mg 135.6 ± 91.6 (123.2) 118.1 ± 71.4 (107.3) 0 . 619
Folic acid, μg 299.3 ± 144.2 (49.9) 272.4 ± 147.4 (45.5) 0 . 363
Cholesterol, mg 306.8 ± 222.6 (102.3) 183.5 ± 122.5 (61.2) 0 . 047
Values are presented as mean ± SD; The values of nutrients intake were estimated by a one-day 24-hr recall method.
*Based on Wilcoxon rank-sum test; †Intake level compared with recommended intake in pregnant women(%).
Reference 100
80 60 40 20 0 (%)
GDM T2DM
Fat Protein Carbohydrate
Figure 1. Macronutrients intake as percentages of total energy compared with recommended criteria in the subjects.
vitamin B6 (p = 0.010) was higher in the GDM groups.
Discussion
The present study aimed to investigate the caloric, macro- nutrient, and micronutrient intake levels of pregnant women with GDM or T2DM who had not received dietary advice
regarding proper meal planning during pregnancy by profes- sionals specially trained for this purpose. Such investigation is important because ensuring adequate intake of calories and nutrients without increasing blood glucose levels or caus- ing excessive weight gain is very important for preventing maternal and fetal complications in this population [4,6,7].
Caloric recommendations for pregnant women with diabetes Table 4. Nutrient adequacy ratio (NAR), and mean adequacy ratio (MAR) of the subjects
GDM (n = 111) T2DM (n = 14) P value*
NAR
Energy 0.80 ± 0.18 0.82 ± 0.18 0.883
Protein 0.72 ± 0.21 0.71 ± 0.21 0.798
Dietary fiber 0.86 ± 0.31 0.82 ± 0.29 0.505
Calcium 0.81 ± 0.36 0.58 ± 0.32 0.019
Iron 0.59 ± 0.19 0.54 ± 0.18 0.278
Zinc 0.79 ± 0.17 0.67 ± 0.18 0.011
Vitamin A 0.86 ± 0.20 0.81 ± 0.25 0.775
Vitamin B1 0.77 ± 0.27 0.59 ± 0.22 0.008
Vitamin B2 0.75 ± 0.20 0.53 ± 0.23 0.001
Vitamin B6 0.84 ± 0.18 0.75 ± 0.22 0.167
Niacin 0.76 ± 0.19 0.68 ± 0.23 0.180
Vitamin C 0.83 ± 0.23 0.79 ± 0.29 0.922
Folic acid 0.49 ± 0.21 0.45 ± 0.25 0.361
MAR 0.76 ± 0.16 0.67 ± 0.18 0.045
Values are presented as mean ± SD.
*Based on Wilcoxon rank-sum test.
Table 5. Index of nutritional quality (INQ) of the subjects
GDM (n = 111) T2DM (n = 14) P value*
Protein 0.87 ± 0.15 0.83 ± 0.15 0.404
Dietary fiber 1.04 ± 0.36 0.95 ± 0.33 0.490
Calcium 0.97 ± 0.40 0.66 ± 0.32 0.007
Iron 0.71 ± 0.22 0.63 ± 0.17 0.292
Zinc 1.08 ± 0.69 0.79 ± 0.19 0.003
Vitamin A 1.77 ± 1.61 1.23 ± 0.60 0.314
Vitamin B1 0.93 ± 0.30 0.68 ± 0.25 < 0.001
Vitamin B2 0.97 ± 0.31 0.60 ± 0.20 < 0.001
Vitamin B6 1.15 ± 0.46 0.86 ± 0.19 0.010
Niacin 0.96 ± 0.29 0.81 ± 0.27 0.063
Vitamin C 1.47 ± 0.98 1.18 ± 0.59 0.426
Folic acid 0.60 ± 0.28 0.52 ± 0.24 0.503
Values are presented as mean ± SD.
*Based on Wilcoxon rank-sum test.
are based on standards for appropriate weight gain during pregnancy, with certain caloric restrictions recommended for those who are obese or overweight [6-8]. Until the American Diabetic Association (ADA) first recommended caloric restric- tion for obese patients with GDM in 2000 [18], the recom- mended caloric intake for women with GDM was similar to that of healthy pregnant women. Based on observation that hyperglycemia can be improved without increasing ketonuria if appropriate weight gain is maintained [6,7], the current recom- mendation for obese women with GDM is to restrict calories 30% to 33% fewer than the RNI for healthy pregnant women.
In South Korea, women with GDM are advised not to increase caloric intake during the early stage of pregnancy, and then to increase intake during the mid and late stages of pregnancy according to their individual situation [11,12]. Women with pre- gestational diabetes are advised to consume an additional 300 kcal/day during the mid and late stages of pregnancy, depend- ing on their status [12].
No specific recommendations regarding caloric restriction for obese or overweight pregnant women have yet been es- tablished. However, the findings of national studies of GDM patients, which reported a high mean pre-pregnancy BMI of 23 to 25 kg/m2 [13,14,19-21], and the findings of the present study, in which approximately 50% of the subjects were over- weight or obese, suggests the need to establish recommended caloric intake levels for GDM patients. Accordingly, this study estimated the appropriate caloric intake of the subjects based on not only consideration of existing recommendations but also pre-pregnancy weight and weight gain during pregnancy.
Based on these considerations, the caloric intake levels of the GDM and T2DM groups were determined to be 1,597 and 1,408 kcal/day, respectively, which are 86.1% and 91.4%, respective- ly, of the recommended intake levels for subjects. Few studies of the nutrient intake of women with GDM have been con- ducted in South Korea. Of the few that have, a case-control study conducted to identify the association between dietary habits and nutrient intake levels reported that the average caloric intake of the GDM subjects was 1,959 kcal/day [14]. It is difficult to make a comparison with the results of this study, because they measured caloric intake using a food frequency questionnaire. Using a 24-hour recall method, Chang et al. [13]
and Park [19] found the mean daily caloric intake levels of their GDM subjects were approximately 2,300 and 1,850 kcal, re- spectively, higher than the mean intake level (1,596 kcal) of the subjects in this study. However, it is also difficult to compare
these results, considering the differences in some data collec- tion procedures. The reason why energy intake was reported to be less than recommended values in this study is thought to be due to reduced amount of meals by doctor’s advice or in concerns about weight control and blood glucose levels after being diagnosed with diabetes. Dietary intake without profes- sional advice regarding appropriate meal planning in pregnant women with GDM or T2DM is never desirable because it can invoke diabetic ketoacidosis during pregnancy, which pose a great danger to both the mother and fetus. [22,23]. An impor- tant consideration is that both the fetus and placenta require large amounts of maternal glucose as a major source of the energy in the second and third trimester, resulting in reduc- tion of maternal glucose level and increase in free fatty acid production and ketone generation in the liver [22]. Given that most women with GDM are diagnosed with the disease after mid-pregnancy, proper training of medical professionals is needed to prevent these risks.
Management of carbohydrate intake of pregnant women with GDM and T2DM is important for postprandial glucose control [4,24]. While several observational and non-random- ized studies of GDM patients reported that the percentage of total calories obtained by carbohydrate intake was 30%
to 60% [7], the present study found that it was 56.6% and 63.6% in the GDM and T2DM groups, respectively. In 2002, the ADA recommended that carbohydrate intake levels for GDM patients be limited to 35% to 40% of total calories [26], although a recent report recommended it be restricted to 40%
to 45% of total calories [26].
It is well known that maternal hyperglycemia stimulates insulin secretion of the fetus through the placenta, a phenom- enon that acts like fetal growth factor to increase the risk of macrosomia [4]. The recommendation of 2004 on nutrition therapy for GDM reported that despite the claims of previ- ous studies of improved glucose level of mothers thanks to low-carbohydrate meal, there were few grounds of effect of nutritional treatment on long-term health of mothers and perinatal complications in the current status [7]. Other stud- ies have suggested that intake of low levels of carbohydrates on a regular basis to regulate blood glucose, in conjunction with caloric control and insulin therapy, can reduce the risk of macrosomia [24]. The recent hyperglycemia and adverse pregnancy outcomes (HAPO) study, which conducted glucose tolerance testing of 20,000 pregnant women without diabe- tes, reported a strong positive association between maternal
glucose levels and both fetal body fat status and pregnancy complications [27,28]. For women who have been diagnosed with T1DM or T2DM before pregnancy, maintaining appropri- ate blood glucose levels via provision of a treatment plan that includes education regarding proper meal preparation is very important, as exposure to high maternal blood glucose levels in early pregnancy may increase the risk of fetal central nervous system and musculoskeletal system disorders and cardiovascular disease [9,10].
For both the GDM and T2DM groups in this study, carbo- hydrate intake levels as a percentage of calories were above recommended levels while protein and fat intake levels as a percentage of calories were below recommended levels. Spe- cifically, the protein and fat intake levels of the GDM group were only 17.4% and 26.0%, respectively, and those of T2DM group only 16.6% and 19.7%, respectively, compared to the recommended levels of 20.0% and 35.0%, respectively. These findings, which accord with study of Park et al. [20] in GDM patients, suggest that pregnant women with GDM or T2DM be advised to reduce their carbohydrate intake and increase their protein and fat intake, and that women with pre-gestational diabetes be provided with dietary education that emphasizes glucose control during the early stage of pregnancy. When studying the effectiveness of such education, the women’s compliance with the recommendations should be considered separately from their understanding of the education provid- ed, as Park et al. [20] found that the subjects did not comply with the recommendations provided during training (i.e., ob- taining 52% vs. 45% of their calories from carbohydrates and 27% vs. 35% from fat).
The intakes of nutrients other than macronutrients and calories were evaluated based on the recommended levels [17]
for pregnant women of Dietary Reference Intakes for Koreans.
Most nutrients did not meet the RNI, and this result is thought to have been partly caused by the low calorie intake. However, ruling out the effect of caloric intake, the INQ values obtained in the present study indicate that the actual intake levels of the GDM group were lower than the recommended levels for all micronutrients except for dietary fiber, zinc, vitamin A, vi- tamin B6, and vitamin C. Conversely, those of the T2DM group, who had a higher caloric intake ratio than the GDM group, were lower than the recommended levels for all micronutrients except for vitamin A and vitamin C. As the mean INQ values for most micronutrients were less than 1, indicating that the micronutrient intake levels did not meet recommended levels
in spite of consumption of sufficient calories, it can be con- cluded that the dietary quality of the study subjects was not adequate.
With the exception of the values for vitamin A and vitamin C, for which intake levels exceeded the recommended levels, the NAR values for micronutrients were less than 1 for both groups. Because there was no quality assessment study of diet for pregnant women with GDM or T2DM, it is not possible to compare the current study findings with previous studies. In present study, INQ, NAR, and MAR values of subjects indicate that their meal quality was inadequate, suggesting the need to provide them with education regarding meal planning and meal quality as well as proper caloric and carbohydrate intake.
As for all patients with diabetes, eating regular meals is a basic principle of dietary therapy for pregnant women with diabetes. Most sets of dietary recommendations for GDM patients recommend consumption of small meals and 2 to 4 snacks throughout the day for adequate glycemic control [6,12,18,25]. Most study subjects appeared to eat 3 times a day, and 36% consumed a morning, afternoon, and evening snack.
Although consuming an evening snack is recommended for pregnant women with GDM and T2DM to prevent night-time hypoglycemia and ketosis [6,12], only 64.9% and 78.6% of the GDM and T2DM groups, respectively, consumed an evening snack (data not shown).
The Korean Dietetic Association recommends restriction of carbohydrate intake at breakfast for GDM patients to prevent a sudden rise in blood glucose. Specifically, it recommends consuming 10% of carbohydrates at breakfast, 20% to 30%
at lunch, 30% to 40% at dinner, and 30% from snacks [12].
However, the GDM and T2DM groups consumed 23.1% and 24.9%, respectively, of their carbohydrates at breakfast, more than 200% of the recommended levels, and a relatively lower percentage from snacks, indicating the need to adjust their carbohydrate intake at breakfast.
Several aspects of the study sample and dietary measure- ments may limit the generalizability of the findings. Regarding the sample, only a small number of T2DM subjects were ex- amined, and all the subjects had a relatively higher educational level compared to those in previous studies of GDM. However, as stratified analysis for education revealed that highly edu- cated subjects tend to consume higher quality meals, it is un- likely that the parameter of education meaningfully distorted the results. Regarding dietary measurements, the recorded nutrient intake levels may not have accurately reflected the
actual intake levels because nutrient intake measurement was conducted using a 24-hour recall method for one day. How- ever, all GDM subjects except for one woman responded “yes”
when asked whether a meal that they had consumed was similar to the meal that they typically consumed, indicating that they had not changed their dietary habits in reaction to concern about blood glucose control. Another measurement limitation was that nutrient intake via nutritional supplements was not considered. Given that most pregnant women take supplements containing iron and folic acid, additional con- sideration was required in meal quality assessment through micronutrient. Although many studies reported that pregnant women with GDM and T2DM increase maternal and neonatal risks [4,5], we could not show the results related to pregnancy outcomes because this study was planned as cross-sectional design.
Conclusion
The results of the present study indicate that women diag- nosed with GDM during pregnancy or T2DM before pregnancy tend to have inadequate micronutrient intake and unbalanced macronutrient intake when they are not provided with nutri- tional education by experts specially trained for this purpose.
Based on these results, it is strongly recommended that this population be provided with appropriate nutritional education before and during pregnancy to prevent maternal and fetal perinatal complications and post-gestational diabetes, obesity, and cardiovascular diseases.
Acknowledgments
This work was supported by grants of Seoul R&D project and Ministry for Health, Welfare and Family Affairs.
References
1. Choi HM. Nutrition in pregnancy. Korean J Obstet Gynecol 2008;51:481- 91.
2. Henriksen T. Nutrition and pregnancy outcome. Nutr Rev 2006;64:S19- 23.
3. King JC. Physiology of pregnancy and nutrient metabolism. Am J Clin Nutr 2000;71:1218S-1225S.
4. Petry CJ. Gestational diabetes: risk factors and recent advances in its genetics and treatment. Br J Nutr 2010;104:775-87.
5. Uvena-Celebrezze J, Catalano PM. The infant of the woman with ges- tational diabetes mellitus. Clin Obstet Gynecol 2000;43:127-39.
6. Franz MJ, Bantle JP, Beebe CA, Brunzell JD, Chiasson JL, Garg A, Hol- zmeister LA, Hoogwerf B, Mayer-Davis E, Mooradian AD, Purnell JQ, Wheeler M; American Diabetes Association. Nutrition principles and recommendations in diabetes. Diabetes Care 2004;27 Suppl 1:S36-46.
7. Gunderson EP. Gestational diabetes and nutritional recommendations.
Curr Diab Rep 2004;4:377-86.
8. Metzger BE, Buchanan TA, Coustan DR, de Leiva A, Dunger DB, Hadden DR, Hod M, Kitzmiller JL, Kjos SL, Oats JN, Pettitt DJ, Sacks DA, Zoupas C.
Summary and recommendations of the Fifth International Workshop- Conference on Gestational Diabetes Mellitus. Diabetes Care 2007;30 Suppl 2:S251-60.
9. Correa A, Gilboa SM, Besser LM, Botto LD, Moore CA, Hobbs CA, Cleves MA, Riehle-Colarusso TJ, Waller DK, Reece EA. Diabetes mellitus and birth defects. Am J Obstet Gynecol 2008;199:237.e1-9.
10. Corrigan N, Brazil DP, McAuliffe F. Fetal cardiac effects of maternal hyperglycemia during pregnancy. Birth Defects Res A Clin Mol Teratol 2009;85:523-30.
11. Korean Diabetes Association. Education guide for diabetes. 2nd ed.
Seoul: Korean Diabetes Association; 2006.
12. Korean Dietetic Association. Manual of medical nutrition therapy. 3rd ed. Seoul: Korean Dietetic Association; 2008.
13. Chang N, Kim S, Kim YL. Physical and dietary characteristics in women with gestational diabetes mellitus. Korean J Nutr 2001;34:158-64.
14. Ji SK, Jang HC, Choi H. A case-control study of food habits and diet intakes of women with gestational diabetes mellitus. Korean J Nutr 2008;41:41-53.
15. American Diabetes Association. Gestational diabetes mellitus. Diabetes Care 2004;27 Suppl 1:S88-90.
16. Cunningham FG, Leveno KJ, Bloom SL, Hauth JC, Gilstrap L, Wenstrom KD. Prenatal diagnosis and fetal therapy. In: Cunningham FG, Williams JW, editors. Williams obstetrics. 22nd ed. New York (NY): McGraw-Hill;
2005. p. 208.
17. Korean Nutrition Society. Dietary reference intakes for Koreans. 1st rev.
Seoul: Korean Nutrition Society; 2010.
18. Amann-Gassner U, Hauner H. Nutrition therapy for gestational diabe- tes. Dtsch Med Wochenschr 2008;133:893-8.
19. American Diabetes Association. Gestational diabetes mellitus. Diabetes Care 2000;23 Suppl 1:S77-9.
20. Park BK. The effects of carbohydrate-restricted diet therapy in gesta- tional diabetes [dissertation]. Seoul: Yonsei University; 2001.
21. Park JH, Song HJ, Choun JK, Cho JJ, Paek YJ, Park KH, Kim A, Lee PR, Hwang JY. Risk factors for gestational diabetes mellitus. Korean J Obes 2005;14:178-85.
22. Cho AR, Kyeung KS, Park MA, Lee YM, Jeong EH. Risk factors of gesta- tional diabetes mellitus. Korean J Perinatol 2007;18:329-37.
23. Kamalakannan D, Baskar V, Barton DM, Abdu TA. Diabetic ketoacidosis in pregnancy. Postgrad Med J 2003;79:454-7.
24. Carroll MA, Yeomans ER. Diabetic ketoacidosis in pregnancy. Crit Care Med 2005;33:S347-53.
25. Dornhorst A, Frost G. The principles of dietary management of ges- tational diabetes: reflection on current evidence. J Hum Nutr Diet 2002;15:145-56.
26. American Diabetes Association. Evidence-based nutrition principles and recommendations for the treatment and prevention of diabetes and related complications. Diabetes Care 2002;25:202-12.
27. HAPO Study Cooperative Research Group, Metzger BE, Lowe LP, Dyer AR, Trimble ER, Chaovarindr U, Coustan DR, Hadden DR, Mc- Cance DR, Hod M, McIntyre HD, Oats JJ, Persson B, Rogers MS, Sacks DA. Hyperglycemia and adverse pregnancy outcomes. N Engl J Med 2008;358:1991-2002.
28. HAPO Study Cooperative Research Group. Hyperglycemia and Adverse Pregnancy Outcome (HAPO) Study: associations with neonatal anthro- pometrics. Diabetes 2009;58:453-9.