D I A B E T E S & M E T A B O L I S M J O U R N A L
This is an Open Access article distributed under the terms of the Creative Commons Attribution Non-Commercial License (http://creativecommons.org/licenses/by-nc/4.0/) which permits unrestricted non-commercial use, distribution, and reproduction in any medium, provided the original work is properly cited.
Hemorheologic Alterations in Patients with Type 2 Diabetes Mellitus Presented with an Acute Myocardial Infarction
Kyu-Hwan Park1,2, Ung Kim2, Kang-Un Choi2, Jong-Ho Nam2, Jung-Hee Lee2, Chan-Hee Lee2, Jang-Won Son2, Jong-Seon Park2, Dong-Gu Shin2, Kyu-Chang Won3, Jun Sung Moon3, Yu Kyung Kim4, Jang-Soo Suh5
1Department of Internal Medicine, Daegu Veterans Hospital, Daegu,
Divisions of 2Cardiology, 3Endocrinology, Department of Internal Medicine, 4Department of Chemical Pathology, Yeungnam University Medical Center, Yeungnam University College of Medicine, Daegu,
5Department of Chemical Pathology, Kyungpook National University Hospital, Kyungpook National University School of Medicine, Daegu, Korea
Background: Hemorheologic indices are known to be related to vascular complications in variable clinical settings. However, lit- tle is known about the associations between hemorheologic parameters and acute myocardial infarction (AMI) in type 2 diabetes mellitus (T2DM). The purpose of this study was to demonstrate the changes of hemorheologic environment inside of blood using hemorheologic parameters, especially the elongation index (EI) and critical shear stress (CSS) in diabetics with versus without AMI.Methods: A total of 195 patients with T2DM were enrolled. Patients were divided into the study group with AMI (AMI+, n=77) and control group (AMI–, n=118) who had no history of coronary artery disease. Hemorheologic parameters such as EI and CSS were measured and compared between the two groups.
Results: The EI was lower (30.44%±1.77% in AMI+ and 31.47%±1.48% in AMI–, P<0.001) but the level of CSS was higher (316.13±108.20 mPa in AMI+ and 286.80±85.34 mPa in AMI–, P=0.040) in the AMI+. The CSS was significantly related to the erythrocyte sedimentation rate (R2=0.497, P<0.001) and use of dipeptidyl peptidase-4 inhibitors (R2=0.574, P=0.048).
Conclusion: Diabetics with AMI resulted in adverse hemorheologic changes with lower EI and higher CSS compared to diabetic subjects without AMI. Evaluation of the hemorheologic parameters may provide valuable supplementary information for manag- ing patients with AMI and T2DM.
Keywords: Diabetes mellitus, type 2; Erythrocyte deformability; Hemorheology; Myocardial infarction
Corresponding author: Ung Kim https://orcid.org/0000-0002-6009-1843 Division of Cardiology, Department of Internal Medicine, Yeungnam University Medical Center, Yeungnam University College of Medicine, 170 Hyeonchung-ro, Nam-gu, Daegu 42415, Korea
E-mail: [email protected]
INTRODUCTION
Erythrocytes play a crucial role in the transport of oxygen and carbon dioxide via the blood flow through the circulatory sys- tem. One of the unique capabilities of erythrocytes is that they are extremely deformable as they progressively elongate under shear stress and form ellipsoids with their long axis aligned with the flow. Thus erythrocytes are capable of entering and
transiting blood capillaries, which are narrower than the diam- eter of a resting erythrocyte [1]. Hemorheologic abnormalities have been observed in various clinical situations including dia- betes, ischemic heart diseases (IHDs), hypertension, etc. [2-5], and many physicians have been trying to apply them to various clinical fields. There are many hemorheologic indices includ- ing the plasma viscosity, hematocrit, fibrinogen, erythrocyte deformability (ED), and critical shear stress (CSS).
https://doi.org/10.4093/dmj.2018.42.2.155 pISSN 2233-6079 · eISSN 2233-6087
Of those, the CSS is defined as the minimum shear stress re- quired for dispersing the aggregates, and is one of the red blood cell (RBC) aggregation indices. A higher value of the CSS might be associated with increased thrombosis as a trigger for the rupture of a vulnerable atherosclerotic plaque in acute coronary syndrome [3,6]. Diabetes, meanwhile, affects the RBC function through an interaction with its membrane and intracellular constituents. ED has been demonstrated to be im- paired in diabetes, especially in the case of coexisting micro- vascular complications. Moreover, there is increasing evidence that diabetes is associated with a pathological hemorheologic alteration, which might contribute to an impaired coronary blood flow in coronary artery disease (CAD) [7,8]. However, little is known about the association to hemorheologic indices and acute myocardial infarctions (AMIs) in the situation of type 2 diabetes mellitus (T2DM). The purpose of this study was to demonstrate the changes of hemorheologic environ- ment inside of blood using hemorheologic parameters, espe- cially the ED and CSS with versus without AMI in patients with T2DM.
METHODS
Study design
A total 542 patients (study group [AMI+, n=208] from cardi- ology division and control group [AMI–, n=334] from endo- crinology division) were enrolled in this study from March to December 2014. We excluded some patients who were under
clinical situations that might directly influence the ED (sec- ondary erythrocytosis [n=1], under chemotherapy due to ma- lignancy [n=1], type 1 diabetes mellitus [T1DM; n=1], under regular hemodialysis [n=2], hepatic failure [n=1]). All pa- tients were classified into two groups according to the presence of an AMI (AMI+) and those without it (AMI–). Of AMI+, subjects without history of T2DM (n=128) were excluded. Of AMI–, if any history of IHD or previous coronary intervention such as coronary balloon angioplasty and/or a coronary stent implantation, was present, they (n=116) were also excluded due to clarify the hemorheologic effect on newly developed IHD (77 patients in AMI+ and 118 patients in AMI–) (Fig. 1).
Institutional Review Board (IRB 2014-01-494) approved this study from Yeungnam University Medical Center and written informed consent was acquired from all patients.
Diabetes was diagnosed by demonstrating any one of the following: fasting plasma glucose level ≥126 mg/dL, plasma glucose at 2 hours after oral glucose load ≥200 mg/dL, and random plasma glucose ≥200 mg/dL with classic hyperglyce- mic symptoms. Classification of T1DM and T2DM was based on integration of clinical symptoms, insulin antibody, absolute insulin deficiency, and family history [9]. An MI was defined as the presence of at least two of the following: anginal pain, el- evation of the creatine kinase concentration greater than three times the upper limit of normal, and/or electrocardiographic changes suggesting an MI [10].
A blood sample was taken during the first visit to the endo- crinology outpatient department in the cases of AMI–. In the
Fig. 1. Study flow chart. AMI, acute myocardial infarction; PCI, percutaneous coronary intervention; T2DM, type 2 diabetes mel- litus; T1DM, type 1 diabetes mellitus; MI, myocardial infarction.
334 T2DM patients visiting outpatient endocrinology department 208 AMI patients underwent PCI
admitted to cardiology department
Exclusion
213 History of coronary artery disease or PCI treatment
1 Under chemotherapy due to malignancy 1 T1DM
1 Hepatic failure Exclusion
128 No history of T2DM 2 Under regular hemodialysis 1 Secondary erythrocytosis
118 T2DM without cardiovascular eventsAMI−
77 Acute MI with T2DMAMI+
cases of AMI+, the laboratory examinations of the blood sam- ples were performed anytime within 3 days prior to invasive coronary intervention procedures after being admitted to the intensive care unit or emergency department. In case of indi- vidual situation which early coronary intervention was needed to be done, blood sample was taken just before coronary inter- vention. We implanted second generation drug-eluting stents in all patients classified as being in the AMI+. The hemorheo- logic parameters were analyzed by routine laboratory assays.
The ED, which was quantified by an elongation index (EI; mea- sured at a constant shear stress of 3 pascal [Pa] %), and the CSS were measured by a microfluidic ektacytometer (Rheoscan- D®; Rheo-Meditech, Seoul, Korea) using a disposable kit [11], and the other hemorheologic parameters were compared be- tween the two groups. The EI was calculated from the dimen- sions of the major (L) and minor (W) axes of an ellipsoid at 3 Pa, EI=[L–W]/[L+W]; this is expressed as a percentage (Fig.
2). The homeostatic model assessment of insulin resistance (HOMA-IR), as a marker of insulin resistance, was calculated using the following formula: HOMA-IR=fasting plasma insu- lin (μU/mL)×fasting plasma glucose (mg/dL)/405; and the homeostatic model assessment of β-cell function (HOMA-β), which means the function of the β-cells of the pancreas, was calculated as the fasting plasma insulin (μU/mL)×360/(fasting glucose [mg/dL]–63) [12].
The current medications at the time of the blood sampling were also analyzed because some medications, releasing nitric oxide (NO) or modulating the bioactivity of NO, could influ- ence the value of the EI by increasing the NO concentration in the blood [13,14]. The structural and functional echocardio- graphic parameters including the left ventricular ejection frac- tion (LVEF) were measured by transthoracic echocardiogra- phy during hospitalization.
Statistics
The results are reported as the mean±standard deviation for numerical variables and as frequencies and percentages for categorical variables. The independent t-test was used to com- pare the group continuous variables and the chi-square test or Fisher exact test was used to compare the categorical variables.
A multivariate linear regression analysis was used to demon- strate any significant factors determining the EI and CSS (vari- able were as follows; sex, age, hypertension, history of cerebro- vascular accident, smoking, body mass index, systolic blood pressure, pharmacologic status, LVEF, E/E’ ratio, white blood cell, hemoglobin, red cell distribution width, mean corpuscu- lar volume, mean corpuscular hemoglobin concentration, platelet count, high-sensitivity C-reactive protein, total protein, aspartate transaminase, alanine transaminase, estimated glomerular filtration rate [GFR], glycosylated hemoglobin [HbA1c], total cholesterol, cystatin C, and insulin resistance/
sensitivity indices). IBM SPSS version 19.0 (IBM Co., Armonk, NY, USA) was used for the statistical analysis and statistical significance was accepted for P<0.05.
RESULTS
Baseline characteristics
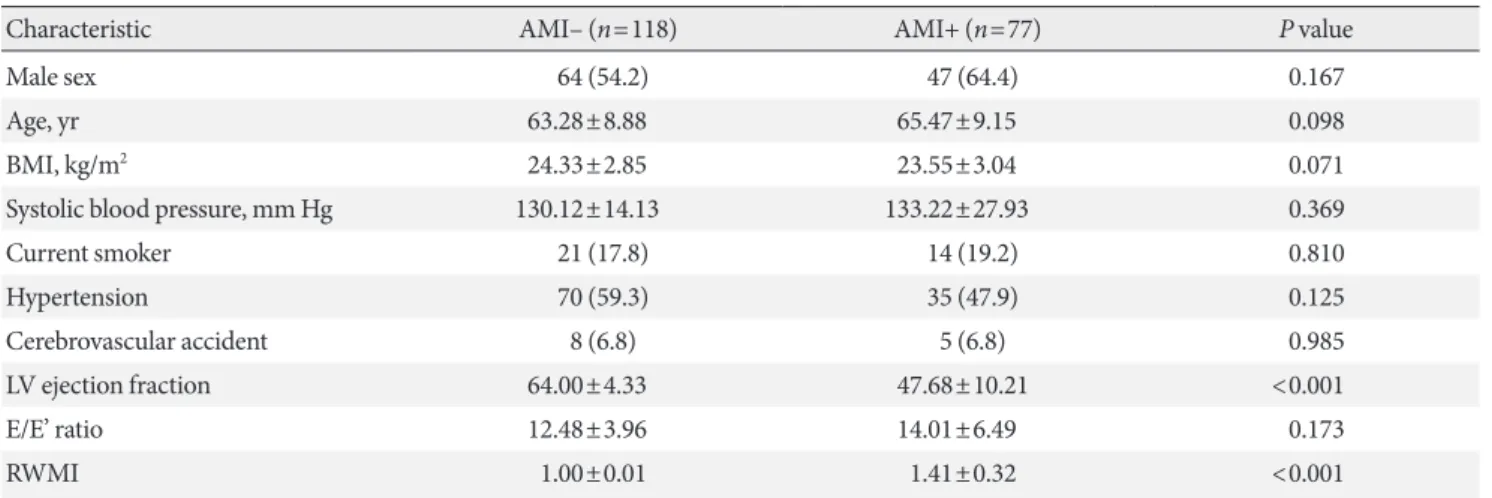
Baseline characteristics were shown in Table 1. Sixty percent of the population was male with the mean age of 64 years old.
There were no significant differences between the two groups except echocardiographic parameters which seemed to be nat- ural consequences caused by IHD. The left ventricular systolic function (LVEF: 47.68%±10.21% in AMI+ vs. 64.00%±4.33%
in AMI–, P<0.001) was lower and the regional wall motion in- dex (1.41±0.32 in AMI+ vs. 1.00±0.01 in AMI–, P<0.001) was higher in AMI+.
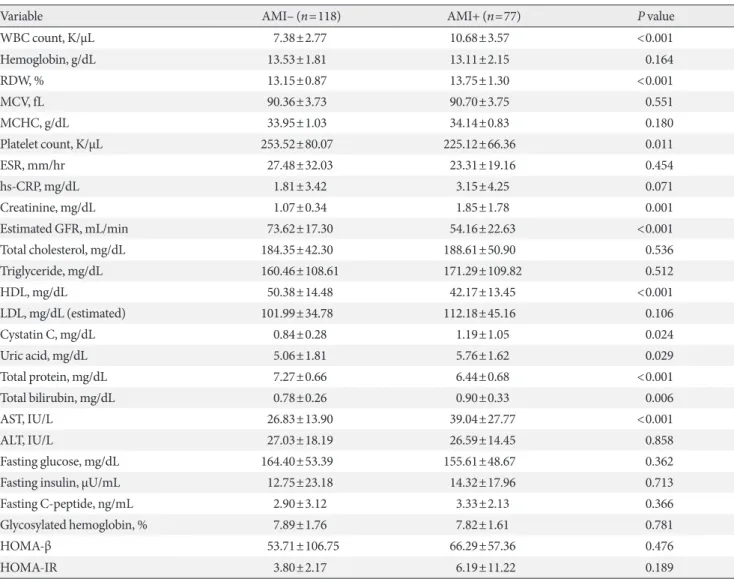
Laboratory findings and medical treatment at baseline The renal function, represented by the serum creatinine (1.85±1.78 mg/dL in AMI+ vs. 1.07±0.34 mg/dL in AMI–, P<0.001) and estimated GFR (54.16±23.63 mL/min in AMI+
vs. 73.62±17.30 mL/min in AMI–, P<0.001), was decreased in AMI+. The total bilirubin (0.90±0.33 mg/dL in AMI+ vs. 0.78±
0.26 mg/dL in AMI–, P=0.006) and aspartate transaminase (39.04±27.77 IU/L in AMI+ vs. 26.83±13.90 IU/L in AMI–, P<0.001) were higher in the AMI+. The blood sugar level, in- sulin level during a fasting state, and HbA1c level did not sig- nificantly differ between the two groups, as well as the parame- Fig. 2. Schema of the measurement of the red blood cell. Elon-
gation index (EI), which was measured at a pressure of 3 Pa, was defined as (L–W)/(L+W) and it was expressed as a per- centage. L means the length of the major axis of the cell, and W means the width of the minor axis of the cell. The lower the value of the EI is, the more circular the cell becomes.
ters related with insulin resistance (HOMA-IR and HOMA-β) (Table 2).
The use of insulin (15.6% of AMI+ and 28.0% of AMI–, P=0.045) and metformin (22.1% of AMI+ and 55.1% of AMI–, P<0.001) were significantly different between two groups. An- other detailed medical treatment at baseline was described in Supplementary Table 1.
Hemorheologic findings
Red cell distribution width (13.75%±1.30% in AMI+ vs. 13.15%±
0.87% in AMI–, P<0.001) was higher in AMI+. The number of platelets was lower in the AMI+ (225.12±66.36 K/μL in AMI+
vs. 253.52±80.07 K/μL in AMI–, P=0.011). The EI at 3 Pa was significantly lower (30.44%±1.77% in AMI+ vs. 31.47%±
1.48% in AMI–, P<0.001) (Fig. 3A), while the level of CSS was
significantly higher in AMI+ (316.13±108.20 mPa in AMI+
vs. 286.80±85.34 mPa in AMI–, P=0.040) (Fig. 3B). On multi- ple linear regression analysis, the level of CSS was significantly related to the erythrocyte sedimentation rate (ESR; R2=0.497, P<0.001) and the use of a dipeptidyl peptidase-4 (DPP-4) in- hibitor (R2=0.574, P=0.048) (Table 3). Estimated GFR was correlated well with EI (r=0.375, P<0.001) but inversely corre- lated with the level of CSS (r=–0.317, P<0.001) (Fig. 4). No correlation was observed between EI and the level of CSS (r=
–0.124, P=0.090) (Fig. 5).
HbA1c and EI
There was no significant difference on the level of HbA1c be- tween two groups as shown Table 2. However, of all patients regardless of groups, the level of HbA1c was also inversely cor- Table 1. Baseline characteristics
Characteristic AMI– (n=118) AMI+ (n=77) P value
Male sex 64 (54.2) 47 (64.4) 0.167
Age, yr 63.28±8.88 65.47±9.15 0.098
BMI, kg/m2 24.33±2.85 23.55±3.04 0.071
Systolic blood pressure, mm Hg 130.12±14.13 133.22±27.93 0.369
Current smoker 21 (17.8) 14 (19.2) 0.810
Hypertension 70 (59.3) 35 (47.9) 0.125
Cerebrovascular accident 8 (6.8) 5 (6.8) 0.985
LV ejection fraction 64.00±4.33 47.68±10.21 <0.001
E/E’ ratio 12.48±3.96 14.01±6.49 0.173
RWMI 1.00±0.01 1.41±0.32 <0.001
Values are presented as number (%) or mean±standard deviation.
AMI, acute myocardial infarction; BMI, body mass index; LV, left ventricle; RWMI, regional wall motion index.
Fig. 3. Comparison of erythrocyte functions (A, elongation index, P<0.001; B, critical shear stress, P=0.040) between two groups.
AMI, acute myocardial infarction. aAMI group showed lower elongation index (A, 30.44%±1.77% vs. 31.47%±1.48%) and higher critical shear stress (B, 316.13±108.20 mPa vs. 286.80±85.34 mPa) compared to control group.
35.0 32.5 30.0 27.5 25.0
800 600 400
Elongation index at 3 Pa (%) Critical shear stress (mPa) 200
AMI− AMI+ AMI− AMI+
a
P<0.001 P=0.040
A B
Table 2. Laboratory findings
Variable AMI– (n=118) AMI+ (n=77) P value
WBC count, K/µL 7.38±2.77 10.68±3.57 <0.001
Hemoglobin, g/dL 13.53±1.81 13.11±2.15 0.164
RDW, % 13.15±0.87 13.75±1.30 <0.001
MCV, fL 90.36±3.73 90.70±3.75 0.551
MCHC, g/dL 33.95±1.03 34.14±0.83 0.180
Platelet count, K/µL 253.52±80.07 225.12±66.36 0.011
ESR, mm/hr 27.48±32.03 23.31±19.16 0.454
hs-CRP, mg/dL 1.81±3.42 3.15±4.25 0.071
Creatinine, mg/dL 1.07±0.34 1.85±1.78 0.001
Estimated GFR, mL/min 73.62±17.30 54.16±22.63 <0.001
Total cholesterol, mg/dL 184.35±42.30 188.61±50.90 0.536
Triglyceride, mg/dL 160.46±108.61 171.29±109.82 0.512
HDL, mg/dL 50.38±14.48 42.17±13.45 <0.001
LDL, mg/dL (estimated) 101.99±34.78 112.18±45.16 0.106
Cystatin C, mg/dL 0.84±0.28 1.19±1.05 0.024
Uric acid, mg/dL 5.06±1.81 5.76±1.62 0.029
Total protein, mg/dL 7.27±0.66 6.44±0.68 <0.001
Total bilirubin, mg/dL 0.78±0.26 0.90±0.33 0.006
AST, IU/L 26.83±13.90 39.04±27.77 <0.001
ALT, IU/L 27.03±18.19 26.59±14.45 0.858
Fasting glucose, mg/dL 164.40±53.39 155.61±48.67 0.362
Fasting insulin, µU/mL 12.75±23.18 14.32±17.96 0.713
Fasting C-peptide, ng/mL 2.90±3.12 3.33±2.13 0.366
Glycosylated hemoglobin, % 7.89±1.76 7.82±1.61 0.781
HOMA-β 53.71±106.75 66.29±57.36 0.476
HOMA-IR 3.80±2.17 6.19±11.22 0.189
Values are presented as mean±standard deviation.
AMI, acute myocardial infarction; WBC, white blood cell; RDW, red cell distribution width; MCV, mean corpuscular volume; MCHC, mean corpuscular hemoglobin concentration; ESR, erythrocyte sedimentation rate; hs-CRP, high-sensitivity C-reactive protein; GFR, glomerular fil- tration rate; HDL, high density lipoprotein; LDL, low density lipoprotein; AST, aspartate aminotransferase; ALT, alanine aminotransferase;
HOMA-β, homeostatic model assessment of β-cell; HOMA-IR, homeostatic model assessment of insulin resistance.
Table 3. The association between critical shear stress and erythrocyte sedimentation rate or dipeptidyl peptidase-4 inhibitors on multiple linear regression
Variable R2 Estimated β Standard error P value
Erythrocyte sedimentation rate 0.497 3.644 0.734 <0.001
Dipeptidyl peptidase-4 inhibitors 0.574 –64.215 30.872 0.048
Adjusted for sex, age, hypertension, history of cerebrovascular accident, smoking, body mass index, systolic blood pressure, pharmacologic sta- tus (nicorandil, insulin, metformin, aspirin, adenosine diphosphate receptor blocker, renin-angiotensin system blockade, β-blocker, calcium channel blocker, 3-hydroxy-3-methylglutaryl coenzyme A reductase inhibitor, sulfonylurea, dipeptidyl peptidase-4 inhibitors), left ventricular ejection fraction, E/E’ ratio, white blood cell, hemoglobin, red cell distribution width, mean corpuscular volume, mean corpuscular hemoglobin concentration, platelet count, high-sensitivity C-reactive protein, total protein, aspartate transaminase, alanine transaminase, estimated glomer- ular filtration rate, glycosylated hemoglobin, total cholesterol, cystatin C, homeostasis model assessment β-cell, and homeostasis model assess- ment insulin resistance.
related with the EI (r=–0.161, P=0.029) (Fig. 6).
DISCUSSION
This study demonstrated that diabetic subjects with AMI had worse hemorheologic environment through reduced ED and CSS examined by ektacytometer. Moreover, increased CSS was
associated with higher ESR and use of DPP-4 inhibitors might decrease the level of CSS.
It is already well known that progressive worsening of the ED by an impaired glucose tolerance has been found to be an indicator of microangiopathy [8,15,16]. These complications were caused by the composition of various mechanisms as fol- lows: progressive accumulation of HbA1c, inhibition of NO- Fig. 6. Correlation between glycosylated hemoglobin and the elongation index at 3 Pa (r=–0.161, P=0.029; black square, acute myocardial infarction [AMI] group; empty square, non- AMI group).
35.0 32.5 30.0 27.5 25.0
Elongation index
4 6 8 10 12 14
Glycosylated hemoglobin (mg/dL) r=−0.161 P=0.029
Fig. 5. Correlation between the elongation index at 3 Pa and critical shear stress (r=–0.124, P=0.090; black square, acute myocardial infarction [AMI] group; empty square, non-AMI group).
800
600
400
200
Critical shear stress (mPa)
25.0 27.5 30.0 32.5 35.0 Elongation index
r=−0.124 P=0.090
Fig. 4. Correlation between the renal function and elongation index at 3 Pa (A, r=0.375, P<0.001; black square, acute myocardial infarction [AMI] group; empty square, non-AMI group) and critical shear stress (B, r=–0.317, P<0.001). GFR, glomerular filtra- tion rate.
35.0 32.5 30.0 27.5 25.0
800
600
400
200
Elongation index Critical shear stress (mPa)
0 20 40 60 80 100 120 0 20 40 60 80 100 120
Estimated GFR (mL/min) Estimated GFR (mL/min)
r=0.375
P<0.001 r=−0.317
P<0.001
A B
mediated vasodilation, and endothelial injury due to an in- creased release of free fatty acids and other adipocytokines [17]. Endothelial dysfunction, vascular inflammation, an im- paired vascular function, and the prothrombotic status [18,19]
provoked by the multiple and complex mechanisms men- tioned above might be thought to provoke coronary arterial events.
Moreover, in large vessels like epicardial coronary arteries, the blood behaves as a continuous liquid, and the dominant factor of the blood flow is its viscosity. The blood viscosity in large vessels mainly depends on the hematocrit, plasma viscos- ity, erythrocyte aggregation, and deformability. In addition, since there is a constant varying of the blood flow, perfusion pressure, and shear rate, depending on the cardiac cycle, the coronary vessel system is regarded as a special part of the cir- culation [20]. So it can be inferred that hemorheologic factors and hemodynamic factors play an important role in the devel- opment of CAD. Especially, an altered EI could serve as a trig- ger for the rupture of a vulnerable atherosclerotic plaque, which would aggravate a thrombus formation that would lead to a clinical syndrome like an AMI, since several studies have proven a connection between a reduced ED and coronary vas- cular complications [3,21]. CSS, one of the erythrocyte aggre- gation indices, was statistically higher in the AMI group, which meant that a higher power to disperse the RBCs is needed in that situation. It is a major determinant of the blood viscosity along with the ED.
The blood concentration of HbA1c affects the alteration in the erythrocyte structure by oxidative stress, which results in a hemorheologic disturbance like a decrease in the EI even for a relatively short exposure time [15,22]. As an indicator of the blood sugar control for the last 3 months, the HbA1c was also inversely correlated with the EI in this study, and was consis- tent with the previous studies [8]. The link between the EI and renal function already exhibited an agreement with an earlier study [23] in which there was a progressive increase in the EI along with a progression of the renal impairment (Fig. 5).
Diverse factors were related to the CSS. One of them, fibrin- ogen, has a strong effect on the CSS [24], causing the CSS to increase proportional to the fibrinogen concentration. On the other hand, the CSS is a hematocrit-independent indicator [25]. To date, there have been no data about the relationship between the CSS and HbA1c. On the contrary, regarding the relationship of the above EI and HbA1c, the CSS was pre- sumed to have a positive correlation with the HbA1c in our
study. Recently, Xue et al. [24] demonstrated that a reduced ED and increased fibrinogen levels play a synergistic role in an in- creasing CSS. However, there was no definite positive correla- tion between the CSS and EI, but there was a tendency ob- served in our study, which could be overcome if there was a larger population than in this study (Fig. 6).
A higher ESR was associated with higher CSS and use of DPP-4 inhibitors might decrease the level of CSS in our study.
Beyond the relationship already known between the ESR and CSS, DPP-4 inhibitors also have a protective effect on cardio- vascular diseases through various factors including insulin re- sistance, oxidative stress, immunity modulation, and anti- apoptotic properties in the cardiovascular system [26,27].
There is accumulating evidence of a relationship between HbA1c and microangiopathy; however, we did not consider coexisting diabetic microvascular complications in these pa- tients. We did not analysis the other factors including the hy- perviscosity and fibrinogen, which might have played a signifi- cant role in the erythrocyte aggregation such as CSS.
In conclusion, the ED was reduced in the patients with an AMI and T2DM, while the CSS was higher in the same group.
The ED and CSS might be one of the possible mechanisms of the development of an AMI in patients with T2DM. An evalu- ation of the hemorheologic parameters, including the EI and CSS, may provide valuable supplementary information for the evaluation and management of IHD in T2DM.
CONFLICTS OF INTEREST
No potential conflict of interest relevant to this article was re- ported.
ACKNOWLEDGMENTS
This work was supported by a grant from the Yeungnam Uni- versity, Korea.
REFERENCES
1. DeMaria AN. Lies, damned lies, and statistics. J Am Coll Car- diol 2008;52:1430-1.
2. Damaske A, Muxel S, Fasola F, Radmacher MC, Schaefer S, Jabs A, Orphal D, Wild P, Parker JD, Fineschi M, Munzel T, Forconi S, Gori T. Peripheral hemorheological and vascular correlates of coronary blood flow. Clin Hemorheol Microcirc
2011;49:261-9.
3. Lee BK, Durairaj A, Mehra A, Wenby RB, Meiselman HJ, Alexy T. Hemorheological abnormalities in stable angina and acute coronary syndromes. Clin Hemorheol Microcirc 2008;
39:43-51.
4. Hacioglu G, Yalcin O, Bor-Kucukatay M, Ozkaya G, Baskurt OK. Red blood cell rheological properties in various rat hyper- tension models. Clin Hemorheol Microcirc 2002;26:27-32.
5. Carter C, McGee D, Reed D, Yano K, Stemmermann G. Hema- tocrit and the risk of coronary heart disease: the Honolulu Heart Program. Am Heart J 1983;105:674-9.
6. Corti R, Fuster V, Badimon JJ. Pathogenetic concepts of acute coronary syndromes. J Am Coll Cardiol 2003;41(4 Suppl S):7S- 14S.
7. Marossy A, Svorc P, Kron I, Gresova S. Hemorheology and cir- culation. Clin Hemorheol Microcirc 2009;42:239-58.
8. Shin S, Ku YH, Ho JX, Kim YK, Suh JS, Singh M. Progressive impairment of erythrocyte deformability as indicator of micro- angiopathy in type 2 diabetes mellitus. Clin Hemorheol Micro- circ 2007;36:253-61.
9. American Diabetes Association. Standards of medical care in diabetes: 2014. Diabetes Care 2014;37 Suppl 1:S14-80.
10. Singh M, Gersh BJ, McClelland RL, Ho KK, Willerson JT, Pen- ny WF, Holmes DR Jr. Predictive factors for ischemic target vessel revascularization in the Prevention of Restenosis with Tranilast and its Outcomes (PRESTO) trial. J Am Coll Cardiol 2005;45:198-203.
11. Shin S, Ku Y. Hemorheology and clinical application: associa- tion of impairment of red blood cell deformability with diabet- ic nephropathy. Korea Aust Rheol J 2005;17:117-23.
12. Matthews DR, Hosker JP, Rudenski AS, Naylor BA, Treacher DF, Turner RC. Homeostasis model assessment: insulin resis- tance and beta-cell function from fasting plasma glucose and insulin concentrations in man. Diabetologia 1985;28:412-9.
13. Napoli C, Ignarro LJ. Nitric oxide-releasing drugs. Annu Rev Pharmacol Toxicol 2003;43:97-123.
14. Bor-Kucukatay M, Wenby RB, Meiselman HJ, Baskurt OK. Ef- fects of nitric oxide on red blood cell deformability. Am J Physiol Heart Circ Physiol 2003;284:H1577-84.
15. Singh M, Shin S. Changes in erythrocyte aggregation and de- formability in diabetes mellitus: a brief review. Indian J Exp
Biol 2009;47:7-15.
16. Marcinkowska-Gapinska A, Kowal P. Blood fluidity and ther- mography in patients with diabetes mellitus and coronary ar- tery disease in comparison to healthy subjects. Clin Hemorhe- ol Microcirc 2006;35:473-9.
17. Singleton JR, Smith AG, Russell JW, Feldman EL. Microvascu- lar complications of impaired glucose tolerance. Diabetes 2003;
52:2867-73.
18. Ando J, Yamamoto K. Vascular mechanobiology: endothelial cell responses to fluid shear stress. Circ J 2009;73:1983-92.
19. Cade WT. Diabetes-related microvascular and macrovascular diseases in the physical therapy setting. Phys Ther 2008;88:
1322-35.
20. Kesmarky G, Toth K, Habon L, Vajda G, Juricskay I. Hemorhe- ological parameters in coronary artery disease. Clin Hemorhe- ol Microcirc 1998;18:245-51.
21. Cecchi E, Marcucci R, Paniccia R, Bandinelli B, Valente S, Gi- glioli C, Lazzeri C, Gensini GF, Abbate R, Mannini L. Effect of blood hematocrit and erythrocyte deformability on adenosine 5’-diphosphate platelet reactivity in patients with acute coro- nary syndromes on dual antiplatelet therapy. Am J Cardiol 2009;104:764-8.
22. Resmi H, Akhunlar H, Temiz Artmann A, Guner G. In vitro effects of high glucose concentrations on membrane protein oxidation, G-actin and deformability of human erythrocytes.
Cell Biochem Funct 2005;23:163-8.
23. Brown CD, Ghali HS, Zhao Z, Thomas LL, Friedman EA. As- sociation of reduced red blood cell deformability and diabetic nephropathy. Kidney Int 2005;67:295-300.
24. Xue S, Lee BK, Shin S. Disaggregating shear stress: the roles of cell deformability and fibrinogen concentration. Clin Hemorhe- ol Microcirc 2013;55:231-40.
25. Shin S, Nam JH, Hou JX, Suh JS. A transient, microfluidic ap- proach to the investigation of erythrocyte aggregation: the threshold shear-stress for erythrocyte disaggregation. Clin Hemorheol Microcirc 2009;42:117-25.
26. Satoh K. Dipeptidyl peptidase-4 inhibitors: emerging player for vascular protection. Circ J 2013;77:1156-7.
27. Aroor AR, Sowers JR, Jia G, DeMarco VG. Pleiotropic effects of the dipeptidylpeptidase-4 inhibitors on the cardiovascular system. Am J Physiol Heart Circ Physiol 2014;307:H477-92.
Supplementary Table 1. Medical treatment at baseline
Variable AMI– (n=118) AMI+ (n=77) P value
Nitrate 0 8 (10.4) <0.001
Nicorandil 0 5 (7.8) 0.002
Insulin 33 (28.0) 11 (15.6) 0.045
Metformin 65 (55.1) 17 (22.1) <0.001
DPP-4 inhibitor 30 (25.4) 18 (23.4) 0.746
Sulfonylurea 28 (23.7) 13 (16.9) 0.251
Aspirin 25 (21.2) 23 (29.9) 0.169
ADP receptor blocker 8 (6.8) 17 (22.1) 0.002
RAS blockade 49 (41.5) 23 (29.9) 0.099
β-Blocker 0 14 (18.2) <0.001
Calcium channel blocker 23 (19.5) 14 (18.2) 0.820
HMG-CoA reductase inhibitor 41 (34.7) 22 (28.6) 0.361
Vitamin K antagonist 0 3 (3.9) 0.031
Values are presented as number (%).
AMI, acute myocardial infarction; DPP-4, dipeptidyl peptidase-4; ADP, adenosine diphosphate; RAS, renin-angiotensin system; HMG-CoA, 3-hydroxy-3-methylglutaryl coenzyme A.

![Fig. 5. Correlation between the elongation index at 3 Pa and critical shear stress (r=–0.124, P=0.090; black square, acute myocardial infarction [AMI] group; empty square, non-AMI group)](https://thumb-ap.123doks.com/thumbv2/123dokinfo/5221344.123546/6.892.93.809.134.445/correlation-elongation-critical-stress-square-myocardial-infarction-square.webp)
