Potential Association of Triglyceride Glucose Index with Cardiac Autonomic Neuropathy in Type 2 Diabetes Mellitus Patients
Cardiac autonomic neuropathy (CAN) is a common and most neglected complication of diabetes, estimated to be roughly 8% in recently diagnosed patients and greater than 50%
in patients with chronic disease history. The insulin resistance (IR) itself is bidirectionally associated with increased risk of type 2 diabetes mellitus (T2DM) and CAN is a predisposing factor. The primary objective of the present study was aimed to find a correlation of triglyceride glucose index (TyG index) in CAN patients along with the prevalence of CAN in T2DM patients as a secondary objective. This prevalence study was conducted on 202 patients visiting the diabetic clinic of Hamdard Institute of Medical Sciences and Research, Jamia Hamdard (HIMSR) teaching hospital in New Delhi, India who fulfilled the inclusion criteria. The Ewings autonomic function test was used for diagnosis of CAN. TyG index was calculated for patients based on fasting levels of glucose and triglyceride. The CAN was diagnosed in 62 participants out of 202 T2DM patients (overall prevalence 30.7%). The mean ± standard deviation (SD) for TyG index was 10.3 ± 0.2 and 9.5 ± 0.2 in CAN positive, T2DM patients, respectively. The difference of TyG index, in CAN positive and T2DM patients, was highly significant (P < 0.001). Further correlation analysis was performed to find an association of TyG index, duration, and age with patient groups. TyG index showed a positive correlation with heart rate during deep breathing (HRD), heart rate variation during standing (HRS), blood pressure (BP) response to handgrip and BP response to standing. Our finding highlights the TyG index, low-cost IR index, might be useful as an alternative tool for the early screening of patients at a high risk of diabetic neuropathy.
Keywords: Cardiac Autonomic Neuropathy; Type 2 Diabetes Mellitus; Insulin Resistance;
Triglyceride Glucose Index; Autonomic Function Test Md. Akbar,1 Uma Bhandari,2
Anwar Habib,3 and Razi Ahmad4
1Department of Pharmaceutical Medicine, Faculty of Pharmacy, Hamdard University, New Delhi, India;
2Department of Pharmacology, Faculty of Pharmacy, Hamdard University, New Delhi, India; 3Department of Medicine, Hamdard Institute of Medical Sciences and Research, Hamdard University, New Delhi, India;
4Department of Pharmacology, Hamdard Institute of Medical Sciences and Research, Hamdard University, New Delhi, India
Received: 19 December 2016 Accepted: 19 March 2017 Address for Correspondence:
Uma Bhandari, PhD
Department of Pharmacology, Faculty of Pharmacy, Hamdard University, Hamdard Nagar, New Delhi 110062, India E-mail: [email protected]
Funding: Authors are thankful to Sun Pharma, India, for providing partial assistantship under the joint collaboration for PhD program with Hamdard University, India.
https://doi.org/10.3346/jkms.2017.32.7.1131 • J Korean Med Sci 2017; 32: 1131-1138
INTRODUCTION
Diabetic neuropathies are neuroendocrine disorders related to chronic hyperglycemia, affecting nerve fibers of the body part in approximately half of all diabetes patients (1,2). The condi- tion of insulin secretory function, insulin sensitivity, insulin re- sistance (IR), and subsequent hyperinsulinism play a vital role in the pathogenesis of the diabetic complication and the devel- opment of type 2 diabetes mellitus (T2DM) (3,4). Multifactorial interventions, dyslipidemia management including strict glyce- mic control are known to diminish the progression but cannot remove the risk of cardiac autonomic neuropathy (CAN) in pa- tients with T2DM (5-7). High levels of plasma triglycerides (TGs) are a risk marker for cardiovascular disease (CVD), and it has often been related to impaired fasting glucose, T2DM, and dia- betic complication (8-10). Thus, much stress had been placed on controlling hyperglycemia along with hypertension and hy- perlipidemia to prevent and delay the onset of diabetic compli-
cations (11). Recently, the triglyceride glucose index (TyG in- dex), has been suggested in several studies as a simple assess- ment method for metabolic abnormality (12-14). This index is the mathematical product of the fasting blood glucose and TG levels, which correlates with the degree of IR (15).
Recently a report revealed that dyslipidemia and hyperglyce- mia contribute to the development of CAN (16). However, data on the direct relationship between indices and peripheral neu- ropathy in T2DM are lacking, and there is no comparative study regarding IR indices among patients with CAN and T2DM. The majority of studies on the prevalence and associated risk factors of CAN are executed in Western countries in the past.
To the best of our knowledge, none of the previously published studies investigated the TyG index on the presence of CAN with regard to T2DM in Indian population. In this study, we aimed to assess the role of IR indices like TyG index in the development of CAN along with the prevalence of CAN in Indian T2DM pa- tients.
Endocrinology, Nutrition & Metabolism
2017-03-16 https://crossmark-cdn.crossref.org/widget/v2.0/logos/CROSSMARK_Color_square.svg
MATERIALS AND METHODS Study design
It was a prevalence study conducted in a tertiary care setting hospital of Jamia Hamdard. This investigation included 202 pa- tients treated in May 2015 to November 2016. Based on Ewing autonomic function test and symptoms, the patients were di- vided into 2 groups. The first group of 62 subjects consisted of T2DM patients with CAN and was considered as CAN patients group while the other group consisted of 140 T2DM patients without CAN and was considered as non-CAN patients group and 9 patients withdrew from the study due to medical expens- es. The study was conducted in the department of medicine, with both outdoor and indoor patients and patients attending the Hakeem Abdul Hameed Centenary Hospital (HAHC) asso- ciated with Hamdard Institute of Medical Sciences and Resear- ch, Jamia Hamdard (HIMSR). Included subjects were of either sex, above 18 years of age, and had the diagnosis of T2DM. Ex- clusion criteria were heart failure, urinary tract infection, fever, cirrhosis of liver, and prostatitis. Patients were asked to avoid smoking, consumption of coffee, and tea before assessment. All patients had a complete history of neurological symptoms us- ing a semi-structured questionnaire which was documented.
Symptoms like numbness, asleep feeling, burning sensation, deep aching, unsteadiness in walking, unexplained resting tachy- cardia, postural fainting, orthostatic hypotension, sweating, ejac- ulation problems, and other symptoms documented in previ- ous literature were considered for neuropathy symptoms. Ma- nometer, handgrip dynamometer, mouth piece, and electrocar- diography (ECG) machine were used during the autonomic func- tion test.
Clinical feature measurement
Blood pressure (BP) of the participants was measured at the time of recruitment in the sitting position in the right arm by sphygmomanometer (Diamond Deluxe BP apparatus; BP In- struments, Pune, India). Body weight was measured on the same scales in light clothing and no shoes before breakfast, and up- right height was measured on the same wall-mounted stadiom- eter. Individual body mass index (BMI) was then calculated as weight (kg)/height (m2). The right-arm BP of each seated sub- ject was obtained after 10 minutes of rest using a sphygmoma- nometer. A brief prescription detail, ongoing medication, and medical history were recorded for all subjects. A thorough gen- eral and physical examination including the vital data was done for all the subjects. Blood was collected in a fasting state for plas- ma glucose, glycated haemoglobin (HbA1c), lipid profile, and another clinical variable. Quantitative estimation of HbA1c was done by using high performance liquid chromatography (HPLC).
Retinal conditions were assessed by ophthalmologists using a combination of clinical examination.
Neuropathy assessment
Neuropathy testing was performed by the experienced physi- cian and technician according to standardized procedures. Neu- ropathy was assessed using monofilament, pinprick sensations, ankle reflexes, and vibration perception threshold (VPT) test.
Quantification of peripheral neuropathy was assessed by VPT using a Biothesiometer (Proactive Health Inc, Ahmedabad, Gu- jarat, India) by a single observer for all the participants. VPT was then measured at 5 different locations on the both legs. Mono- filament of 10 g is a simple instrument that is used frequently in assessing the loss of protective sensation. It is adjusted in such a way that it takes 10 g of force to buckle. During this test the monofilament was placed perpendicular to the skin site of each foot in such a way that it would not slip and pressure was ap- plied to the filament just buckled with a contact time of 2 sec- onds. Inability to perceive the sensation felt at any one site of each leg was considered loss of protective sensation. In addi- tion, ankle reflexes were also assessed with a percussion ham- mer, and recorded as either present or absent. All tests were conducted on a quiet workbench.
Autonomic function test
Ewings autonomic function test was performed to confirm the diagnosis of CAN. Out of 5 autonomic function tests, 3 of these measurements mainly assessed parasympathetic function heart rate responses to deep breathing (beat-to-beat variation), to stand- ing (30:15 ratio), and to the Valsalva manoeuvre. Sympathetic function was assessed by BP response during posture change and handgrip test (17).
Deep breathing test
The patient laid quietly and breathed deeply at a rate of 6 breaths (expiration and inspiration) per minute and heart rate along with the time elapsing between 2 consecutive R waves in the electrocardiogram (R-R interval) was recorded by ECG. The ra- tio of R-R interval during expiration and inspiration was con- sidered as E:I ratio. The result was then expressed as the mean of the difference between maximum and minimum heart rates for the 6 measured cycles in beats/minute and considered as abnormal response if it is < 10 beats/minute.
Heart rate response to standing
The patient laid quietly and stood up unaided; the heart rate was recorded continuously by ECG. The ‘30:15 ratio,’ which is the ratio of the longest R-R interval (around the 30th beat after starting to stand up) to the shortest R-R interval (around the 15th beat), was then calculated and considered as normal if 30:15 ra- tio was above 1.04.
Valsalva manoeuvre
The patient forcibly exhales into the mouthpiece of a manome-
ter, exerting a pressure of 40 mmHg for 15 seconds. ECG was re- corded continuously in supine position in during the whole pro- cess. The longest and shortest R-R intervals were measured. The mean of 3 Valsalva ratios taken as the final value and considered as normal if the Valsalva ratio above than 1.20
Sympathetic function test BP response to standing
BP was measured while the patients were active in standing po- sition and again when in a supine position. The postural fall in BP was taken as the difference between systolic BP lying and just after standing.
BP response to handgrip test
It consists of variation in BP during handgrip test. After instruc- tions in using handgrip dynamometer, the subject gripped maxi- mally with his dominant arm for 5 minutes, this was repeated thrice. The highest of the 3 readings is called maximum volun- tary contraction (MVC) and considered as abnormal if diastolic blood pressure (DBP) < 10 mmHg.
Patients were classified as CAN positive if any of the above- mentioned tests found abnormalities. Further, CAN patients were classified as the early CAN if 1 of 3 heart rate tests were abnormal, definite CAN if 2 heart rate tests were abnormal and severe CAN if 2 heart rate tests were abnormal + 1 or both BP tests were abnormal (17,18). Later during analysis process non- CAN were specified as stage 0, early CAN as stage 1, definite
CAN as stage 2, and severe CAN as stage 3.
Calculation of TyG index
TyG index was measured with fasting blood glucose and fasting TG level. TyG index were calculated:
TyG index = Ln [fasting TGs (mg/dL) × fasting glucose (mg/dL)/2]
Statistical analysis
The study variables contained both categorical and continuous variables. Frequencies with proportions were represented the categorical variables and scale variables as mean ± standard deviation (SD). All continous variables were tested for normali- ty using the Shapiro-Wilks test. Categorical variables and con- tinuous variable were compared using the χ2 test and Student’s t-test. Kaplan-Meier survival curves were plotted to assess the time taken for CAN development and compared using the log- rank test. The 2-sided critical region with P ≤ 0.05 was consid- ered as statistical significance. All analysis was performed using SPSS ver. 21.0 statistical software (IBM Corp., Armonk, NY, USA).
Ethics statement
The study was conducted in compliance with the declaration of Helsinki and approved by Institutional Review Board (IRB-Ap- proval number-JHIEC-2015(05/15), inform consent: present) of Jamia Hamdard, Hamdard University, New Delhi, India. Writ- ten informed consent was obtained from each patient prior to
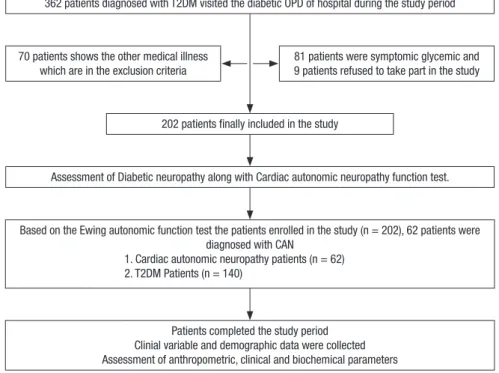
Fig. 1. Flow chart showing the study participants.
T2DM = type 2 diabetes mellitus, OPD = outpatient department.
362 patients diagnosed with T2DM visited the diabetic OPD of hospital during the study period
202 patients finally included in the study
Assessment of Diabetic neuropathy along with Cardiac autonomic neuropathy function test.
Based on the Ewing autonomic function test the patients enrolled in the study (n = 202), 62 patients were diagnosed with CAN
1. Cardiac autonomic neuropathy patients (n = 62) 2. T2DM Patients (n = 140)
Patients completed the study period Clinial variable and demographic data were collected Assessment of anthropometric, clinical and biochemical parameters 70 patients shows the other medical illness
which are in the exclusion criteria
81 patients were symptomic glycemic and 9 patients refused to take part in the study
inclusion in the study and for using their health-related data.
RESULTS
Characteristics of participants
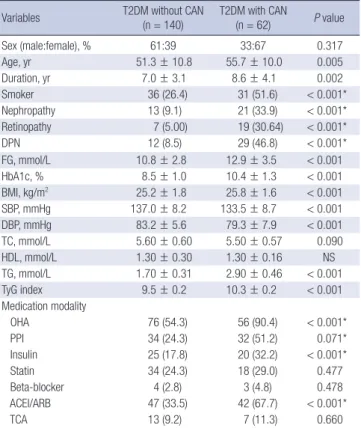
In total, 362 subjects diagnosed with T2DM visited the study centre. A total of 202 patients aged 18–80 (range) years who ful- filled the inclusion criteria were enrolled. The flow diagram of participant inclusion is shown in Fig 1. Comparison of baseline data of the non-CAN and the CAN patients group are shown in Table 1. Demographic and clinical data were collected as fol- lows: age, gender, systolic blood pressure (SBP), DBP, weight, height, and BMI. Weight and height were measured by balance beam scale and tape measure. The mean BMI, SBP, DBP, TG, cholesterol, and fasting blood glucose levels were significantly higher in the CAN patients group (P < 0.001). According to au- tonomic function test results 140 patients (69.30%) out of 202 T2DM patients had 2 scores and categorized as T2DM without CAN, 7 patients (11.29%) out of 62 had 4 scores, were consider- ing as early CAN while 24 (38.70%) out of 62 were considered
definite and 31 (50%) patients out of 62 had more than 5 scores which were categorized as the severe CAN. Over all prevalence of CAN was 30.7% (62 cases), however, it was less than earlier prevalence report conducted in India (19). We also assessed the neuropathy condition in the patients by various tests including monofilament and VPT. Based on cut-off range of Biothesiom- eter (Proactive Health Inc), score of monofilament test and oth- er symptoms, there were 29 patients in the CAN who had dia- betic peripheral neuropathy (DPN) simultaneously. Out of these DPN patients in CAN, one was diagnosed with diabetic foot.
Further more, we found that prevalence of microvascular com- plication (retinopathy, nephropathy, and DPN) in CAN was significantly higher with respect to non-CAN patients group. In addition, TyG index levels did not differ significantly depending on the presence or absence of DPN (TyG index in DPN it was 10.12 vs. 9.79, P = 0.06, in CAN and non-CAN, respectively).
Variation in heart rate during deep breathing (HRD), heart rate variation during standing (HRS), BP variation during posture change and BP variation in the hand grip test were statistically significant when compared to non-CAN with CAN patients group as shown in Table 2. There was a significant difference in medi- cation modalities (insulin, oral hypoglycemic agent, and angio- tensin-converting enzyme inhibitor [ACEI]/angiotensin recep- tor blocker [ARB] intake) among CAN patients and T2DM pa- tients group. Smoking habit was obtained by questionnaire and patients were divided into smokers (present or former) and non- smokers. Out of 202 patients, 67 patients were smokers. Smok- ing was significantly associated with CAN (P < 0.001). The SBP and DBP was significantly (P < 0.001) associated with CAN.
Association of BMI, age, duration, and gender
Mean BMI in our study was found 25.8 ± 1.6 kg/m2, 25.2 ± 1.8 kg/m2 in CAN and non-CAN patients group, respectively. The mean age of subjects was 55.7 ± 10.0 and 51.3 ± 10.2 years in CAN and non-CAN patients group, respectively. Further, we found 3.2% (2 of 62) CAN patients were below 40 years, 22.58%
(14 of 62) CAN patients were between 40–49 years of age group, 27.40% (17 of 62) CAN patients were between 50–59 years of age group, 38.70% (24 of 62) CAN patients were between 60–69 Table 1. Clinical and laboratory profiles of all subjects
Variables T2DM without CAN
(n = 140) T2DM with CAN
(n = 62) P value
Sex (male:female), % 61:39 33:67 0.317
Age, yr 51.3 ± 10.8 55.7 ± 10.0 0.005
Duration, yr 7.0 ± 3.1 8.6 ± 4.1 0.002
Smoker 36 (26.4) 31 (51.6) < 0.001*
Nephropathy 13 (9.1) 21 (33.9) < 0.001*
Retinopathy 7 (5.00) 19 (30.64) < 0.001*
DPN 12 (8.5) 29 (46.8) < 0.001*
FG, mmol/L 10.8 ± 2.8 12.9 ± 3.5 < 0.001
HbA1c, % 8.5 ± 1.0 10.4 ± 1.3 < 0.001
BMI, kg/m2 25.2 ± 1.8 25.8 ± 1.6 < 0.001
SBP, mmHg 137.0 ± 8.2 133.5 ± 8.7 < 0.001
DBP, mmHg 83.2 ± 5.6 79.3 ± 7.9 < 0.001
TC, mmol/L 5.60 ± 0.60 5.50 ± 0.57 0.090
HDL, mmol/L 1.30 ± 0.30 1.30 ± 0.16 NS
TG, mmol/L 1.70 ± 0.31 2.90 ± 0.46 < 0.001
TyG index 9.5 ± 0.2 10.3 ± 0.2 < 0.001
Medication modality
OHA 76 (54.3) 56 (90.4) < 0.001*
PPI 34 (24.3) 32 (51.2) 0.071*
Insulin 25 (17.8) 20 (32.2) < 0.001*
Statin 34 (24.3) 18 (29.0) 0.477
Beta-blocker 4 (2.8) 3 (4.8) 0.478
ACEI/ARB 47 (33.5) 42 (67.7) < 0.001*
TCA 13 (9.2) 7 (11.3) 0.660
Values are mean ± SD or number (%). Data was analyzed using student’s t-test.
T2DM = type 2 diabetes mellitus, CAN = cardiac autonomic neuropathy, DPN = dia- betic peripheral neuropathy, FG = fasting glucose, HbA1c = glycated haemoglobin, BMI = body mass index, SBP = systolic blood pressure, DBP = diastolic blood pres- sure, TC = total cholesterol, HDL = high-density lipoprotein, TG = triglyceride, TyG = triglyceride glucose, OHA = oral hypoglycemic agent, PPI = proton pump inhibitor, ACEI = angiotensin-converting enzyme inhibitor, ARB = angiotensin receptor blocker, TCA = tricyclic antidepressant, NS = not significant, SD = standard deviation.
*Intergroup P value were analyzed by χ2 test.
Table 2. Autonomic function tests in patients with CAN and non-CAN
Variables T2DM without
CAN (n = 140)
T2DM with CAN (n = 62) P value HR response to deep breath 16.10 ± 0.80 9.98 ± 0.70 < 0.001 HR response to standing (R-R ratio) 1.10 ± 0.00 0.96 ± 0.00 < 0.001 HR response to Valsalva 1.3 ± 0.0 1.2 ± 0.0 NS BP response to standing (SBP decrease) 4.7 ± 0.8 7.5 ± 0.8 < 0.001 BP response to handgrip (DBP increase) 16.0 ± 2.7 9.3 ± 0.9 < 0.001 Significance level, P < 0.05.
CAN = cardiac autonomic neuropathy, T2DM = type 2 diabetes mellitus, HR = heart rate, BP = blood pressure, SBP = systolic blood pressure, DBP = diastolic blood pres- sure, NS = not significant.
years of age group and 8.06% (2 of 62) CAN patients were ≥ 70 years of age group. Diabetes duration appeared to be longer in those with CAN group. Forty-three point five four percent (27 of 62) CAN patients were ≤ 5 years of duration of T2DM, 35.48%
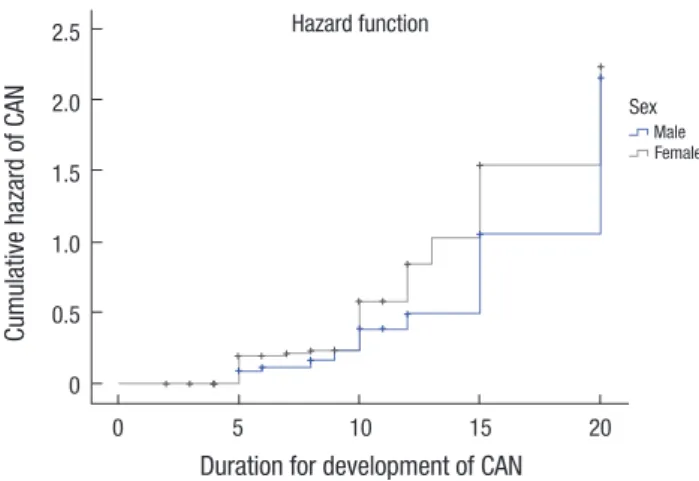
(22 of 62) CAN patients were in the range of 6–10 years of dura- tion of T2DM, 16.12% (10 of 62) CAN patients were in the range of 11–15 years of duration of T2DM and 4.8% (3 out of 62) CAN patients were ≥ 15 years of duration of T2DM. Comparison of mean age at diagnosis of diabetes and duration took for the CAN development made. No significant differences were observed either of sex. Kaplan-Meier analysis (Fig. 2) were plotted to sup- port the previous result as shown in Table 3. Prevalence of CAN in the female patients was found approximately 2 fold than male.
Association of TyG Index with autonomic neuropathy As demonstrated in Table 1, the TyG index was significantly cor- related with CAN (P < 0.001). The mean ± SD for TyG was 10.3
± 0.2 and 9.5 ± 0.2 in CAN and non-CAN patients, respectively.
The difference of TyG index, in CAN and non-CAN patients group was highly significant (P < 0.001). Furthermore, we also find any correlation between TyG index and types of CAN. A significant difference was observed when TyG index of early, definite and severe CAN was compared with T2DM group sep- arately (Table 4).
Pearson’s correlation analysis
A significant association was found between autonomic func- tion parameter and clinical variables (Table 5). The TyG index shows significant correlation with autonomic function test (P <
0.001). Similarly, age factor found to be positively associated with BP variation during the hand grip test. Further, we found that deep breathing also significantly associated with BP varia- tion during posture change.
Multivariate regression analysis
Results of multivariate linear regression are shown in Supple- mentary Table 1 and expressed after adjustment with other vari- able as standardized coefficient β and P value. The TyG index (continuous variable) of the participants as independent risk factor was significantly associated with CAN (β = 0.389; P = 0.005).
The autonomic function test like heart rate response to stand- ing (continuous variable) of the participants showed a slightly significant association with CAN (β = −0.236; P = 0.061). Fur- thermore, retinopathy (categorical variable) of the participants showed a significant association with CAN (β = −0.310; P = 0.025).
Table 3. Sex differences in the age at diagnosis of T2DM (non-CAN) and time gap for CAN development
Variables Female Male P value
Age at the time of diagnosis of non-CAN 43.3 ± 10.7 46.0 ± 9.0 0.145 Age at the time of diagnosis of CAN 55.6 ± 9.6 56.0 ± 11.1 0.622 Time gap between non-CAN and CAN 12.3 ± 0.1 10.0 ± 2.1 0.065 The duration taken for the development of CAN (years). It was calculated by subtract- ing the age at diagnosis of T2DM (non-CAN) from the age at diagnosis of CAN. Data presented as mean ± SD.
T2DM = type 2 diabetes mellitus, CAN = cardiac autonomic neuropathy, SD = standard deviation.
Table 4. The relation of TyG index to category of CAN
Stage Category No. of patients TyG index P value
0 T2DM without CAN 140 9.5 ± 0.2 -
1 Early CAN 7 10.2 ± 0.4 < 0.031*
2 Definite CAN 24 10.3 ± 0.1 < 0.049†
3 Severe CAN 31 10.3 ± 0.3 < 0.034‡
T2DM with CAN specified as stage 0, T2DM with early CAN as stage 1, T2DM with definite CAN were specified as stage 2, T2DM with severe CAN as stage 3.
TyG = triglyceride glucose, CAN = cardiac autonomic neuropathy, T2DM = type 2 di- abetes mellitus.
*P, stage 1 vs. stage 0; †P, stage 2 vs. stage 0; ‡P, stage 3 vs. stage 0.
Table 5. Univariate correlation between cardiac autonomic function tests and TyG index in patients
Variables HRD HRS Valsalva BPS BPH
r P value r P value r P value r P value r P value
TyG index 0.524 < 0.010 0.504 < 0.010 −0.547 < 0.010 0.586 < 0.010 0.431 < 0.010
Age −0.201 < 0.034 −0.150 < 0.022 −0.161 < 0.022 −0.176 0.012 0.275 0.001
Duration −0.126 0.075 −0.103 0.144 −0.192 −0.006 0.159 0.006 0.123 0.080
Correlation result with autonomic function test.
TyG = triglyceride glucose, HRD = heart rate during deep breathing, HRS = heart rate variation during standing, BPS = blood pressure standing, BPH = blood pressure handgrip.
Fig. 2. Kaplan-Meier curves for the period from diagnosis of T2DM to the establish- ment of CAN in men and women.
T2DM = type 2 diabetes mellitus, CAN = cardiac autonomic neuropathy.
Cumulative hazard of CAN
Duration for development of CAN
0 5 10 15 20
2.5
2.0
1.5
1.0
0.5
0
Hazard function
Sex Male Female
DISCUSSION
We investigated whether TyG index is associated with CAN in patients with T2DM. The novel insight of the present study shows that TyG index is potentially elevated in CAN with respect to non-CAN patients group. Our study report shows that there is a significant difference in the TyG index in CAN and non-CAN patients group. In this study, we also found that TyG index sig- nificantly increases in early, definite and severe CAN with re- spect to non-CAN patients group. The results from this study suggest that product of fasting glucose and TG has a significant association with the CAN patients group. Although the patho- physiology regarding the role of IR in diabetic neuropathy is complex, mitochondrial dysfunction has been stated to play a pivotal role in the pathology of IR (20). In addition to that, one of the investigations reported that diabetic parasympathetic neuropathy affects the IR in type 2 diabetic patients (21). It has the potential to be a simple clinical marker of the metabolic syndrome. The finding of the present study could be interesting in search for a sensitive biomarker for diabetic neuropathy and a low-cost IR index (TyG index) may play a vital role in predict- ing the disease course. Further, we found that there was a sig- nificant difference in medication modalities (insulin, oral hy- poglycemic agent, and ACEI/ARB intake) among CAN and non- CAN patients group.
Hyperlipidemia develops in the course of diabetes mellitus, and the late development of an abnormal lipid profile coincides with the delayed encounter and progression of diabetic neu- ropathy (22,23). IR has been observed as a pathogenic compo- nent in diabetic neuropathy for a decade. Longitudinal Roches- ter Study also supports the role of IR in diabetic neuropathy (24).
One of the experimental studies also revealed that insulin defi- ciency is a major component in the diabetic neuropathy due to neurotrophic effects of insulin (25). Earlier investigational re- ports suggest that age, duration of diabetes, and metabolic con- trol has a significant association with CAN progression (26,27).
Our study also suggests that age and duration of diabetes was strongly associated with CAN. The results showed that the prev- alence of CAN was 30.7% however this was lesser as reported in previous study conducted in India (19). Variation in prevalence widely seen in such type of study, which may be due to popula- tion studied, types of diabetes and methodology followed for assessment. The levels of HbA1c, high blood glucose were rela- tively high among CAN and non-CAN patients group in our study because of patients with long standing diabetes. The inci- dence of development of retinopathy, nephropathy, and peri- pheral neuropathy (Triopathy) was relatively high among the CAN patients group. Findings of earlier investigations suggest the high percentage of nephropathy, peripheral neuropathy, retinopathy were found in the study population (27,28). In our study, there was no significant difference in the incidence of the
development of insulin resistant among the different patterns of CAN. In addition to that, no significant differences were ob- served among the CAN with or without presence of other micro vascular complication.
Furthermore, we performed the Pearson’s correlation analy- sis and multivariate linear regression analysis which suggest the positive correlation of TyG index with autonomic function parameter. In addition to that, in our study, besides the CAN evaluation parameter, age, duration was also independently and significantly a risk factor for cardiovascular risk in autono- mic neuropathy. TyG index, a measure of IR was found to be independently and significantly associated with autonomic neuropathy. Previous reports also revealed the high IR indices, age, and other clinical risk factor levels among autonomic neu- ropathy and diabetes mellitus (22,28,29).
Screening parameters specific to nerve related dysfunction in T2DM are not studied much. Limited literature data to auto- nomic neuropathy are available where the emphasis on an al- ternative tool for CAN diagnosis was investigated.
The predicting ability of TyG index has been studied in vari- ous metabolic disorders. This association between atherogenic lipoprotein abnormalities and the development of diabetes was described earlier, which reported that changes in the TyG index over time altered the incidence and risk of diabetes (30). Due to variation in ethnicity and other factors for determining cut-off range of TyG index (31), we have set a cut-off point for TyG in- dex for diabetes risk (TyG index 9) after observing the variation of TyG index in non-CAN and CAN patient groups (32). How- ever, the TyG index was more than the cut point in all T2DM and CAN group. TyG index in the various category of CAN group was significantly high in comparison to T2DM group. However, no significant difference in TyG index was observed when com- pared to either sex in the patients cohort.
Various prospective studies have reported that IR predicts in- cident cardiac disease in both the general and diabetic subjects (33-36). The TyG index has been proposed as a surrogate of IR, in the hyperinsulinemic-euglycemic clamp test and with the homeostasis model assessment of insulin resistance (HOMA- IR) (37). The utility of the TyG index to early identify individuals at risk of diabetes was well described in the past (38). Hence in the present study, we have explored the association of TyG in- dex in CAN.
The ominous impact of long-term poor glycemic control on the development and progression of CAN is now generally ac- cepted. One of the studies has revealed that fasting TGs is sig- nificantly associated with diabetic neuropathy (39). The preva- lence of hypertriglyceridemia has increased and become a ma- jor concern with a growing population with obesity, metabolic syndrome, and T2DM. The previous study has been done with limited sample size focussed on the IR and metabolic disorder including CAN (32,40). In these circumstances TyG index, is a
low-cost alternative that may be a more suitable clinical marker for the diabetes-related metabolic disorder.
Apart from the enthusiastic result, there are some limitations of the present study. It is very difficult to establish the causative relation between CAN and TyG index due to insufficient data as we could not collect the insulin secretion, food habit, and energy consumption. We could not go through plasma catechol- amine or its metabolite for assessing sympathetic autonomic activity.
Despite limitations, the present study demonstrates that TyG index is significantly associated with CAN patients. Our study result revealed that TyG index significantly increased in CAN patients. TyG index has potential impact in neuropathy condi- tion of T2DM patients. Further investigation of TyG index in a larger T2DM population may have a great impact in developing the clinical biomarker for diagnosis and disease progression of CAN.
ACKNOWLEDGMENT
We would like to thank Dr. Bhawani Singh, Professor, Depart- ment of Medicine, Hamdard Institute of Medical Sciences and Research, Jamia Hamdard (HIMSR) and Hakeem Abdul Ha- meed Centenary Hospital (HAHC), Jamia Hamdard, Hamdard University, as well as Mr. Irshad (Assistant Staff at HAHC Hos- pital, Jamia Hamdard) for their enormous help accessing the patients. We would also like to thank all the patients that took part in the present study.
DISCLOSURE
The authors have no potential conflicts of interest to disclose.
AUTHOR CONTRIBUTION
Conceptualization: Habib A, Ahmad R. Data curation: Akbar M.
Investigation: Akbar M, Bhandari U, Habib A. Writing - original draft: Akbar M, Bhandari U. Writing - review & editing: Akbar M, Bhandari U, Habib A, Ahmad R.
ORCID
Md. Akbar https://orcid.org/0000-0002-5117-9413 Uma Bhandari https://orcid.org/0000-0003-2277-9142 Anwar Habib https://orcid.org/0000-0003-3589-8810 Razi Ahmad https://orcid.org/0000-0002-9541-5633
REFERENCES
1. Hinder LM, Vincent AM, Burant CF, Pennathur S, Feldman EL. Bioener- getics in diabetic neuropathy: what we need to know. J Peripher Nerv Syst
2012; 17 Suppl 2: 10-4.
2. Yagihashi S, Mizukami H, Sugimoto K. Mechanism of diabetic neuropa- thy: where are we now and where to go? J Diabetes Investig 2011; 2: 18-32.
3. Kilpatrick ES, Rigby AS, Atkin SL. Insulin resistance, the metabolic syn- drome, and complication risk in type 1 diabetes: “double diabetes” in the Diabetes Control and Complications Trial. Diabetes Care 2007; 30: 707- 12.
4. Choi SH, Hur KY, Kim DJ, Ahn CW, Kang ES, Cha BS, Lim SK, Huh KB, Lee HC. Staged diabetes management according to individual patient in- sulin resistance and beta-cell function ameliorates glycaemic control in type 2 diabetes mellitus. Clin Endocrinol (Oxf) 2008; 69: 549-55.
5. The effect of intensive diabetes therapy on measures of autonomic ner- vous system function in the Diabetes Control and Complications Trial (DCCT). Diabetologia 1998; 41: 416-23.
6. Kuehl M, Stevens MJ. Cardiovascular autonomic neuropathies as compli- cations of diabetes mellitus. Nat Rev Endocrinol 2012; 8: 405-16.
7. Du T, Yuan G, Zhang M, Zhou X, Sun X, Yu X. Clinical usefulness of lipid ratios, visceral adiposity indicators, and the triglycerides and glucose in- dex as risk markers of insulin resistance. Cardiovasc Diabetol 2014; 13:
146.
8. Miselli MA, Nora ED, Passaro A, Tomasi F, Zuliani G. Plasma triglycerides predict ten-years all-cause mortality in outpatients with type 2 diabetes mellitus: a longitudinal observational study. Cardiovasc Diabetol 2014;
13: 135.
9. Di Angelantonio E, Sarwar N, Perry P, Kaptoge S, Ray KK, Thompson A, Wood AM, Lewington S, Sattar N, Packard CJ, et al. Major lipids, apolipo- proteins, and risk of vascular disease. JAMA 2009; 302: 1993-2000.
10. Miller M, Stone NJ, Ballantyne C, Bittner V, Criqui MH, Ginsberg HN, Gold- berg AC, Howard WJ, Jacobson MS, Kris-Etherton PM, et al. Triglycerides and cardiovascular disease: a scientific statement from the American Heart Association. Circulation 2011; 123: 2292-333.
11. Turner RC. The U.K. prospective diabetes study. A review. Diabetes Care 1998; 21 Suppl 3: C35-8.
12. Lee SH, Han K, Yang HK, Kim HS, Cho JH, Kwon HS, Park YM, Cha BY, Yoon KH. A novel criterion for identifying metabolically obese but nor- mal weight individuals using the product of triglycerides and glucose. Nutr Diabetes 2015; 5: e149.
13. Simental-Mendía LE, Rodríguez-Morán M, Guerrero-Romero F. The prod- uct of fasting glucose and triglycerides as surrogate for identifying insulin resistance in apparently healthy subjects. Metab Syndr Relat Disord 2008;
6: 299-304.
14. Lee SH, Kwon HS, Park YM, Ha HS, Jeong SH, Yang HK, Lee JH, Yim HW, Kang MI, Lee WC, et al. Predicting the development of diabetes using the product of triglycerides and glucose: the Chungju Metabolic Disease Co- hort (CMC) study. PLoS One 2014; 9: e90430.
15. Guerrero-Romero F, Simental-Mendía LE, González-Ortiz M, Martínez- Abundis E, Ramos-Zavala MG, Hernández-González SO, Jacques-Camare- na O, Rodríguez-Morán M. The product of triglycerides and glucose, a sim- ple measure of insulin sensitivity. Comparison with the euglycemic-hy- perinsulinemic clamp. J Clin Endocrinol Metab 2010; 95: 3347-51.
16. Tomlin AM, Dovey SM, Tilyard MW. Risk factors for hospitalization due to diabetes complications. Diabetes Res Clin Pract 2008; 80: 244-52.
17. Ewing DJ, Martyn CN, Young RJ, Clarke BF. The value of cardiovascular autonomic function tests: 10 years experience in diabetes. Diabetes Care 1985; 8: 491-8.
18. Bellavere F, Bosello G, Fedele D, Cardone C, Ferri M. Diagnosis and man- agement of diabetic autonomic neuropathy. Br Med J (Clin Res Ed) 1983;
287: 61.
19. Pappachan JM, Sebastian J, Bino BC, Jayaprakash K, Vijayakumar K, Suja- than P, Adinegara LA. Cardiac autonomic neuropathy in diabetes melli- tus: prevalence, risk factors and utility of corrected QT interval in the ECG for its diagnosis. Postgrad Med J 2008; 84: 205-10.
20. Turner N, Heilbronn LK. Is mitochondrial dysfunction a cause of insulin resistance? Trends Endocrinol Metab 2008; 19: 324-30.
21. Takayama S, Sakura H, Katsumori K, Wasada T, Iwamoto Y. A possible in- volvement of parasympathetic neuropathy on insulin resistance in patients with type 2 diabetes. Diabetes Care 2001; 24: 968-9.
22. Kempler P, Tesfaye S, Chaturvedi N, Stevens LK, Webb DJ, Eaton S, Keré- nyi Z, Tamás G, Ward JD, Fuller JH; EURODIAB IDDM Complications Study Group. Autonomic neuropathy is associated with increased car- diovascular risk factors: the EURODIAB IDDM Complications Study. Di- abet Med 2002; 19: 900-9.
23. Young MJ, Boulton AJ, MacLeod AF, Williams DR, Sonksen PH. A multi- centre study of the prevalence of diabetic peripheral neuropathy in the United Kingdom hospital clinic population. Diabetologia 1993; 36: 150- 4.
24. Dyck PJ, Davies JL, Litchy WJ, O’Brien PC. Longitudinal assessment of di- abetic polyneuropathy using a composite score in the Rochester Diabetic Neuropathy Study cohort. Neurology 1997; 49: 229-39.
25. Toth C, Brussee V, Zochodne DW. Remote neurotrophic support of epider- mal nerve fibres in experimental diabetes. Diabetologia 2006; 49: 1081-8.
26. Masaoka S, Lev-Ran A, Hill LR, Vakil G, Hon EH. Heart rate variability in diabetes: relationship to age and duration of the disease. Diabetes Care 1985; 8: 64-8.
27. Ziegler D, Laux G, Dannehl K, Spüler M, Mühlen H, Mayer P, Gries FA.
Assessment of cardiovascular autonomic function: age-related normal ranges and reproducibility of spectral analysis, vector analysis, and stan- dard tests of heart rate variation and blood pressure responses. Diabet Med 1992; 9: 166-75.
28. Kim YK, Lee JE, Kim YG, Kim DJ, Oh HY, Yang CW, Kim KW, Huh W. Car- diac autonomic neuropathy as a predictor of deterioration of the renal function in normoalbuminuric, normotensive patients with type 2 diabe- tes mellitus. J Korean Med Sci 2009; 24 Suppl: S69-74.
29. Chaturvedi N, Sjoelie AK, Porta M, Aldington SJ, Fuller JH, Songini M, Kohner EM; EURODIAB Prospective Complications Study. Markers of insulin re- sistance are strong risk factors for retinopathy incidence in type 1 diabe- tes. Diabetes Care 2001; 24: 284-9.
30. Lee SH, Yang HK, Ha HS, Lee JH, Kwon HS, Park YM, Yim HW, Kang MI, Lee WC, Son HY, et al. Changes in metabolic health status over time and risk of developing type 2 diabetes: a Prospective Cohort Study. Medicine (Baltimore) 2015; 94: e1705.
31. Moon S, Park JS, Ahn Y. The cut-off values of triglycerides and glucose in- dex for metabolic syndrome in American and Korean adolescents. J Ko- rean Med Sci 2017; 32: 427-33.
32. Hosseini SM, Maleki A, Hosseininejad SM, Cardiac autonomic neuropa- thy and two insulin resistance indices. Enliven: Clin Cardiol Res 2014; 1:
006.
33. Jeppesen J, Hansen TW, Rasmussen S, Ibsen H, Torp-Pedersen C, Mads- bad S. Insulin resistance, the metabolic syndrome, and risk of incident cardiovascular disease: a population-based study. J Am Coll Cardiol 2007;
49: 2112-9.
34. Bonora E, Kiechl S, Willeit J, Oberhollenzer F, Egger G, Meigs JB, Bonadon- na RC, Muggeo M. Insulin resistance as estimated by homeostasis model assessment predicts incident symptomatic cardiovascular disease in Cau- casian subjects from the general population: the Bruneck study. Diabetes Care 2007; 30: 318-24.
35. Bonora E, Formentini G, Calcaterra F, Lombardi S, Marini F, Zenari L, Sag- giani F, Poli M, Perbellini S, Raffaelli A, et al. HOMA-estimated insulin re- sistance is an independent predictor of cardiovascular disease in type 2 diabetic subjects: prospective data from the Verona Diabetes Complica- tions Study. Diabetes Care 2002; 25: 1135-41.
36. Bressler P, Bailey SR, Matsuda M, DeFronzo RA. Insulin resistance and coronary artery disease. Diabetologia 1996; 39: 1345-50.
37. Abbasi F, Reaven GM. Comparison of two methods using plasma triglyc- eride concentration as a surrogate estimate of insulin action in nondia- betic subjects: triglycerides × glucose versus triglyceride/high-density li- poprotein cholesterol. Metabolism 2011; 60: 1673-6.
38. Navarro-González D, Sánchez-Íñigo L, Pastrana-Delgado J, Fernández- Montero A, Martinez JA. Triglyceride-glucose index (TyG index) in com- parison with fasting plasma glucose improved diabetes prediction in pa- tients with normal fasting glucose: the Vascular-Metabolic CUN cohort.
Prev Med 2016; 86: 99-105.
39. Wiggin TD, Sullivan KA, Pop-Busui R, Amato A, Sima AA, Feldman EL.
Elevated triglycerides correlate with progression of diabetic neuropathy.
Diabetes 2009; 58: 1634-40.
40. Lee KO, Nam JS, Ahn CW, Hong JM, Kim SM, Sunwoo IN, Moon JS, Na SJ, Choi YC. Insulin resistance is independently associated with peripheral and autonomic neuropathy in Korean type 2 diabetic patients. Acta Dia- betol 2012; 49: 97-103.
Supplementary Table 1. Multiple linear regression analysis for TyG index in CAN
Variables β t P value
Sex (male) −0.153 −1.103 0.275
Age, yr −0.217 −1.550 0.129
Duration, yr −0.049 −0.340 0.735
Fasting blood sugar (mmol/L) 0.124 0.870 0.389
HbA1c 0.030 0.220 0.318
Basal metabolic index 0.077 0.640 0.525
SBP −0.032 −0.230 0.821
DBP −0.036 −0.270 0.784
TC −0.123 −0.840 0.409
HDL −0.062 −0.500 0.622
TG 0.112 0.750 0.456
TyG index 0.389 3.010 0.005
HRD 0.172 1.410 0.165
HRS −0.236 −1.930 0.061
Valsalva −0.133 −1.100 0.277
BPS 0.042 0.290 0.768
BPH 0.072 0.540 0.590
Smoker 0.313 2.149 0.036
Nephropathy 0.188 −0.732 0.468
Retinopathy 0.310 2.309 0.025
DPN 0.013 0.086 0.932
Multivariate regression analysis for relationship between TyG index and CAN after ad- justment of other clinical variables.
TyG = triglyceride glucose, CAN = cardiac autonomic neuropathy, HbA1c = glycated haemoglobin, SBP = systolic blood pressure, DBP = diastolic blood pressure, TC = total cholesterol, HDL = high density lipoprotein, TG = triglyceride, HRD = heart rate dur- ing deep breathing, HRS = heart rate variation during standing, BPS = blood pressure standing, BPH = blood pressure handgrip, DPN = diabetic peripheral neuropathy.