Variation in Serum Creatinine Level Is Correlated to Risk of Type 2 Diabetes
Jun Sung Moon1, Ji Eun Lee2, Ji Sung Yoon1
1Department of Internal Medicine, Yeungnam University College of Medicine, Daegu; 2Department of Internal Medicine, CHA Gumi Medical Center, CHA University, Gumi, Korea
Background: Skeletal muscle is well established as a major target organ of insulin action, and is associated with the pathogenesis of type 2 diabetes. Therefore, we attempted to determine whether a variation in serum creatinine is related to the development of type 2 diabetes and other risk factors for diabetes.
Methods: A total of 2,676 nondiabetic subjects with stable and normal renal function (estimated glomerular filtration rate >60 mL/min/1.73 m2) were followed up for approximately 4.5 years. New onset diabetes was defined as fasting plasma glucose (FPG)
≥7.0 mmol/L, glycated hemoglobin (HbA1c) ≥6.5%, or subjects taking antidiabetic agents. Variation of serum creatinine (ΔCre) was defined as a difference between follow-up and baseline creatinine. In subgroup analysis, body composition was examined by bioelectric impedance analysis method.
Results: A total of 106 subjects were diagnosed with new-onset diabetes during the follow-up period. Baseline serum creatinine was not different between the new-onset diabetes and no diabetes groups. Negative ΔCre (ΔCre <0) showed an association with increased risk of type 2 diabetes after adjusting for age, sex, body mass index, systolic blood pressure, FPG, HbA1c, triglyceride, high density lipoprotein cholesterol, and γ-glutamyl transpeptidase (odds ratio, 1.885; 95% confidence interval, 1.127 to 3.153).
Serum creatinine level demonstrated positive correlation with muscle mass and negative correlation with percentage of body fat in body composition analysis.
Conclusion: Serum creatinine reflected body muscle mass and the decrease of serum creatinine might be regarded as a risk factor for type 2 diabetes.
Keywords: Diabetes mellitus; Risk factors; Creatinine; Muscle mass
INTRODUCTION
Skeletal muscle is one of the major target organs of insulin ac-
tion and the primary site for insulin-mediated glucose uptake in the postprandial state [1-4]. In addition, reduced muscle mass could potentially induce hyperglycemia and insulin resis-
Received: 18 July 2013, Accepted: 26 August 2013 Corresponding authors:
Ji Sung Yoon
Department of Internal Medicine, Yeungnam University College of Medicine, 170 Hyeonchung-ro, Nam-gu, Daegu 705-717, Korea
Tel: +82-53-620-4049, Fax: +82-53-623-8006, E-mail: jsyoon9@ynu.ac.kr Ji Eun Lee
Department of Internal Medicine, CHA Gumi Medical Center, CHA University, 12 Sinsi-ro 10-gil, Gumi 730-728, Korea
Tel: +82-54-450-9700, Fax: +82-54-452-5089, E-mail: chieun@naver.com
Copyright © 2013 Korean Endocrine Society
This is an Open Access article distributed under the terms of the Creative Com- mons Attribution Non-Commercial License (http://creativecommons.org/
licenses/by-nc/3.0/) which permits unrestricted non-commercial use, distribu- tion, and reproduction in any medium, provided the original work is properly cited.
www.e-enm.org
tance [5]. Therefore, skeletal muscle could be an original target for the treatment of metabolic disorders, e.g., insulin resis- tance, glucose intolerance, and type 2 diabetes mellitus [3]. In elderly patients with diabetes, dietary amino acid supplements could antagonize muscle catabolism and glucose derangement, and have been shown to increase insulin sensitivity and de- crease glycated hemoglobin (HbA1c) levels [5]. Serum creati- nine is a breakdown product of creatine phosphate in muscle.
Since the amount of creatinine per unit of skeletal muscle mass is consistent and the breakdown rate of creatine is also consis- tent, plasma creatinine concentration is very stable and is a di- rect reflection of skeletal muscle mass [4,6]. In the Kansai Healthcare Study, lower serum creatinine levels demonstrated an association with an increased risk of type 2 diabetes [4]. A lower volume of skeletal muscle could mean fewer target sites for insulin action and this, in part, may explain the pathogene- sis of type 2 diabetes associated with lower serum creatinine [4]. Accordingly, we attempted to determine whether serum creatinine and its variation are related to development of type 2 diabetes, along with other risk factors for diabetes.
METHODS
This study was conducted retrospectively. Subjects included 2,676 nondiabetic patients aged 18 to 75 years who visited the health care center of Yeungnam University Medical Center between 2001 January 1 and 2003 December 31. These sub- jects were visited again from 2005 January 1 to 2008 Decem- ber 31. The presence of diabetes was determined by fasting plasma glucose (FPG) ≥7.0 mmol/L (n=61), HbA1c ≥6.5%
(n=15), history of diabetes, or taking antidiabetic agents, which was ascertained via questionnaire; subjects with diabe- tes at baseline were excluded (n=20) [7]. We attempted to evaluate the serum creatinine as a surrogate marker of muscle mass under normal and stable renal function. Estimated glo- merular filtration rate (eGFR) was calculated from creatinine using the Modification of Diet in Renal Disease (MDRD) equation, as follows: eGFR=186.3×[serum creatinine (mg/
dL)]-1.154×[age (years)]-0.203×(0.742 if female) [8]. We included chronic kidney disease stage 1 and 2 (eGFR ≥60 mL/min/1.73 m2), and excluded subjects with higher serum creatinine (≥132.6 µmol/L, n=5) or eGFR <60 mL/min/1.73 m2 (n=49) at baseline. Blood samples were collected after an overnight fast (at least 8 hours) at baseline and at the end of the follow-up. Serum creatinine and other routine laboratory blood tests were performed with an automatic Olymphus
AU5400 Analyzer (Olympus Optical, Tokyo, Japan). Serum creatinine was calibrated using the Jaffe method installed on the Olymphus AU5400 Analyzer. A variation of serum creati- nine (ΔCre) was defined as a difference between follow-up and baseline creatinine. FPG was measured using the hexoki- nase method. HbA1c was measured using high performance liquid chromatography (HLC-723G7, Tosoh, Tokyo, Japan).
Serum total cholesterol was measured using an enzymatic col- orimetric method (Kyowa Medex Co., Ltd., Tokyo, Japan).
Serum high density lipoprotein cholesterol (HDL-C) and low density lipoprotein cholesterol was measured using a direct enzymatic assay (Kyowa Medex Co., Ltd.). Body mass index (BMI) was computed from measurements of height and weight, as follows: BMI=body weight (kg)/height (m2). In some sub- jects, we analyzed body composition using the Inbody 720 (Biospace, Seoul, Korea), a multifrequency impedance body composition analyzer. The Inbody 720 uses an 8-point tactile electrode method, measuring resistance at five specific fre- quencies (1, 50, 250, 500 kHz, and 1 MHz) and reactance at three specific frequencies (5, 50, and 250 kHz).
Differences of continuous variables between subjects who were diagnosed with new-onset diabetes and the no diabetes group were analyzed using Student t test for statistical analy- sis. We used linear regression analysis to evaluate correlation between serum creatinine, muscle mass, and percentage of body fat tissue. We used multiple logistic regression analysis and computed odds ratios (ORs) for the incidence of type 2 di- abetes in order to determine the relationship between the inci- dence of type 2 diabetes and variation of serum creatinine. Re- sults were expressed as a mean±SD for continuous variables.
Statistical analyses were performed using SPSS version 18.0 for Windows (IBM Co., Armonk, NY, USA). All statistical tests were two tailed and a P value of less than 0.05 was re- garded as statistically significant. All patients provided in- formed consent, and the study protocol was approved by our local ethics committee, as well as the Institutional Review Board of Yeungnam University Medical Center.
RESULTS
A total of 2,602 nondiabetic subjects were finally included in this study and the mean follow-up duration was 4.5±0.67 years. During the follow-up period, 106 subjects were diag- nosed with diabetes and were categorized into the new-onset diabetes group. A summary of the baseline characteristics of the subjects is shown in Tables 1, 2. Compared with the no di-
abetes group, subjects in the new-onset diabetes group were older, with higher BMI, higher systolic blood pressure (SBP)/
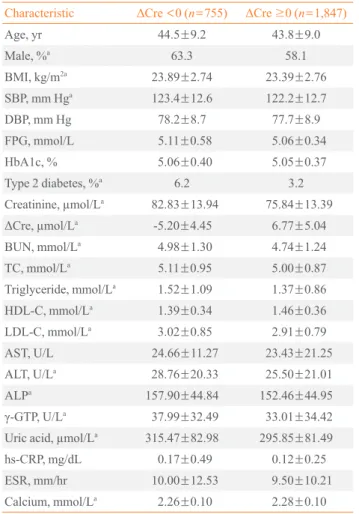
diastolic blood pressures (DBP), higher FPG, and higher HbA1c levels (P<0.05). The baseline serum creatinine level did not differ between the two groups, however, ΔCre was lower in the new-onset diabetes group compared with the no diabetes group (P<0.05). Table 2 shows the differences in characteristics of subjects in the negative ΔCre group (ΔCre
<0) and positive ΔCre group (ΔCre ≥0). Subjects in the nega-
tive ΔCre group (n=755) had higher BMI and SBP. No differ- ence in the baseline fasting blood glucose and HbA1c was ob- served between the two groups. However, more patients in the negative ΔCre group developed type 2 diabetes (P<0.05).
In multivariate regression analysis (Table 3), higher SBP, FPG, HbA1c, and lower HDL-C showed an association with development of type 2 diabetes (P<0.05). After adjusting for age, gender, BMI, SBP and DBP, FPG, HbA1c, triglyceride, HDL-C, and γ-GTP, the decrease of serum creatinine showed Table 1. Characteristics according to Development Status of
Type 2 Diabetes during Follow-Up
Characteristic Development status of type 2 diabetes Yes (n=106) No (n=2,496)
Age, yra 49.9±9.6 43.8±9.0
Male, % 64.2 59.4
BMI, kg/m2a 25.45±2.56 23.45±2.74
SBP, mm Hga 131.6±12.8 122.2±12.5
DBP, mm Hga 83.4±8.5 77.6±8.8
FPG, mmol/La 5.86±0.60 5.04±0.52
HbA1c, %a 5.74±0.38 5.02±0.35
Creatinine, µmol/L 79.98±15.10 77.78±13.86
ΔCre, µmol/La 0.53±7.78 3.42±7.26
Decreased Cre, %a 44.3 28.4
BUN, mmol/La 5.12±1.32 4.80±1.26
TC, mmol/La 5.53±0.97 5.00±0.88
Triglyceride, mmol/La 1.82±0.88 1.39±0.93
HDL-C, mmol/La 1.27±0.30 1.45±0.36
LDL-C, mmol/La 3.43±0.88 2.92±0.80
AST, U/L 28.6±16.5 23.6±19.0
ALT, U/La 37.7±25.9 26.0±20.5
ALPa 173.4±44.7 153.2±44.8
γ-GTP, U/La 50.1±40.9 33.8±33.5
Uric acid, µmol/La 319.5±83.9 300.8±82.3
hs-CRP, mg/dLa 0.27±0.71 0.14±0.32
ESR, mm/hr 12.45±15.11 9.52±10.57
Values are expressed as mean±SD or number (%).
BMI, body mass index; SBP, systolic blood pressure; DBP, diastolic blood pressure; FPG, fasting plasma glucose level; HbA1c, glycated hemoglobin; ΔCre, follow-up serum creatinine level to baseline serum creatinine level; Decreased Cre, follow-up serum creatinine level to baseline serum creatinine level <0; BUN, blood urea nitrogen; TC, total cholesterol; HDL-C, high density lipoprotein cholesterol; LDL- C, low density lipoprotein cholesterol; AST, aspartate aminotransfer- ase; ALT, alanine aminotransferase; ALP, alkaline phosphatase;
γ-GTP, γ-glutamyl transpeptidase; hs-CRP, high-sensitivity C-reactive protein; ESR, erythrocyte sedimentation rate.
aP<0.05.
Table 2. Characteristics according to the Difference of Serum Creatinine between Baseline and Follow-Up Period
Characteristic ΔCre <0 (n=755) ΔCre ≥0 (n=1,847)
Age, yr 44.5±9.2 43.8±9.0
Male, %a 63.3 58.1
BMI, kg/m2a 23.89±2.74 23.39±2.76
SBP, mm Hga 123.4±12.6 122.2±12.7
DBP, mm Hg 78.2±8.7 77.7±8.9
FPG, mmol/L 5.11±0.58 5.06±0.34
HbA1c, % 5.06±0.40 5.05±0.37
Type 2 diabetes, %a 6.2 3.2
Creatinine, µmol/La 82.83±13.94 75.84±13.39
ΔCre, µmol/La -5.20±4.45 6.77±5.04
BUN, mmol/La 4.98±1.30 4.74±1.24
TC, mmol/La 5.11±0.95 5.00±0.87
Triglyceride, mmol/La 1.52±1.09 1.37±0.86
HDL-C, mmol/La 1.39±0.34 1.46±0.36
LDL-C, mmol/La 3.02±0.85 2.91±0.79
AST, U/L 24.66±11.27 23.43±21.25
ALT, U/La 28.76±20.33 25.50±21.01
ALPa 157.90±44.84 152.46±44.95
γ-GTP, U/La 37.99±32.49 33.01±34.42
Uric acid, µmol/La 315.47±82.98 295.85±81.49
hs-CRP, mg/dL 0.17±0.49 0.12±0.25
ESR, mm/hr 10.00±12.53 9.50±10.21
Calcium, mmol/La 2.26±0.10 2.28±0.10
Values are expressed as mean±SD or number (%).
ΔCre, follow-up serum creatinine level to baseline serum creatinine level; BMI, body mass index; SBP, systolic blood pressure; DBP, dia- stolic blood pressure; FPG, fasting plasma glucose level; HbA1c, gly- cated hemoglobin; BUN, blood urea nitrogen; TC, total cholesterol;
HDL-C, high density lipoprotein cholesterol; LDL-C, low density li- poprotein cholesterol; AST, aspartate aminotransferase; ALT, alanine aminotransferase; ALP, alkaline phosphatase; γ-GTP, γ-glutamyl transpeptidase; hs-CRP, high-sensitivity C-reactive protein; ESR, erythrocyte sedimentation rate.
aP<0.05.
www.e-enm.org
an independent association with development of type 2 diabe- tes with an OR of 1.885 (95% confidence interval [CI], 1.127 to 3.153; P=0.015). In male subjects (n=1,551), the OR of nega- tive ΔCre was 2.249 (95% CI, 1.184 to 4.274; P=0.013).
In subgroup analysis using bioelectric impedance analysis (BIA) method, we obtained the lean body mass of 1,067 sub- jects at baseline and 27 cases were identified as newly diag- nosed diabetes. Serum creatinine showed positive correlation with body muscle mass and lean body mass, and negative cor- relation with body fat percentage in linear regression analysis (Fig. 1). Although basal lean body mass was not associated with the risk for incident diabetes, the change of lean body mass was negatively correlated with incident diabetes (P<
0.05). The change of lean body mass was also positively cor- related with the change of serum creatinine (P<0.05). Serum
creatinine was negatively correlated with body fat mass and percent body fat (P<0.05). ΔCre and the change of body fat mass showed marginal correlation, but had no statistical sig- nificance (P=0.05).
DISCUSSION
In this retrospective follow-up study, we found that the varia- tion of serum creatinine is closely associated with age-related sarcopenic changes. Additionally negative ΔCre, that is de- creased creatinine, is independent risk factor of diabetes in healthy subjects with normal renal function.
Reduced muscle mass, or sarcopenia, has been reported as a well-known risk factor for insulin resistance and type 2 diabe- tes [9-12]. Since skeletal muscle is the primary tissue contrib- Table 3. Risk Factors Associated with Development of Type 2 Diabetes
Variable All (n=2,602) Male (n=1,551)
OR (95% CI) P value OR (95% CI) P value
Male sex 0.718 (0.396-1.304) 0.317 - -
Age, 1 yr 0.989 (0.960-1.019) 0.464 0.971 (0.935-1.008) 0.971
Negative ΔCre 1.885 (1.127-3.153) 0.015 2.249 (1.184-4.274) 0.013
BMI, 1 kg/m2 1.096 (0.994-1.208) 0.065 1.136 (0.996-1.295) 0.057
SBP, 1 mm Hg 1.024 (1.002-1.045) 0.029 1.028 (0.998-1.058) 0.064
FPG, 1 mmol/L 3.217 (2.048-5.052) 0.000 2.725 (1.572-4.725) 0.000
HbA1c, 1% 106.56 (44.35-256.05) 0.000 117.41 (40.14-343.39) 0.000
TG, 1 mmol/L 0.847 (0.658-1.090) 0.197 0.806 (0.600-1.083) 0.153
HDL-C, 1 mmol/L 0.191 (0.070-0.519) 0.001 0.234 (0.066-0.831) 0.025
γ-GTP, 1 U/L 1.003 (0.997-1.009) 0.372 1.002 (0.996-1.008) 0.556
OR and P value analyzed by multivariate regression analysis adjusted for age, sex, BMI, SBP, FPG, HbA1c, TG, HDL-C, and γ-GTP.
OR, odds ratio; CI, confidence interval; ΔCre, follow-up serum creatinine level to baseline serum creatinine level; BMI, body mass index; SBP, sys- tolic blood pressure; FPG, fasting plasma glucose level; HbA1c, glycated hemoglobin; TG, triglyceride; HDL-C, high density lipoprotein cholesterol;
γ-GTP, γ-glutamyl transpeptidase.
20.00 40.00 60.00 80.00 125.00
100.00 75.00 50.00 25.00
Creatinine
R2 square=0.458
Muscle mass
20.00 40.00 60.00 80.00 125.00
100.00 75.00 50.00 25.00
Creatinine
R2 square=0.458
Lean body mass
20.00 40.00 60.00 80.00 125.00
100.00 75.00 50.00 25.00
Creatinine
R2 square=0.29
Percent body fat
Fig. 1. Correlation between serum creatinine level, (A) muscle mass, (B) lean body mass, and (C) percentage of body fat tissue by linear regression analysis with 95% mean prediction interval.
A B C
uting to whole body insulin-mediated glucose disposal, sarco- penia may be an important causal factor in age-induced insulin resistance and type 2 diabetes susceptibility [9]. In the study reported by Srikanthan and Karlamangla [13], muscle mass relative to body size might also predict the level of insulin re- sistance and risk of prediabetes. They also revealed that sarco- penia might be an early predictor of diabetes susceptibility in- dependent of obesity in a large population study [9]. Kim et al.
[14] reported that sarcopenic obesity was associated with the risk of metabolic syndrome in a cohort study of Korean sub- jects. Similarly, Lim et al. [15] showed that sarcopenic obesity was more closely correlated with metabolic syndrome than ei- ther sarcopenia or obesity alone. Therefore, serial examina- tions about sarcopenic and obese changes, through analyzing proportions of skeletal muscles and body fat, are presumed to predict diabetes. However, there are some limitations for car- rying those predictions into clinical practice. What the gold standard is still debatable among various instruments to mea- sure muscle mass, strength, and function. Although dual ener- gy X-ray absorptiometry (DEXA) or computed tomography were currently accepted to be gold standard tests for evaluat- ing body composition [16], these methods are not easily ac- cessible and not commonly available to large epidemiologic studies due to time and cost. Additionally, there is not a con- sensus about concepts of sarcopenia and sarcopenic obesity, and it is unclear which definition is most powerful to predict prognosis [17]. Recently the European Working Group on Sar- copenia in Older People suggested a practical definition using the concepts of muscle mass and function [18], but that also has limitations. This criteria is not accepted widely, and inap- propriate to apply other ethnicities, including Asians.
We hypothesized that variation of serum creatinine might be related to change of insulin sensitivity, and predict the risk of type 2 diabetes. Serum creatinine concentration is simple, cheap, and widely used for evaluation of renal function, and is known to be a very stable surrogate marker of skeletal muscle mass [4,6,19]. Previous studies have reported correlations of total plasma creatinine with lean body mass, estimated anthro- pometrically using BIA or DEXA [20-22]. According to Harita et al. [4], lower serum creatinine increased the risk of type 2 diabetes in their large cohort study. In a large cohort study of chronic kidney disease patients receiving hemodialysis, an in- crease in lean body mass accompanied by a parallel increase in muscle mass was associated with survival benefit [23].
Consistent with these results, we found that serum creatinine was positively associated with muscle mass and had inverse
relationship with percentage of body fat in subgroup analysis using BIA. The variation of serum creatinine also may imply the change of lean body mass, as we expected. The incidence of type 2 diabetes was higher in the negative ΔCre group, even though the baseline creatinine level did not differ between the groups. Taken together, subjects with similar creatinine level at baseline may have different risk of diabetes and negative ΔCre is also considered to independent risk factor of diabetes.
Serial follow-up of serum creatinine could be alternative for repetitive body composition analysis.
Oterdoom and his colleagues [24] demonstrated that low muscle mass, as reflected by low creatinine excretion, was as- sociated with major adverse cardiovascular events and all cause mortality in general populations. They reported that their results were independent of insulin sensitivity, compo- nents of the metabolic syndrome, and inflammation. However, muscle mass measured by urinary creatinine excretion was positively associated with fasting insulin and components of metabolic syndrome. Also, diabetes was not associated with lower creatinine excretion in both male and female subjects.
The authors explained that insulin is an anabolic hormone, so subjects with higher muscle masses may have higher insulin concentrations. When comparing our results, the discrepancies might be come from differing methods to assess muscle mass (urinary creatinine excretion vs. serum creatinine level), but further studies are needed to clarify the differences in results.
Female gender tended to have lower skeletal muscle mass than male. Intuitionally, gender differences might be consid- ered when using serum creatinine as a surrogate marker of muscle mass. A large cohort study of Japanese men [4] report- ed that low serum creatinine increased the risk of type 2 diabe- tes, but the investigators did not include females. They sug- gested the results may differ in women because of their lower levels of skeletal muscle mass. Serum creatinine, as a risk fac- tor of diabetes, was more closely associated in male than fe- males in our study. These findings suggest that variation of creatinine can differ depending on gender, and gender differ- ences should be considered and weighed practically.
Our study had several limitations. Firstly, given that serum creatinine closely related with skeletal muscle mass, it could be influenced by numerous factors such as drugs and other di- etary factors. We tried to eliminate confounding factors through questionnaires at baseline, but could not exclude ex- ogenous factors during follow-up periods. Secondly, this was a retrospective observational study and the numbers of partici- pants were relatively small for single center recruitment.
www.e-enm.org
Thirdly, some cases of undetermined diabetes might have ex- isted since postprandial plasma glucose levels and 75 g oral glucose tolerance tests were not checked. Additionally, the variation of creatinine could be surrogate of insulin resistance but not reflect insulin secretory function, so β-cell failure-an- other main cause of diabetes-was overlooked. We did not check C-peptide or islet cell autoantibodies, so it is difficult to predict occurrence of diabetes by progressive β-cell failure, such as late adult onset of diabetes. Finally, direct comparisons between insulin resistance indexes (i.e., homeostasis model assessment-estimated insulin resistance, quantitative insulin sensitivity check index, etc.) and creatinine level were not conducted in our subjects.
In summary, the results of this study showed that serum cre- atinine could be used as a surrogate marker of skeletal muscle mass, and the decrease of serum creatinine over time might be regarded as a risk factor for type 2 diabetes. Therefore, moni- toring of serum creatinine can be helpful in prediction and as- sessment of type 2 diabetes risk. In order to determine and confirm these results, large-scale prospective randomized con- trolled trials will be needed in the future.
CONFLICTS OF INTEREST
No potential conflict of interest relevant to this article was re- ported.
REFERENCES
1. DeFronzo RA, Jacot E, Jequier E, Maeder E, Wahren J, Fel- ber JP. The effect of insulin on the disposal of intravenous glucose: results from indirect calorimetry and hepatic and femoral venous catheterization. Diabetes 1981;30:1000-7.
2. DeFronzo RA, Gunnarsson R, Bjorkman O, Olsson M, Wahren J. Effects of insulin on peripheral and splanchnic glucose metabolism in noninsulin-dependent (type II) dia- betes mellitus. J Clin Invest 1985;76:149-55.
3. DeFronzo RA. Lilly lecture 1987. The triumvirate: beta- cell, muscle, liver: a collusion responsible for NIDDM.
Diabetes 1988;37:667-87.
4. Harita N, Hayashi T, Sato KK, Nakamura Y, Yoneda T, Endo G, Kambe H. Lower serum creatinine is a new risk factor of type 2 diabetes: the Kansai healthcare study. Dia- betes Care 2009;32:424-6.
5. Solerte SB, Fioravanti M, Locatelli E, Bonacasa R, Zam- boni M, Basso C, Mazzoleni A, Mansi V, Geroutis N, Gaz-
zaruso C. Improvement of blood glucose control and insu- lin sensitivity during a long-term (60 weeks) randomized study with amino acid dietary supplements in elderly sub- jects with type 2 diabetes mellitus. Am J Cardiol 2008;
101(11A):82E-88E.
6. Kaplan LA, Pesce AJ, Kazmierczak SC. Clinical chemis- try: theory, analysis, correlation. 4th ed. St. Louis: Mosby;
2003.
7. American Diabetes Association. Standards of medical care in diabetes: 2010. Diabetes Care 2010;33 Suppl 1:S11-61.
8. Levey AS, Bosch JP, Lewis JB, Greene T, Rogers N, Roth D. A more accurate method to estimate glomerular filtra- tion rate from serum creatinine: a new prediction equation:
modification of diet in Renal Disease Study Group. Ann Intern Med 1999;130:461-70.
9. Srikanthan P, Hevener AL, Karlamangla AS. Sarcopenia exacerbates obesity-associated insulin resistance and dys- glycemia: findings from the National Health and Nutrition Examination Survey III. PLoS One 2010;5:e10805.
10. Dominguez LJ, Barbagallo M. The cardiometabolic syn- drome and sarcopenic obesity in older persons. J Cardio- metab Syndr 2007;2:183-9.
11. Atlantis E, Martin SA, Haren MT, Taylor AW, Wittert GA;
Members of the Florey Adelaide Male Ageing Study. In- verse associations between muscle mass, strength, and the metabolic syndrome. Metabolism 2009;58:1013-22.
12. Kim TN, Park MS, Lim KI, Yang SJ, Yoo HJ, Kang HJ, Song W, Seo JA, Kim SG, Kim NH, Baik SH, Choi DS, Choi KM. Skeletal muscle mass to visceral fat area ratio is associated with metabolic syndrome and arterial stiffness:
the Korean Sarcopenic Obesity Study (KSOS). Diabetes Res Clin Pract 2011;93:285-91.
13. Srikanthan P, Karlamangla AS. Relative muscle mass is in- versely associated with insulin resistance and prediabetes:
findings from the third National Health and Nutrition Ex- amination Survey. J Clin Endocrinol Metab 2011;96:2898- 903.
14. Kim TN, Yang SJ, Yoo HJ, Lim KI, Kang HJ, Song W, Seo JA, Kim SG, Kim NH, Baik SH, Choi DS, Choi KM.
Prevalence of sarcopenia and sarcopenic obesity in Korean adults: the Korean sarcopenic obesity study. Int J Obes (Lond) 2009;33:885-92.
15. Lim S, Kim JH, Yoon JW, Kang SM, Choi SH, Park YJ, Kim KW, Lim JY, Park KS, Jang HC. Sarcopenic obesity:
prevalence and association with metabolic syndrome in the Korean Longitudinal Study on Health and Aging (KLoSHA).
Diabetes Care 2010;33:1652-4.
16. Haderslev KV, Haderslev PH, Staun M. Accuracy of body composition measurements by dual energy x-ray absorpti- ometry in underweight patients with chronic intestinal dis- ease and in lean subjects. Dyn Med 2005;4:1.
17. Choi KM. Sarcopenia and sarcopenic obesity. Endocrinol Metab 2013;28:86-9.
18. Cruz-Jentoft AJ, Baeyens JP, Bauer JM, Boirie Y, Ceder- holm T, Landi F, Martin FC, Michel JP, Rolland Y, Schnei- der SM, Topinkova E, Vandewoude M, Zamboni M; Euro- pean Working Group on Sarcopenia in Older People. Sar- copenia: European consensus on definition and diagnosis:
report of the European Working Group on Sarcopenia in Older People. Age Ageing 2010;39:412-23.
19. Patel SS, Molnar MZ, Tayek JA, Ix JH, Noori N, Benner D, Heymsfield S, Kopple JD, Kovesdy CP, Kalantar-Zadeh K.
Serum creatinine as a marker of muscle mass in chronic kidney disease: results of a cross-sectional study and re- view of literature. J Cachexia Sarcopenia Muscle 2013;4:
19-29.
20. Schutte JE, Longhurst JC, Gaffney FA, Bastian BC, Blomqvist CG. Total plasma creatinine: an accurate mea-
sure of total striated muscle mass. J Appl Physiol 1981;51:
762-6.
21. Donadio C, Halim AB, Caprio F, Grassi G, Khedr B, Maz- zantini M. Single- and multi-frequency bioelectrical im- pedance analyses to analyse body composition in mainte- nance haemodialysis patients: comparison with dual-ener- gy X-ray absorptiometry. Physiol Meas 2008;29:S517-24.
22. Keshaviah PR, Nolph KD, Moore HL, Prowant B, Emer- son PF, Meyer M, Twardowski ZJ, Khanna R, Ponferrada L, Collins A. Lean body mass estimation by creatinine ki- netics. J Am Soc Nephrol 1994;4:1475-85.
23. Kalantar-Zadeh K, Streja E, Kovesdy CP, Oreopoulos A, Noori N, Jing J, Nissenson AR, Krishnan M, Kopple JD, Mehrotra R, Anker SD. The obesity paradox and mortality associated with surrogates of body size and muscle mass in patients receiving hemodialysis. Mayo Clin Proc 2010;85:
991-1001.
24. Oterdoom LH, Gansevoort RT, Schouten JP, de Jong PE, Gans RO, Bakker SJ. Urinary creatinine excretion, an indi- rect measure of muscle mass, is an independent predictor of cardiovascular disease and mortality in the general pop- ulation. Atherosclerosis 2009;207:534-40.