J Korean Soc Radiol 2018;78(4):235-241 https://doi.org/10.3348/jksr.2018.78.4.235
INTRODUCTION
CT venography (CTV) is being increasingly used to diagnose DVT or other venous pathology, because it offers a rapid and available alternative to sonography (1). In previous studies, CTV was reported to have 89–97% sensitivity and 94–100%
specificity for the detection of deep vein thrombosis (DVT) of
the pelvis and lower extremities (2-4). Due to concerns associ- ated with ionizing radiation exposure, several dose reduction methods have been developed by CT manufacturers (5). Re- cently, lower tube voltages have been applied to reduce radia- tion dose during CT acquisition, and other methods, such as tube current modulation and the usages of noise reduction fil- ters and a higher pitch, have also been shown to be effective (6).
Comparison of Image Qualities of 80 kVp and 120 kVp CT
Venography Using Model-Based Iterative Reconstruction at Same Radiation Dose
동일한 방사선량에서 모델기반 반복재구성법을 사용한 80 kVp와 120 kVp의 전산화단층 정맥조영술의 영상 품질에 대한 비교
Hyun Jung Baek, MD
1, Ki Seok Choo, MD
1*, Kyung Jin Nam, MD
1, Jae-Yeon Hwang, MD
1, Ji Won Lee, MD
2, Jin You Kim, MD
2, Hyuk Jae Jung, MD
31Department of Radiology, Research Institute for Convergence of Biomedical Science and Technology, Pusan National University Yangsan Hospital, Pusan National University School of Medicine, Yangsan, Korea
2Department of Radiology, Pusan National University Hospital, Busan, Korea
3Department of Vascular Surgery, Pusan National University Yangsan Hospital, Pusan National University School of Medicine, Yangsan, Korea
Purpose: To compare image qualities of 80 kVp CT venography (CTV) and 120 kVp CTV by model-based iterative reconstruction (MBIR) at the same radiation dose.
Materials and Methods: Sixty-nine patients that underwent CTV using 80 kVp (36 patients, group 1) or 120 kVp (33 patients, group 2) with MBIR at the same radia- tion dose were enrolled, and objective and subjective image qualities were assessed independently by two radiologists.
Results: Mean vascular enhancement and contrast-to-noise ratio were significantly higher in group 1 than in group 2 for inferior vena cavas, femoral veins, and popli- teal veins (p < 0.001), and there was significantly lower objective image noise in group 1 (p < 0.001). Subjective analysis revealed image quality was significantly higher in group 1 and image noise was significantly higher in group 2 (p < 0.001). Mean dose-length products was not significantly lower in group 1 (356.1 ± 153.7 mGy cm) than in group 2 (370.1 ± 77.1 mGy cm) (p = 0.635).
Conclusion: CTV at 80 kVp with MBIR is a better protocol than CTV at 120 kVp with MBIR at the same radiation dose.
Index terms Radiation Dosage
Multidetector Computed Tomography Lower Extremity
Veins
Received June 8, 2017 Revised July 25, 2017 Accepted August 18, 2017
*Corresponding author: Ki Seok Choo, MD Department of Radiology, Research Institute for Convergence of Biomedical Science and Technology, Pusan National University Yangsan Hospital, Pusan National University School of Medicine, 20 Geumo-ro, Mulgeum-eup, Yangsan 50612, Korea.
Tel. 82-55-360-1840 Fax. 82-55-360-1848 E-mail: [email protected]
This is an Open Access article distributed under the terms of the Creative Commons Attribution Non-Commercial License (http://creativecommons.org/licenses/by-nc/4.0) which permits unrestricted non-commercial use, distri- bution, and reproduction in any medium, provided the original work is properly cited.
However, lower tube voltages, such as, 80 kVp, have not been widely applied to CTV, because of increased image noise and reduced image quality of the standard filtered back projection (FBP) algorithm at low doses (7, 8). According to recent stud- ies, CTV at 80 kVp with model-based iterative reconstruction (MBIR) and automatic tube current modulation (ACTM) were used to maintain image quality and reduce radiation dose and provided acceptable image quality for the evaluation of DVT, and was superior to FBP (9, 10). Furthermore, the use of 80 kVp CTV has been shown to result in significantly higher ve- nous attenuation than that of conventional 120 kVp CTV (11).
The degree of venous enhancement on CTV is important for DVT detection, and a low tube voltage CTV protocol offers a promising alternative method for increasing venous attenua- tion without increasing the amount of intravascular iodine (1).
Thus, the purpose of this study was to compare the image qual- ities and radiation doses of 80 kVp and 120 kVp CTV of the lower extremity using MBIR at the same noise index levels.
MaTeRIalS aND MeThODS
Patient Selection
This retrospective study was approved by our Institutional Re- view Board (05-2017-056), which waived the requirement for informed consent. From May 2014 to January 2015, 69 consec- utive patients that visited our department underwent CTV at 80 kVp (group 1, 36 patients, 12 men, mean age 58 ± 13.1, May 2014 to August 2014) or 120 kVp (group 2, 33 patients, 14 men, mean age 57.5 ± 16.9, September 2014 to January 2015) at the same noise index level were enrolled. Because we applied 80 kVp protocol since September 2014. Images were reconstructed using MBIR to evaluate DVT or varicose veins. The body mass indices (BMIs) of the patients in group 1 (80 kVp) and group 2 (120 kVp) were 26.7 ± 3.6 kg/m2 and 25 ± 4.1 kg/m2, respective- ly (p > 0.05).
CT Protocols
All patients underwent scanning with a 64-detector CT (Dis- covery 750 HD, GE Healthcare, Waukesha, WI, USA). CTV was performed in the craniocaudal direction from the T12 level to tips of toes during a single inspiratory breath-hold. The detailed acquisition parameters were; 80 kVp (group 1) or 120 kVp (group
2); ATCM; section thickness, 3 mm; reconstruction increment, 2 mm, and noise index 21, according to previous study (9). CTV was initiated 4 minutes after completing the intravenous injec- tion of nonionic iodinated contrast medium (350 mg I/mL, Io- bitridol, Xenetix, Guerbet, Villepinte, France) using an auto- mated pump at a rate of 3 mL/s through an antecubital vein and a subsequent 0.9% saline (25 mL) flush at the same flow rate. The total amount of injected contrast material was adjust- ed according to body weight (2 mL/kg, maximum: 120 mL).
Image Analysis
All contrast-enhanced CT images were interfaced directly with our picture archiving and communications system (PACS) (Maroview; Marotech, Seoul, Korea), and image analysis was performed using transverse images with a window level of 40 Hounsfield unit (HU) and a window width of 400 HU (9). All images were independently reviewed for image quality and noise by two experienced radiologists, with 2 years and 18 years of experiences interpreting CTV, unaware imaging parameter settings. Quantitative analysis of vascular enhancement and noise were performed to compare objective image qualities us- ing attenuation values and standard deviations of the inferior vena cava (IVC) at the level of the left renal vein, right femoral vein (FV) at the level of the femoral head, and right popliteal vein (PopV) at the level of the popliteal fossa. In cases of throm- bus in one side vein, measurements were performed on the contralateral side vein. Regions of interest (ROIs) were used to measure mean vein attenuation values. Readers independently placed ROIs on each vein and included at least two thirds of vessel diameters in order to estimate vascular enhancements and standard deviations in same slices using identical ROIs.
The readers also measured contrast-to-noise ratio (CNR) for each vein, by placing a 90–110 mm2 circular ROI in homoge- neous subcutaneous fat at the mid-level of the medial thigh and in adductor muscle. CNR was defined as (VHU – MHU) / FSD (where VHU and MHU are the attenuation values of the targeted vein and adductor muscle, and FSD is subcutaneous fat noise) (12). Sub- jective image quality evaluations were performed independent- ly by another two radiologists, with 8 years and 15 years of ex- periences interpreting CTV. Axial images were reviewed without protocol information. These two radiologists evaluated the four image sets of each reconstructed series (IVC at the level of the left
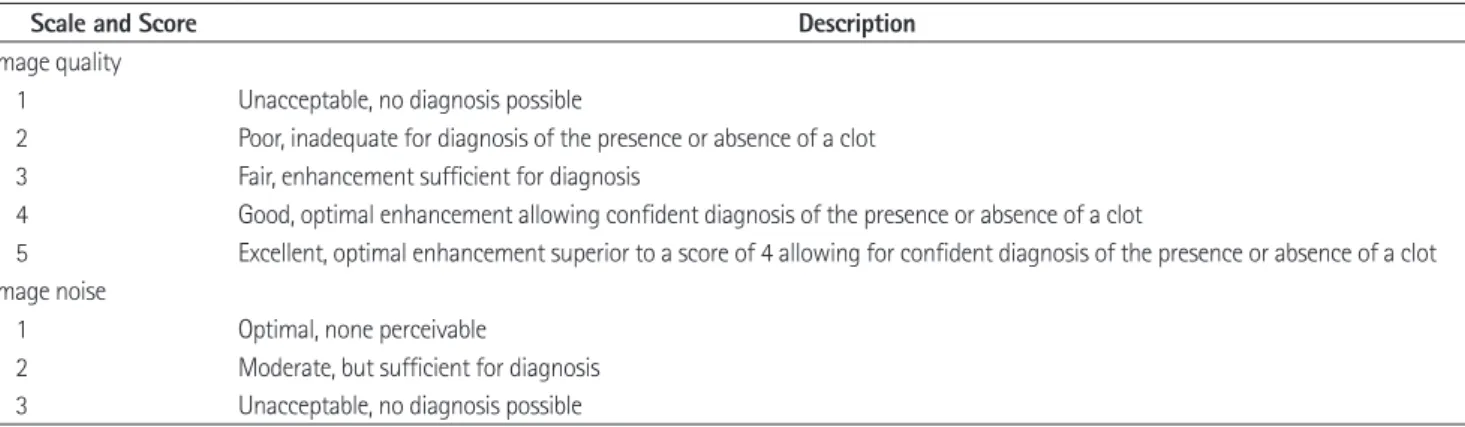
renal vein, right common iliac vein at the L5 vertebral level, right FV at the level of the femoral head, and right PopV at the knee joint level) and scored overall image quality and image noise in- dependently using 3- or 5- point scales, respectively (Table 1).
Evaluation of Radiation Dose
Dose-length products (DLPs; a CT radiation dose descriptor) were provided by the scanner system. Total scanned distance was also recorded.
Statistical Analysis
The analysis was performed using SPSS software ver. 22.0 (IBM Corp., Armonk, NY, USA). The chi-square test was used to compare ages and sex distributions in groups 1 and 2. The Student’s t-test was used to compare the two groups with re- spect to BMI and objective and subjective data. Statistical sig-
nificance was accepted for p-values < 0.05. Cohen’s Kappa Co- efficient (CKC) was used to determine inter-observer agreements for objective and subjective assessments. CKCs values of 0.00–
0.20 were described as slight agreement, of 0.21–0.40 as fair agreement, of 0.41–0.60 as moderate agreement, of 0.61–0.80 as substantial agreement, and of 0.81–1.00 as almost perfect agreement (Table 2).
ReSUlTS
Overall patient characteristics are shown in Table 3. No sta- tistically significant differences in age, sex, BMI, and mean DLP were observed between patients and controls. Of the 69 pa- tients, 17 had DVT (group 1 : 8 patients, group 2 : 9 patients) and 12 had varicose veins (group 1 : 6 patients, group 2 : 6 patients).
Group 1 had significantly higher values in IVCs, FVs, and PopVs than group 2 (p < 0.001). Mean attenuation values of IVCs were 157.2 ± 19.3 HU in group 1 and 111.7 ± 18.8 HU in group 2; for FVs values were 154.6 ± 21.2 HU in group 1 and 110.8 ± 15.3 HU in group 2; and for PopVs values were 154.2 ± 30.4 HU in group 1 and 115.5 ± 15.3 HU in group 2 (Table 4).
Also, mean CNR in group 1 was significantly higher than in group 2 (p < 0.001). Mean CNRs for IVCs were 7 ± 2.8 in group 1 and 5.2 ± 1.7 in group 2; for FVs were 6.8 ± 2.8 in group 1 and 5.2 ± 1.7 in group 2; and for PopVs were 6.8 ± 3.3 in group 1 and 5.7 ± 1.9 HU in group 2 (p < 0.001). Moreover, in group 2, objective image noise in all measured veins was significantly higher than in group 1 (p < 0.001) (Table 4). Mean objective im- age noise in IVCs were 11.2 ± 1.4 in group 1 and 13.5 ± 4.11 in group 2; in FVs were 10.1 ± 2.1 in group 1 and 12.5 ± 2.6 in group 2; and in PopVs were 10.4 ± 2.5 in group 1 and 12 ± 3.6 Table 1. Scales Used for the Subjective Scoring of Image Quality Characteristics
Scale and Score Description
Image quality
1 Unacceptable, no diagnosis possible
2 Poor, inadequate for diagnosis of the presence or absence of a clot 3 Fair, enhancement sufficient for diagnosis
4 Good, optimal enhancement allowing confident diagnosis of the presence or absence of a clot
5 Excellent, optimal enhancement superior to a score of 4 allowing for confident diagnosis of the presence or absence of a clot Image noise
1 Optimal, none perceivable
2 Moderate, but sufficient for diagnosis 3 Unacceptable, no diagnosis possible
Table 2. Cohen Kappa Coefficients of Interobserver Agreements
Characteristics Level Kappa
Objective analysis
Vascular enhancement IVC 0.98
FV 0.96
PopV 0.97
Image noise IVC 0.75
FV 0.71
PopV 0.51
CNR IVC 0.69
FV 0.66
PopV 0.70
Subjective analysis
Image quality 0.64
Image noise 0.65
CNR = contrast-to-noise ratio, FV = femoral vein, IVC = inferior vena cava, PopV = popliteal vein
HU in group 2. Subjective image qualities as assessed by both readers were significantly higher in group 1, and subjective im- age noise assessed by both readers was significantly higher in group 2 (p = 0.635) (Table 5).
The CKC of vascular enhancement was almost perfect; of ob- jective image noise was substantial; and of CNR was substan- tial; and CKCs for subjective image quality and subjective im- age noise were also substantial. Mean DLP in group 1 (356.1 ± 153.7 mGy cm) was not significant lower than in group 2 (370.1
± 77.1 mGy cm).
DISCUSSION
In this study, 80 kVp CTV showed significantly greater ve- nous enhancement and CNR than 120 kVp CTV, as evidenced by objective image quality, and significantly better overall sub- jective image quality. Contrast is increased at low tube voltage
because the application of lower tube voltage increases the pho- toelectric effect and decreases Compton scattering, which leads to a higher mean iodine attenuation value (13, 14). Therefore, low tube voltage CTV protocols can improve vascular enhance- ment at the same concentration of intravascular iodine and bet- ter detect DVT. However, lowering tube kVp not only increases the iodine attenuation level but also lowers the total energy flux, and thus, increases image noise, which might degrade image quality (15). Ertl-Wagner et al. (16) reported lower diagnostic confidence for CT angiography of the brain at 80 kVp than at 120–140 kVp. Recent technical developments include image re- construction algorithms that improve and optimize data pro- cessing and enable radiation dose reduction while maintaining diagnostic image quality (17, 18). Several authors have reported significant dose reductions of up to 80% for various parts of the body for low dose CT with MBIR (7, 19-21). ACTM systems have been developed by CT manufacturers to improve image quality consistency and control the dose absorbed (22). ACTM is based on the fact image noise is determined by X-ray quan- tum noise in transmitted beam projections (10). This technique aims to modulate tube current based on regional body anatomy to adjust X-ray quantum noise and maintain constant image noise with improved dose efficiency (10). This is why we used ATCM at a noise index level of 21, as in our opinion it maintains Table 5. Subjective Analysis Results
Characteristics Readers Group 1 Group 2 p-Value Image quality R1 4.33 ± 0.60 4.11 ± 0.71 < 0.001 R2 4.42 ± 0.83 4.28 ± 0.81 < 0.001 Image noise R1 1.21 ± 0.42 1.31 ± 0.47 < 0.001 R2 1.18 ± 0.39 1.22 ± 0.48 < 0.001 Results are presented as means ± standard deviations.
R1 = reader 1, R2 = reader 2 Table 4. Objective Analysis Results
Characteristics Level Group 1 Group 2 p-Value
Vascular enhancement (HU) IVC 157.2 ± 19.3 111.7 ± 18.8 < 0.001
FV 154.6 ± 21.2 110.8 ± 15.3 < 0.001
PopV 154.2 ± 30.4 115.5 ± 15.3 < 0.001
Image noise (HU) IVC 11.2 ± 1.4 13.5 ± 4.11 < 0.001
FV 10.1 ± 2.1 12.5 ± 2.6 < 0.001
PopV 10.4 ± 2.5 12 ± 3.6 < 0.001
CNR IVC 7 ± 2.8 5.2 ± 1.7 < 0.001
FV 6.8 ± 2.8 5.2 ± 1.7 < 0.001
PopV 6.8 ± 3.3 5.7 ± 1.9 < 0.001
Results are presented as means ± standard deviations.
CNR = contrast-to-noise ratio, FV = femoral vein, HU = Hounsfield unit, IVC = inferior vena cava, PopV = popliteal vein Table 3. Patient Characteristics and Radiation Doses
Characteristics Group 1 (n = 36) Group 2 (n = 33) p-Value
Age (mean ± SD, years) 58 ± 13.1 57.5 ± 16.9 0.715
Sex (F:M) 24:12 19:14 0.890
BMI (mean ± SD, kg/m2) 26.7 ± 3.6 25 ± 4.1 0.111
DLP (mean ± SD, mGy cm) 356.1 ± 153.7 370.1 ± 77.1 0.635
BMI = body mass index, DLP = dose-length product, SD = standard deviation
diagnostic image quality and offers the advantage of dose re- duction. In this study, objective and subjective image noise were significantly lower at 80 kVp. Therefore, we applied MBIR and ACTM in both groups at the same noise index in order to improve image quality and reduce radiation dose, and all imag- es produced were acceptable for diagnostic purposes. Further- more, we found the 80 kVp protocol resulted in significantly better subjective and objective image quality than the 120 kVp protocol at the same noise index level (Fig. 1). Mean DLP was
higher in the 120 kVp group, but no significant difference was noted. Interobserver agreement with respect to vascular en- hancement evaluation in both groups showed almost perfect agreement, and subjective analysis showed substantial interob- server agreement. These findings suggested that the technique used was reproducible. The present study had several limita- tions that warrant consideration. First, it was limited by its ret- rospective nature and by the relatively small number of patients enrolled. Thus, we suggest a large-scale prospective study be
Fig. 1. Comparison of vascular enhancement (mean) and image noise (SD). (A) 60-year-old female patient that underwent CTV at 80 kVp, and (B) 79-year-old female patient that underwent CTV at 120 kVp. The 80 kVp images showing better objective vascular enhancement, and lower image noise levels. The contrast-to-noise ratio in (A) was higher than in (B). (A) IVC-7.6, FV-6.7, PopV-7.7, (B) IVC-3.3, FV-3.9, PopV-3.3.
CTV = CT venography, FV = femoral vein, IVC = inferior vena cava, PopV = popliteal vein, SD = standard deviation
A B
conducted to confirm our findings. Second, diagnostic accura- cies in the two study groups were not compared. We suggest these issues be evaluated in future studies. In conclusion, CTV at 80 kVp with MBIR and ACTM provided better overall diag- nostic image quality, vascular enhancement, and CNR than were obtained using the 120 kVp protocol at same radiation dose. Therefore, we propose 80 kVp CTV with MBIR might be considered as a potentially optimal protocol for evaluations of DVT or other venous pathologies in clinical practice.
RefeReNCeS
1. Cho ES, Chung JJ, Kim S, Kim JH, Yu JS, Yoon CS. CT venog- raphy for deep vein thrombosis using a low tube voltage (100 kVp) setting could increase venous enhancement and reduce the amount of administered iodine. Korean J Radiol 2013;14:183-193
2. Loud PA, Katz DS, Klippenstein DL, Shah RD, Grossman ZD.
Combined CT venography and pulmonary angiography in suspected thromboembolic disease: diagnostic accuracy for deep venous evaluation. AJR Am J Roentgenol 2000;
174:61-65
3. Duwe KM, Shiau M, Budorick NE, Austin JH, Berkmen YM.
Evaluation of the lower extremity veins in patients with suspected pulmonary embolism: a retrospective compari- son of helical CT venography and sonography. 2000 ARRS Executive Council Award I. American Roentgen Ray Soci- ety. AJR Am J Roentgenol 2000;175:1525-1531
4. Byun SS, Kim JH, Kim YJ, Jeon YS, Park CH, Kim WH. Eval- uation of deep vein thrombosis with multidetector row CT after orthopedic arthroplasty: a prospective study for com- parison with Doppler sonography. Korean J Radiol 2008;
9:59-66
5. Liu L. Model-based iterative reconstruction: a promising al- gorithm for today's computed tomography imaging. J Med Imag Radiat Sci 2014;45:131-136
6. Kalra MK, Maher MM, Blake MA, Lucey BC, Karau K, Toth TL, et al. Detection and characterization of lesions on low-ra- diation-dose abdominal CT images postprocessed with noise reduction filters. Radiology 2004;232:791-797
7. Ichikawa Y, Kitagawa K, Nagasawa N, Murashima S, Saku- ma H. CT of the chest with model-based, fully iterative re-
construction: comparison with adaptive statistical iterative reconstruction. BMC Med Imaging 2013;13:27
8. Nelson RC, Feuerlein S, Boll DT. New iterative reconstruc- tion techniques for cardiovascular computed tomography:
how do they work, and what are the advantages and disad- vantages? J Cardiovasc Comput Tomogr 2011;5:286-292 9. Kim JH, Choo KS, Moon TY, Lee JW, Jeon UB, Kim TU, et al.
Comparison of the image qualities of filtered back-projec- tion, adaptive statistical iterative reconstruction, and mod- el-based iterative reconstruction for CT venography at 80 kVp. Eur Radiol 2016;26:2055-2063
10. Kalra MK, Maher MM, Toth TL, Schmidt B, Westerman BL, Morgan HT, et al. Techniques and applications of automatic tube current modulation for CT. Radiology 2004;233:649- 657
11. Fujikawa A, Matsuoka S, Kuramochi K, Yoshikawa T, Yagi- hashi K, Kurihara Y, et al. Vascular enhancement and image quality of CT venography: comparison of standard and low kilovoltage settings. AJR Am J Roentgenol 2011;197:838- 843
12. Kulkarni NM, Sahani DV, Desai GS, Kalva SP. Indirect com- puted tomography venography of the lower extremities us- ing single-source dual-energy computed tomography: ad- vantage of low-kiloelectron volt monochromatic images. J Vasc Interv Radiol 2012;23:879-886
13. Nakayama Y, Awai K, Funama Y, Hatemura M, Imuta M, Na- kaura T, et al. Abdominal CT with low tube voltage: prelim- inary observations about radiation dose, contrast enhance- ment, image quality, and noise. Radiology 2005;237:945- 951
14. Curry TS, Dowdey JE, Murry RC. Christensen's physics of diagnostic radiology. 4th ed. Philadelphia, PA: Lippincott Williams & Wilkins 1990
15. Wintersperger B, Jakobs T, Herzog P, Schaller S, Nikolaou K, Suess C, et al. Aorto-iliac multidetector-row CT angiography with low kV settings: improved vessel enhancement and simultaneous reduction of radiation dose. Eur Radiol 2005;
15:334-341
16. Ertl-Wagner BB, Hoffmann RT, Bruning R, Herrmann K, Sny- der B, Blume JD, et al. Multi-detector row CT angiography of the brain at various kilovoltage settings. Radiology 2004;
231:528-535
17. Gunn ML, Kohr JR. State of the art: technologies for com- puted tomography dose reduction. Emerg Radiol 2010;
17:209-218
18. Thibault JB, Sauer KD, Bouman CA, Hsieh J. A three-dimen- sional statistical approach to improved image quality for multislice helical CT. Med Phys 2007;34:4526-4544 19. Pickhardt PJ, Lubner MG, Kim DH, Tang J, Ruma JA, del Rio
AM, et al. Abdominal CT with model-based iterative recon- struction (MBIR): initial results of a prospective trial com- paring ultralow-dose with standard-dose imaging. AJR Am J Roentgenol 2012;199:1266-1274
20. Vardhanabhuti V, Loader RJ, Mitchell GR, Riordan RD, Roobot- tom CA. Image quality assessment of standard- and low- dose chest CT using filtered back projection, adaptive sta-
tistical iterative reconstruction, and novel model-based iterative reconstruction algorithms. AJR Am J Roentgenol 2013;200:545-552
21. Miéville FA, Gudinchet F, Brunelle F, Bochud FO, Verdun FR.
Iterative reconstruction methods in two different MDCT scanners: physical metrics and 4-alternative forced-choice detectability experiments--a phantom approach. Phys Med 2013;29:99-110
22. Brisse HJ, Madec L, Gaboriaud G, Lemoine T, Savignoni A, Neuenschwander S, et al. Automatic exposure control in multichannel CT with tube current modulation to achieve a constant level of image noise: experimental assessment on pediatric phantoms. Med Phys 2007;34:3018-3033
동일한 방사선량에서 모델기반 반복재구성법을 사용한 80 kVp와 120 kVp의 전산화단층 정맥조영술의 영상 품질에 대한 비교
백현정
1· 추기석
1* · 남경진
1· 황재연
1· 이지원
2· 김진유
2· 정혁재
3목적: 동일한 방사선량에서 모델기반 반복재구성법(이하 MBIR)을 사용한 80 kVp와 120 kVp의 전산화단층 정맥조영술 (이하 CTV) 영상 품질에 대해 비교하였다.
대상과 방법: 동일한 방사선량에서 MBIR을 사용하여 80 kVp (36명, 1군) 또는 120 kVp (33명, 2군)로 하여 CTV를 시 행한 환자 69명을 대상으로 하여, 두 명의 영상의학과 의사가 독립적으로 객관적 그리고 주관적 영상 품질 평가를 수행하 였다.
결과: 평균 혈관 조영과 신호대잡음비는 하대정맥, 대퇴정맥, 오금정맥에서 2군보다 1군에서 유의하게 높았고, 객관적 영상 잡음은 1군에서 유의하게 낮았다(p < 0.001). 주관적 평가에서 1군의 영상 질이 유의하게 높았고, 영상 잡음은 2군 에서 유의하게 높았다(p < 0.001). 평균 선량길이곱은 2군(370.1 ± 77.1 mGy cm)보다 1군(356.1 ± 153.7 mGy cm) 이 더 낮았지만, 통계적 유의성은 없었다(p = 0.635).
결론: 동일한 방사선량에서 MBIR을 사용한 80 kVp CTV의 영상이 120 kVp CTV 영상보다 우수하다.
1부산대학교 의과대학 양산부산대학교병원 영상의학과, 의생명융합연구소, 2부산대학교병원 영상의학과,
3부산대학교 의과대학 양산부산대학교병원 혈관외과