1. Introduction
Increased mobility and human activities today, especially in the telecommunications sector, makes the demand for smartphones also become higher. Cellular phones, which in the last one to two decades, are known as lux goods are now changing parallel to primary products. That is in line with food needs and human settlements. This progress in the field of telecommunications has also made many new
* First Author, Associate Professor Faculty of Economics, Universitas Bosowa, Indonesia.
** Associate Professor, Department of Management, Politeknik Negeri Ujung Pandang, Indonesia.
*** Corresponding Author, Assistant professor, Faculty of Economics and Business, Department of Management, Universitas Muslim Indonesia, Indonesia.
Tel: +62-822-9222-2243, Email: [email protected].
© Copyright: Korean Distribution Science Association (KODISA)
This is an Open Access article distributed under the terms of the Creative Commons Attribution Non-Commercial License (https://creativecommons.org/licenses/by-nc/4.0/) which permits unrestricted non-commercial use, distribution, and reproduction in any medium, provided the original work is properly cited.
industries emerge to present their superior products in the form of cellular phones. Including Samsung, which was once known as the electronics industry, such as TV also expanded one of its business activities that entered the cellular phone and smartphone industries. Even in Indonesia, the presence of smartphones and mobile phones of Samsung brands is the most widely used brand by the people of Indonesia. Data recorded Samsung smartphone market share in the second quarter (Q2) of 2017 at 30%
and is the market leader. In various aspects to support profit for the company and amid competition, the role of marketing strategy is increasingly important because it is the spearhead of every company. Therefore, to meet the needs of consumers and meet the challenges of an increasingly competitive business world, integrated market development is needed (Marjanova et al., 2015). Progress in terms of company performance can be achieved with a strategy of the marketing mix that is carried out appropriately and effectively (Blut, Teller, & Floh, 2018). The conceptual marketing mix includes components such as products, prices, distribution channels and promotions. With so many Print ISSN: 1738-3110 / Online ISSN 2093-7717
http://dx.doi.org/10.15722/jds.17.10.201910.17
The Impact of Product Quality, Price, and Distribution on Satisfaction and Loyalty
Muhammad YUSUF
*, NURHILALIA
**, Aditya Halim Perdana Kusuma PUTRA
***Received: August 22, 2019. Revised: September 03, 2019. Accepted: October 05, 2019.
Abstract
Purpose - This research investigates the old marketing mix approach to satisfaction and loyalty from the perspective of research subjects of Samsung brand smartphone cases through empirical testing involving product quality, price, distribution channel variables as antecedent variables.
Research design, data, and methodology - This study emphasizes the empirical/quantitative concept by using a survey as a data collection tool. The number of samples used was 179 eligible respondents who used Samsung smartphone devices for more than five years. Statistical testing tools use PLS with several testing stages such as the classical assumption test to the hypothesis testing stage.
Results - The nine hypotheses proposed, as many as two hypotheses were proposed, namely intervening relationships involving Price and Distribution channel variables on customer satisfaction and customer loyalty.
Conclusions - Product quality is the essential component affecting customer satisfaction and loyalty while distribution channel is a complementary component that is no less important to measure the extent to which customer satisfaction expectations and customer loyalty are realized for the product quality of the products that have been produced and marketed. The price component is not the only reason to make consumers satisfied and loyal.
Keywords: Product Quality, Price, Distribution Channel, Satisfaction, Loyalty, Samsung Product.
JEL Classifications: M0, M1, M31.
competitors engaged in the same field, the company must also be able to create an opportunity that has not been created by competitors to survive during such competition (Ramlawati & Putra, 2018). In the process of growth and fierce competition, companies must be able to meet the needs and desires of consumers by providing maximum service(Kim & Yoo, 2015).
The many components that need to be addressed, especially for companies engaged in the manufacturing sector, product quality is a subject that must be considered because it has a direct effect on customer satisfaction (Bacile, Wolter, Allen, & Xu, 2018). The product produced by thecompany becomes very important for customers because it becomes a benchmark whether the customer can be loyal or not(Abdulfattah, 2012). Today every company/
organization should be obliged to orient to customers because customers are one way of the company in winning competition in the market(Narver & Slater, 1990; Józsa, 2017; Torres et al., 2015). On the other hand, improving product quality will undoubtedly have an impact on price-fixing, an anomaly in decisions by marketing managers, operational managers and financial managers is located in the problem of determining the selling price of a product.
Setting a selling price is not easy, but it must be accompanied by steps to make a planned and controlled production management, so many things must be considered in terms of setting the selling price(Kotler, Armstrong, &
Kotler, 2010; Cao, Gruca, & Klemz, 2003). Quality improvement means an increase in product prices, a dilemmatic condition that must be faced by many marketing managers and company management that improper pricing can cause losses, can be a loss for the company created by setting low prices so that the company's profit margins become small or the risk of losing consumers caused by the high between products versus competitor products. In line with increasingly significant product quality improvements and to meet consumer expectations regarding economical prices, companies must always be responsive to the environment and environmental changes, both changes in the external environment and changes in the internal environment.
Ruiz Díaz (2017) His research found that there was a strong relationship between customer satisfaction and customer loyalty mediated by customer retention. The service verycarefully influences the main factors that cause positive or negative satisfaction and loyalty attributes factor.
Emotional variable approaches such as Image, expectations, perceived quality, and perceived value are applied in research (Bayraktar, et al., 2012) and (Lu, Wu, & Hsiao, 2019), also shows something similar to research Ruiz Díaz, (2017). While the striking difference in research is the use of old marketing mix variable also shows something similar to research. Furthermore, in this study, that is no less important to be able to introduce products to the community is also supported by elements of the distribution channel.
The distribution channel is a structure that describes the
alternative pathway chosen to market the product(Mehta et al., 2010). Distribution channels can also describe a company's marketing situation. Just knowing that a product is useful is not a guarantee that the buyer will always be loyal to the product. Another requirement that needs to be met and considered so that buyers can be faithful to the product is to increase the awareness of the consumer. The purpose of business activities is to satisfy consumer desires because consumers are the only reason for life and growth.
This reason causes customer satisfaction to be a top priority for the company. The consumers want quality products at not only relatively affordable prices but also convenience to get a product. Consumer satisfaction is a critical factor for predicting consumer behaviour and more specifically is a repeat purchase(Cui, Mrad, & Hogg, 2018; Unal & Aydı¥n, 2013). Objectively this study examines the model of the direct or indirect relationship of determinant factors that influence customer loyalty and satisfaction so that it can provide a standard formula in terms of developing a scientific theory of marketing strategy in theory and managerial implication.
2. Literature Review
2.1. Product Quality and Price on Satisfaction and Loyalty
Marketing is a social and managerial process by which a person or group gets what they need and want through the creation and exchange of products and values with other parties(Kotler, 2009: 118). The purpose of marketing studies is to make customer satisfaction more optimal through a variety of integrated marketing strategies. The level of satisfaction of a consumer is a function of the difference between performance and expectations. Kotler, Kartajaya, and Setiawan (2016) States consumers who are satisfied during the transaction process of goods or services obtained, It is likely they will come back again and make other purchases and will also recommend to friends or family about the company and its products. Of course, customer satisfaction can be achieved through improving service quality and product quality. Product quality is the main focus in the company, and quality is an essential policy in increasing competitiveness. Products must give satisfaction to consumers exceeding or at least the same as the quality of products from competitors. Factors that affect product quality, in terms of the quality of a product produced by a company sometimes experience diversity.
That is caused by the quality of a product that is influenced by several factors, where these factors include: People, Management, Capital and also the transfer of technology that is implemented in the form of machinery or work equipment. The purpose of marketing activities are 1) To
find market balance, 2) give satisfaction to consumers(Kotler et al., 2010; Eskildsen & Kristensen, 2008). States that product quality also has a positive and significant effect on customer satisfaction and customer loyalty. Even the statement stated by Ismail, Khatibi, and Thiagarajan (2003) it also clearly states that product quality is reflected through the price of the product, product quality is essential in shaping customer satisfaction.
In essence, purchasing decisions are based on a number of fundamental things, namely the existence of cultural and social class factors and for reasons of social factors including the presence of reference groups, environmental influences, the role of status and position, and the existence of elements in one's own person such as the influence of age, occupation of economic conditions and lifestyle, in addition to that, things that can influence purchasing decisions are also due to motivation, role and perception influence. Rationally, the purchase decision factor is influenced by several factors that are tangible, such as product quality(Hsu & Lin, 2015). Product quality is an essential policy in increasing company competitiveness as a form of achieving competitive advantage(Dodds, Monroe, &
Grewal, 1991; Bonadonna, 2010). Product quality is everything that a producer can offer to be considered, and is used by consumers as a means of meeting one's needs or desires because product quality is an overall combination of product characteristics resulting from marketing, engineering, production and maintenance strategies that make these products usable meet customer expectations (Chen & Gayle, 2019). Product quality components consist of performance, features, reliability, conformance, durability, serviceability, aesthetics, and perceived quality. Various studies state that product quality has a significant effect on customer satisfaction decisions and consumer loyalty, i.e., (Kim & Shim, 2014; Haming et al., 2019; Nisar & Prabhakar, 2017; Ridha, Perdana, & As’ ad, 2018) although on the other hand, an increase in product quality can undoubtedly have an impact on production costs (Granero, 2019). Quality products have an essential role in shaping customer satisfaction. The more quality the products and services provided, the higher the pleasure felt by the customer, then it can lead to profits for producers. Likewise, if there is no satisfaction, it can result in customers moving to another product because product quality is closely related to customer loyalty (Kotler, 2012). One of the factors that influence customer satisfaction is price, where customers' perception that the suitability of prices will reflect the quality (Miyatake, Nemoto, Nakaharai, & Hayashi, 2016). Price becomes a consumer's assessment of the magnitude of the sacrifice with what will be obtained from products and services (Zeithaml, Parasuraman, & Malhotra, 2002). Prior research has validated the importance of consumer delight and satisfaction for explaining consumer loyalty i.e (Drennan et al., 2015; Allen, Muñoz, & Ortúzar, 2018). Satisfaction is a cognitive evaluation of a service pleasurable consumption
fulfillment, satisfaction is the "key emotional response (Ahrholdt, Gudergan, & Ringle, 2019). empirically states that one of the crucial factors in ensuring customer satisfaction is the pricing strategy (Abdul, 2013; Cao et al., 2003; Yoon &
Kang, 2005; Kauffman, Lee, Lee, & Yoo, 2009) where the role of price has its impact on potential customers and also becomes a separate strategy for the company (Lin, 2013).
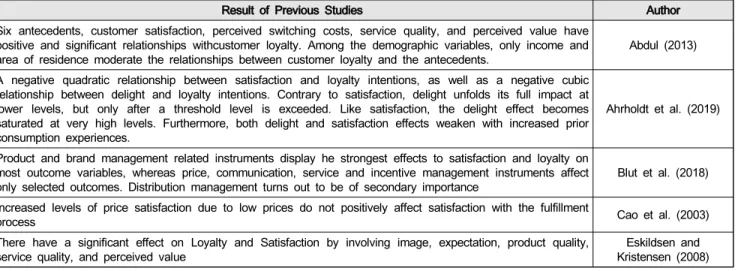
Table 1 shows some of the results of previous studies regarding the relationship between consumer satisfaction and loyalty. In connection with what has been explained in the literature review, the hypothesis building can be determined as below:
H1 : Product quality has a positive and significant effect on customer satisfaction.
H2 : Product quality has a positive and significant effect on customer loyalty
H3 : Product quality affects customer loyalty by making customer satisfaction an intervening variable
H4 : Price has a positive and significant effect on customer satisfaction
H5 : Price has a positive and significant effect on customer satisfaction by making customer satisfaction an intervening variable
2.2. Distribution Channel on Satisfaction and Loyalty
Efforts to increase customer satisfaction and loyalty can also be realized if supported by the selection of a proper product distribution channel. Because distribution has a vital role in the movement of goods from producers to end consumers or end-users. One crucial factor in smoothing the flow of goods and services distribution from producers and consumers in choosing the right distribution channel (Channel of distribution) used in the business of products and services distribution. So that what is the goal of the company can be achieved following what has been planned and predetermined. Errors in selecting distribution channels can slow down and can even occur bottlenecks in the supply of goods and services from producers to consumers.Describes the product distribution including 1) transportation, which is choosing the right way to move goods to a place far away. 2) logistics and warehousing, which is storing goods temporarily, waiting temporarily, to be ol dor shipped.
3) central inventory, namely the selection of alternative storage of products that must be centralized or distributed.
4) material handling, namely the range of the right tool to move goods to the nearest place, such as a counter. 5) border processing, which is the activity of determining the conditions of delivery, preparing documents. And 6) protective packaging, namely the determination of the container/place of goods to avoid the various losses that arise during shipment. So the hypothesis building framework states that there is a significant relationship between increasing product quality, price, and distribution to
increasing customer satisfaction and customer loyalty (Monique, 2017). In the current era of distribution channels play an essential role, especially in the use of the internet as a modern alternative in terms of increasing sales. (Pötzl, 2000), Distribution channels are also part of the form of service quality and guarantee customer satisfaction and loyalty(Gil Saura, Ruiz Molina, & Servera Francés, 2008;
Mehta et al., 2010; Tor, 1997). Based on the description, the hypothesis proposed is:
H6 : Distribution Channel has a positive and significant effect on customer satisfaction
H7 : Distribution channel has a positive and significant effect on consumer loyalty
H8 : Distribution channel has a positive and significant effect on customer loyalty by making customer satisfaction an intervening variable
H9 : Customer satisfaction has a positive and significant effect on customer loyalty
3. Research Design and Measurement 3.1. Samples
This study took samples from Samsung smartphone users as many as 179 respondents who have used Samsung smartphones for more than five years —collecting data using online survey in Makassar City in the period from September 2018 - April 2019. Respondent demographic data is detailed in table 3. Respondent data consisted of gender (61.5% female and 38.5% male), respondent age (55.6%
age range 18-25 years, 15.7% age 26-33 years, 14.6% age range 34-41 years, 12.4% age range 41-48 years and 1.7%
age range above 48 years). Furthermore, most respondents were single or not married (61.9%), and 38.1% were
married. Based on the latest level of education graduated (42.5% senior high school, 22.3% Bachelor, 23.5% master, 8.4% diploma, and 3.4% doctoral). Based on employment status (59.8% others, 12.8% private employees, 14%
entrepreneurs, 12.8% civil servant or military, 0.6% SOE).
The dominant respondents came from the age group of 18-25 years as many as 99 people (55.6%) of the data obtained. Given the data collection using online surveys in the city of Makassar, Indonesia, so it is assumed that in the age range of 18-25 years more internet users.
3.1. Measurement
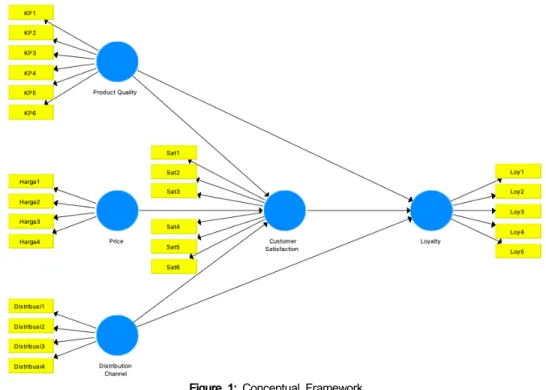
Measurement of items and research variables using the Likert scale 1-5 (strongly disagree - agree), testing this research goes through several stages of processes including testing nomological validity items / variables using SPSS then testing the goodness of fit to the hypothesis testing using the PLS analysis test (Partial Least Square) with an intervening measurement model. The assessment of the goodness of fit model passes several criteria such as AVE value, Cronbach alpha value, and Composite Reliability (CR)> 0.6. SRMR <0.08, NFI> 0.9. Overall the conceptual framework regarding items and variables in this study is complexly illustrated, as shown in Figure 1, while a detailed description of items and variables is explained in table 2.
Figure 1. explainsthe composition of independent and dependent variables consisting of product quality variables comprising six i.e., constructs, (product usability, aesthetic value, features, suitability, reliability, and product durability).
The price variable consists of four constructs, i.e., (price affordability, price conformity with product quality, price competitiveness, price suitability with product benefits). The distribution channel variable consists of four constructs, i.e.
(strategic location, use of e-commerce access, sustainable availability of goods, order process that is not difficult).
Table 1: Previous Studies on the relationship between satisfaction and loyalty
Result of Previous Studies Author
Six antecedents, customer satisfaction, perceived switching costs, service quality, and perceived value have positive and significant relationships withcustomer loyalty. Among the demographic variables, only income and
area of residence moderate the relationships between customer loyalty and the antecedents. Abdul (2013) A negative quadratic relationship between satisfaction and loyalty intentions, as well as a negative cubic
relationship between delight and loyalty intentions. Contrary to satisfaction, delight unfolds its full impact at lower levels, but only after a threshold level is exceeded. Like satisfaction, the delight effect becomes saturated at very high levels. Furthermore, both delight and satisfaction effects weaken with increased prior consumption experiences.
Ahrholdt et al. (2019)
Product and brand management related instruments display he strongest effects to satisfaction and loyalty on most outcome variables, whereas price, communication, service and incentive management instruments affect
only selected outcomes. Distribution management turns out to be of secondary importance Blut et al. (2018) Increased levels of price satisfaction due to low prices do not positively affect satisfaction with the fulfillment
process Cao et al. (2003)
There have a significant effect on Loyalty and Satisfaction by involving image, expectation, product quality,
service quality, and perceived value Eskildsen and
Kristensen (2008)
Figure 1: Conceptual Framework Table 2: Measurement of Variable
Variable Code Item / Construct Major Reference
Product Quality
KP1KP2 KP3KP4 KP5KP6
Product usability Aesthetic value Features Compliance Reliability Product durability
Crosby, Evans, and Cowles (1990); Granero (2019); Li, Reimann, and Zhang (2018); Seidl, Hartl, and Kort (2019); Vilches-Montero, Nik Hashim, Pandit, and Bravo-Olavarria (2018)
Price
Pr1Pr2 Pr3Pr4
Affordability of prices
Price match with product quality Price competitiveness
Price compatibility with product benefits
Festa, Cuomo, Metallo, and Festa (2016);
Armstrong, Adam, Denize, and Kotler (2014)
Distribution Channel
Dstr1 Dstr2 Dstr3 Dstr4
Strategic location
Use of e-commerce access Availability of sustainable goods The ordering process is not difficult
Ramune Ciarniene (2015), Armstrong et al.
(2014)
Kepuasan Pelanggan
Sat1Sat2 Sat3Sat4 Sat5Sat6
Satisfied with product quality Satisfied with product benefits Satisfied with product characteristics Satisfied with product prices Satisfied with Product reliability Satisfied with product consistency
Haming et al. (2019); Bacile et al. (2018);
Piveteau and Smagghue (2019)
Loyalty
Loy1Loy2 Loy3Loy4 Loy5
Persistence in choosing products
The desire to try different types of other products Customers do not switch to competitor products The desire to buy back
Provide positive product recommendations to others
Kotler (2012); Murali, Pugazhendhi, and Muralidharan (2016); Izogo and Ogba (2015)
Variable customer satisfaction consists of five constructs, i.e., (satisfied with product quality, satisfied with product benefits, confident with product characteristics, confident with product prices, satisfied with product reliability and consistency). The loyalty variable consists of five constructs ie, (persistence in
choosing the product, the desire to try different types of products, the customer does not switch to competitors' products, the willingness to repurchase and provide positive product recommendations to others).
4. Results and Discussion 4.1. Statistics Analysis
Table 3: Data of Respondent (n = 179)
Data of Respondent Frequency %
Gender Male 69 38,5
Female 110 61,5
Age (year)
18 - 25 99 55.6
26 - 33 28 15,7
34 - 41 26 14.6
41 - 48 22 12.4
>48 3 1,7
Marital Status Single 109 61,9
Married 67 38,1
Education Level
Senior High School 76 42,5
Diploma 15 8,4
Bachelor 40 22.3
Magister 42 23,5
Doctoral 6 3.4
Occupation
Entrepreneurship 25 14
Civil Servant 23 12.8
Private Employee 23 12.8
SOE Employee 1 0.6
Others 107 59.8
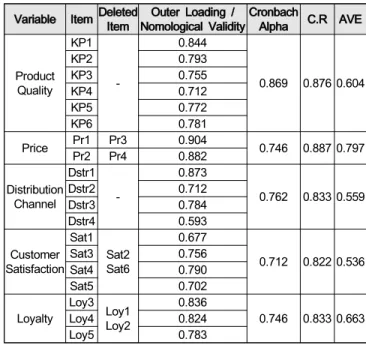
The results of testing the statistical model fit in table 4.
Shows that fit values such as values (Standardized Root Mean Square Residuals (SRMR)=0.0714<0.08, Normed Fit Index (NFI)=0.951> 0.9. Nomological validity values also dominantly indicate values> 0.7, which means that the entire item is declared valid in constructing its core variables, for example, in table 3.In the Outer loading / nomological validity column for the product quality (KP) variable where the most dominant item forming the product quality variable is KP1 (0.844, CR=0.876, AVE=0.604), Variable Price (Pr) there are 2 items deleted namely (Pr3 and Pr4), there are items that are deleted because the outer loading value does not meet the requirements, while the main item forming variable Price (Pr) is Pr1 (0.904, CR=0.887, AVE=0.797) The dominant items that make up the Distribution Channel (Distr) variable are in the Distr1 item (0.873, CR=0.833, AVE=
0.559). The Customer Satisfaction variable also has two items removed, namely Sat2 and Sat6 items, while the dominant items forming the variable Customer satisfaction are Sat4 items (0.790, CR=0.822, AVE=0.536). Two loyalty variables were removed from the validity test because they did not meet the validity test requirements, namely Loy1 and Loy2 items, while the dominant items that formed the Loyalty variable were Loy3 items (0.836, CR=0.833, AVE=
0.663).
Table 4: Goodness of Fit Model & Nomological Validity Variable Item Deleted Item Outer Loading /
Nomological ValidityCronbach
Alpha C.R AVE
Product Quality
KP1 -
0.844
0.869 0.876 0.604
KP2 0.793
KP3 0.755
KP4 0.712
KP5 0.772
KP6 0.781
Price Pr1 Pr3 0.904
0.746 0.887 0.797
Pr2 Pr4 0.882
Distribution Channel
Dstr1 -
0.873
0.762 0.833 0.559
Dstr2 0.712
Dstr3 0.784
Dstr4 0.593
Customer Satisfaction
Sat1 Sat2Sat6
0.677
0.712 0.822 0.536
Sat3 0.756
Sat4 0.790
Sat5 0.702
Loyalty Loy3 Loy1Loy2
0.836
0.746 0.833 0.663
Loy4 0.824
Loy5 0.783
Hypothesis testing results, as shown in table 5, most of the hypothesis testing that explains the direct effect relationship is Supported at both the significance level <0.05 and 0.01. In the direct effect test, the acquisition of the most dominant relationship is explained concerning the variable in the H1 hypothesis, namely the effect of product quality on customer satisfaction (t=15.482, sig 0.000 <0.01).
Whereas of the three in the indirect effect testing path, there are two indirect effects hypotheses which do not have a significant effect, namely on the H5 and H8 hypotheses.
Table 5: Hypothesis Result
Mean Std. Dev. T-stat P-value Result Product Quality
Customer Satisfaction 0.762 0.049 15.482 0.000<0.01 Supported Product Quality
Loyalty 0.295 0.092 3.242 0.001<0.05 Supported Product quality
customer satisfaction
loyalty 0.688 0.088 6.190 0.000<0.01 Supported Price Customer
Satisfaction 0.143 0.056 2.151 0.032<0.05 Supported Price Customer
Satisfaction loyalty -0.043 0.062 0.420 0.671>0.05 Non- Supported Distribution Channel
Customer Satisfaction 0.668 0.092 6.193 0.000<0.01 Supported Distribution Channel
loyalty 0.614 0.073 8.490 0.000<0.01 Supported Distribution Channel
Customer Satisfaction
loyalty 0.052 0.069 0.822 0.411>0.05 Non- Supported Customer Satisfaction
Loyalty 0.613 0.067 9.211 0.000<0.01 Supported
4.2. Discussion
Hypothesis testing results that have been reviewed previously provide a comprehensive picture of the relationship of variables with each other while providing an understanding that the old marketing mix (4P) approach is still relevant today in the world of marketing and is still a basic recipe for delivering a more modern marketing mix strategy. The relationship between the most dominant variables is shown in the relationship between product quality variables on customer satisfaction. In the case of this study where the research subject is Samsung smartphone products which are still a smartphone brand that is in demand by consumers, especially in Indonesia. Product quality components consisting of product usability components, aesthetic product value, features, product reliability, and durability are the main reasons why consumers want to own a product. Consumer satisfaction can be created along with the fulfillment of customer expectations for products or services, the results of testing this variable are also in line with the results of the study (Ismail, Khatibi, & Thiagarajan, 2003; Hsu & Lin, 2015; Chen
& Gayle, 2019; Kim & Shim, 2014; Haming et al., 2019;Nisar & Prabhakar, 2017; Ridha et al., 2018).
Especially in Indonesia as a developing country where the enormous dominant community income is centered on SES-A and B (Putra, Said, & Hasan, 2017). So that the tendency of customer satisfaction is also dominant can be measured through the suitability of tangible products. So far, the development of Samsung smartphones in Indonesia is known to be quite so captivating to the people of Indonesia.
Usability of products that can be used in various activities, especially daily use activities, especially Camera components, efficient use of RAM, product durability and aesthetic elements are the main reasons why Samsung Smartphone products in Indonesia are so in demand. This fact can be seen that the interest of the Indonesian people towards Samsung products not only started at the time of product sales but instead started at the time of pre-order of their products, such as thepre-order phenomena of Samsung smartphones since the Samsung Galaxy S6 and even the Galaxy Note 10 which currently has penetrated pre numbers -order 7,000 pre-order sales transactions throughout Indonesia.
Even though the price offered for Smartphone products is not cheap for SES-A and B income groups, which is around USD. 980 or KRW. 1,190,770 for Samsung Type Galaxy S8 Smartphone products - Galaxy Note 10 which when compared to the average per capita income of Indonesian people is in the KWR range. 255,165 or USD. 255 per month, but the price component does not become a barrier for most Indonesian people to own a Samsung Brand Smartphone product. The concept of consumer satisfaction of the Indonesian people can be said to see the visible component of product quality still is the essential thing. So it
is considered that the pricing of a product reflects the quality of the product itself. If the price of a product is relatively low, it makes some people aware of the quality of the product, and vice versa. Hypothesis testing results also illustrate that the variable price has a positive effect on customer satisfaction, this is in line with many research results such as Yoon and Kang (2005), Kauffman et al.
(2009) and Lin (2013), That the suitability of the price affects the level of customer satisfaction, in this case, the concept of consumer satisfaction for the people of Indonesia of the cost of the product is undoubtedly different from the regions of other countries.
The fact also shows that consumer loyalty will be realized if it is preceded by customer satisfaction, in this study on the subject of Samsung Smartphones also indicates that such a good product quality will increase customer satisfaction to be positive to encourage the creation of customer loyalty. The statement on this hypothesis is also in line with the results of the research from (Kotler, 2012;
Murali et al., 2016; Izogo & Ogba, 2015). But the opposite is shown in the results of hypothesis testing regarding the relationship between price, customer satisfaction and customer loyalty which is not significant, of course, the results of testing this hypothesis reject some of the effects of previous studies. However, it can be concluded as well as justifying the earlier statement that the product quality component is the main element that can make the relationship between customer satisfaction and loyalty becomes positive by ignoring the price component. On the other hand, the test results regarding distribution channels also show significant effects on customer satisfaction and even partial loyalty (Pötzl, 2000; Gil Saura et al., 2008;
Mehta et al., 2010; Tor, 1997). However, an indirect relationship involving the price variable on customer loyalty by making customer satisfaction an intervening variable contradicts the results of research from Monique (2017). The results of this study also provide a clear picture, especially for academics engaged in the marketing strategy science that the distribution channel component also plays an essential role in terms of increasing sales performance/
customer satisfaction of a product that. Nowadays, the strategic location has experienced the refraction of meaning;
the concept of strategic location today is not always emphasized on the location aspects that are dense with potential consumers. The development of industrial technology has made several locations that were previously difficult to access to become more easily accessible without having to involve sellers and buyers directly through face to face transactions. Likewise, the effects caused by the advance of the age also make transportation access so dense that the density of transportation has also made several locations that were once known to be strategic now become a scary location for land transportation to pass. So that the strategic concept and its definition have also experienced refraction and change in meaning as the
development of the times, today, distribution channels certainly do not only prioritize offline sales but must also involve online sales through the use of e-commerce as an alternative channel in distribution. The strategy method that has been implemented by Samsung in recent years with the
"Pre-Order" method illustrates that the entity and the enthusiasm of the community are getting stronger and indeed exciting to be studied further.
5. Implication
Teorethical Implication: Theoretically, it can be concluded that the conceptual framework that is commonly used in the world of marketing is that the marketing approach component in terms of pricing and distribution strategies and product quality is still essential and are necessary components in marketing. Urgent attention as the times evolved more towards the improvement of the distribution channel element and its strategy by adding technology-based marketing channels. For academics, this study also provides confirmation and re-defining the meaning of customer satisfaction and customer loyalty from the point of view of consumer behavior, especially on research subjects for smartphone cases in developing countries, especially on the implications of applying price and product quality to efforts to increase consumer loyalty and customer satisfaction — different points of view.
Managerial Implication: It is interesting to conclude for stakeholders as well as marketing and production managers that elements of product quality and alternative distribution channels play an essential role in increasing customer satisfaction and customer loyalty. Aspects of product quality that are in line with consumer expectations or even exceed consumer expectations are the primary keys and reasons why consumers can be loyal or not. The strategy of applying competitive prices is not always identified that low prices can guarantee maximum sales. Product exclusivity is reflected through pricing strategies that tend to be exclusive.
Price exclusivity can be assumed at a price that is slightly more expensive than competitors. For example, if you look at sales data for Samsung Smartphone products, the premium type product "Note type and Galaxy series" holds the highest record in terms of sales figures compared to Samsung products other than that type. This illustrates that exclusivity can be an advanced strategy for producers.
Reflecting on the study of consumer behavior in Indonesia over the sale of Samsung Smartphone products, this affirms that consumer sensitivity to prices tends not to apply to products that are considered exclusive and luxury.
6. Conclusion
Fulfilling aspects of customer satisfaction and customer
loyalty is the final goal to be achieved for every company, both engaged in the manufacturing and service sectors. The element of product quality following consumer expectations will undoubtedly be an antecedent variable that can realize loyalty and satisfaction because it is an indicator to measure achievement in a tangible manner while an evenly distributed distribution channel strategy is a supporting aspect that is no less important. The price component is not the only reason to make consumers satisfied and loyal.
References
Abdul, Q. (2013). An analysis of the antecedents of loyaltyand the moderating role of customer demographics in an emerging mobile phone industry. International Journal
of Emerging Markets, 8(4), 373-391.
https://doi.org/10.1108/IJoEM-02-2011-0019
Abdulfattah, F. (2012). The effect of electronic customer relationship on customer satisfaction a study in web banking in Saudi Arabia. University of Huddersfield.
Ahrholdt, D. C., Gudergan, S. P., & Ringle, C. M. (2019).
Enhancing loyalty: When improving consumer satisfaction and delight matters. Journal of Business
Research, 94, 18-27.
https://doi.org/https://doi.org/10.1016/j.jbusres.2018.08.040 Allen, J., Muñoz, J. C., & Ortúzar, J. de D. (2018).
Modelling service-specific and global transit satisfaction under travel and user heterogeneity. Transportation Research Part A: Policy and Practice, 113, 509-528.
https://doi.org/https://doi.org/10.1016/j.tra.2018.05.009 Armstrong, G., Adam, S., Denize, S., & Kotler, P. (2014).
Principles of marketing. Pearson Australia.
Bacile, T. J., Wolter, J. S., Allen, A. M., & Xu, P. (2018).
The Effects of Online Incivility and Consumer-to-Consumer Interactional Justice on Complainants, Observers, and Service Providers During Social Media Service Recovery. Journal of Interactive
Marketing, 44, 60-81.
https://doi.org/https://doi.org/10.1016/j.intmar.2018.04.002 Bayraktar, E., Tatoglu, E., Turkyilmaz, A., Delen, D., &
Zaim, S. (2012). Measuring the efficiency of customer satisfaction and loyalty for mobile phone brands with DEA. Expert Systems with Applications, 39(1), 99-106.
https://doi.org/https://doi.org/10.1016/j.eswa.2011.06.041 Blut, M., Teller, C., & Floh, A. (2018). Testing Retail
Marketing-Mix Effects on Patronage: A Meta-Analysis.
Journal of Retailing, 94(2), 113-135.
https://doi.org/https://doi.org/10.1016/j.jretai.2018.03.001 Bonadonna, L. (2010). Product quality. In Rapid and
On-Line Instrumentation for Food Quality Assurance.
https://doi.org/10.1201/9780203497968.ch9
Cao, Y., Gruca, T. S., & Klemz, B. R. (2003). Internet Pricing, Price Satisfaction, and Customer Satisfaction.
International Journal of Electronic Commerce, 8(2),
31-50. https://doi.org/10.1080/10864415.2003.11044291 Chen, Y., & Gayle, P. G. (2019). Mergers and product
quality: Evidence from the airline industry. International Journal of Industrial Organization, 62, 96-135.
https://doi.org/https://doi.org/10.1016/j.ijindorg.2018.02.006 Crosby, L. A., Evans, K. R., & Cowles, D. (1990).
Relationship quality in services selling: an interpersonal influence perspective. The Journal of Marketing, 54, 68-81.
Cui, C. C., Mrad, M., & Hogg, M. K. (2018). Brand addiction: Exploring the concept and its definition through an experiential lens. Journal of Business
Research, 87(February), 118-127.
https://doi.org/10.1016/j.jbusres.2018.02.028
Dodds, W. B., Monroe, K. B., & Grewal, D. (1991).
Effects of Price, Brand, and Store Information on Buyers’ Product Evaluations. Journal of Marketing
Research, 28, 307-319.
https://doi.org/10.1177/002224379102800305
Drennan, J., Bianchi, C., Cacho-Elizondo, S., Louriero, S., Guibert, N., & Proud, W. (2015). Examining the role of wine brand love on brand loyalty: A multi-country comparison. International Journal of Hospitality
Management, 49, 47-55.
https://doi.org/10.1016/j.ijhm.2015.04.012
Eskildsen, J., & Kristensen, K. (2008). Customer satisfaction and customer loyalty as predictors of future business potential. Total Quality Management &
Business Excellence, 19(7-8), 843-853.
https://doi.org/10.1080/14783360802159501
Festa, G., Cuomo, M. T., Metallo, G., & Festa, A. (2016).
The (r)evolution of wine marketing mix: From the 4Ps to the 4Es. Journal of Business Research, 69(5), 1550-1555.
https://doi.org/https://doi.org/10.1016/j.jbusres.2015.10.015 Gil Saura, I., Ruiz Molina, M. E., & Servera Francés, D.
(2008). Logistic service quality and technology: a comparison between supplier–retailer and retailer–
consumer relationships. The International Review of Retail, Distribution and Consumer Research, 18(5), 495-510. https://doi.org/10.1080/09593960802573385 Granero, L. M. (2019). Strategic product variety and
quality choice. Economics Letters, 182, 10–14.
https://doi.org/https://doi.org/10.1016/j.econlet.2019.05.033 Haming, M., Murdifin, I., Zulfikar Syaiful, A., & Aditya, H.
P. K. P. (2019). The Application of SERVQUAL Distribution In Measuring Customer Satisfaction of Retails Company. Journal of Distribution Science, 17(2), 25. https://doi.org/10.15722/jds.17.02.201902.25
Hsu, C.-L., & Lin, J. C.-C. (2015). What drives purchase intention for paid mobile apps? – An expectation confirmation model with perceived value. Electronic Commerce Research and Applications, 14(1), 46–57.
https://doi.org/https://doi.org/10.1016/j.elerap.2014.11.003 Ismail, H., Khatibi, A., & Thiagarajan, V. (2003). Customer
Satisfaction Factors and Its Relationship with Customer
Loyalty in Semiconductor Industry. Journal of Social
Sciences, 7(1), 37-45.
https://doi.org/10.1080/09718923.2003.11892322
Izogo, E. E., & Ogba, I.-E. (2015). Service quality, customer satisfaction and loyalty in automobile repair services sector. International Journal of Quality &
Reliability Management, 32(3), 250-269.
Józsa, T. (2017). The antecedents of market orientation and its effect on customer satisfaction and service quality: The case of Hungarian municipal public service provisions. International Review on Public and Nonprofit
Marketing, 14(3), 391-407.
https://doi.org/10.1007/s12208-017-0179-x
Kauffman, R. J., Lee, D., Lee, J., & Yoo, B. (2009). A Hybrid Firm’s Pricing Strategy in Electronic Commerce Under Channel Migration. International Journal of
Electronic Commerce, 14(1), 11-54.
https://doi.org/10.2753/JEC1086-4415140101
Kim, K.-S., & Shim, J.-H. (2014). Effects of Consumption Values on Customer Satisfaction in Movie Theaters: A Focus on College Students. Journal of Distribution
Science, 12(4), 73-83.
https://doi.org/10.13106/jds.2014.vol12.no4.73
Kim, S.-H., & Yoo, B.-K. (2015). Analysis of the Factors Affecting Customer Satisfaction and Customer Loyalty in a Family Restaurant Chain. Journal of Distribution
Science, 13(5), 103–111.
https://doi.org/10.15722/jds.13.5.201505.103
Kotler, P. (2012). Marketing management (ed.). Pearson Education Limited, 817, 1.
Kotler, P., Armstrong, G., & Philip Kotler, G. A. (2010).
Principles of Marketing(14th ed.). Pearson education.
Kotler, P., Kartajaya, H., & Setiawan, I. (2016). Marketing 4.0: Moving from traditional to digital. John Wiley & Sons.
Li, G., Reimann, M., & Zhang, W. (2018). When remanufacturing meets product quality improvement:
The impact of production cost. European Journal of Operational Research, 271(3), 913–925.
https://doi.org/10.1016/j.ejor.2018.05.060
Lin, S.-Y. (2013). The Influence of Relational Selling Behavior on Relationship Quality: The Moderating Effect of Perceived Price and Customers’ Relationship Proneness. Journal of Relationship Marketing, 12(3), 204–222. https://doi.org/10.1080/15332667.2013.816931 Lu, C.-C., Wu, I.-L., & Hsiao, W.-H. (2019). Developing
customer product loyalty through mobile advertising:
Affective and cognitive perspectives. International Journal of Information Management, 47, 101–111.
https://doi.org/https://doi.org/10.1016/j.ijinfomgt.2018.12.020 Marjanova, T. J., Sofijanova, E., Davcev, L., &
Temjanovski, R. (2015). Entrepreneurial Competition Orientation and Profitability: The Case of a Developing Economy. Procedia - Social and Behavioral Sciences, 207, 652–661. https://doi.org/10.1016/j.sbspro.2015.10.135 Mehta, R., Anderson, R. E., Dubinsky, A. J., Polsa, P., &
Mazur, J. (2010). Managing International Distribution Channel Partners: A Cross-Cultural Approach. Journal of Marketing Channels, 17(2), 89-117.
https://doi.org/10.1080/10466691003635051
Miyatake, K., Nemoto, T., Nakaharai, S., & Hayashi, K.
(2016). Reduction in consumers’ purchasing cost by online shopping. Transportation Research Procedia, 12, 656–666. https://doi.org/10.1016/j.trpro.2016.02.019 Monique, M. (2017). Investigating logistics service quality
in omni-channel retailing. International Journal of Physical Distribution & amp; Logistics Management, 47(4), 263-296. https://doi.org/10.1108/IJPDLM-06-2016-0161 Murali, S., Pugazhendhi, S., & Muralidharan, C. (2016).
Modelling and Investigating the relationship of after sales service quality w ith custom er satisfaction, re te n tio n and loyalty – A case study of home appliances business. Journal of Retailing and Consumer
Services, 30, 67-83.
https://doi.org/https://doi.org/10.1016/j.jretconser.2016.01.0 Narver, J. C., & Slater, S. F. (1990). The Effect of a 01
Market Orientation on Business Profitability. Journal of Marketing, 54(4), 20–35. https://doi.org/10.2307/1251757 Nisar, T. M., & Prabhakar, G. (2017). What factors
determine e-satisfaction and consumer spending in e-commerce retailing?. Journal of Retailing and
Consumer Services, 39, 135-144.
https://doi.org/https://doi.org/10.1016/j.jretconser.2017.07.0 10
Piveteau, P., & Smagghue, G. (2019). Estimating firm product quality using trade data. Journal of International
Economics, 118, 217-232.
https://doi.org/https://doi.org/10.1016/j.jinteco.2019.02.005 Pötzl, J. (2000). Issues in Direct Channel Distribution: A
Comparison of Selling via the Internet in the Airline Business and the Fast-moving Consumer Goods Industry. Electronic Markets, 10(3), 153-157.
https://doi.org/10.1080/10196780050177044
Putra, A. H. P. K., Said, S., & Hasan, S. (2017).
Implication Of External And Internal Factors Of Mall Consumers In Indonesia To Impulsive Buying Behavior.
International Journal of Business Accounting and Management ISSN, 2(4), 1-10.
Ramlawati, R., & Putra, A. H. P. K. (2018). Total Quality Management as the Key of the Company to Gain the Competitiveness, Performance Achievement and Consumer
Satisfaction. International Review of Management and Marketing, 8(5), 60-69.
Ramune Ciarniene, G. S. (2015). Theoretical Framework of E-Business Competitiveness. Procedia -Social and
Behavioral Sciences, 213, 734-739.
https://doi.org/10.1016/j.sbspro.2015.11.528
Ridha, A., Perdana, A. H., & As’ ad, A. (2018). Celebrity Endorser Pada Jejaring Sosial instagram Untuk Menarik Minat Pembelian Calon Konsumen. Jurnal Economic Resource, 1(1), 86-96.
Ruiz Díaz, G. (2017). The influence of satisfaction on customer retention in mobile phone market. Journal of Retailing and Consumer Services, 36, 75-85.
https://doi.org/https://doi.org/10.1016/j.jretconser.2017.01.0 03
Seidl, A., Hartl, R. F., & Kort, P. M. (2019). A multi-stage optimal control approach of durable goods pricing and the launch of new product generations. Automatica, 106, 207–220. https://doi.org/10.1016/j.automatica.2019.05.009 Tor, W. A. (1997). The principal’s and agents’ contribution
to customer loyalty within an integrated service distribution channel. European Journal of Marketing, 31(7), 487-503. https://doi.org/10.1108/03090569710176637 Torres-Ortega, R., Rialp-Criado, A., Rialp-Criado, J., &
Stoian, M.-C. (2015). How to measure born-global firms’ orientation towards international markets?. Revista Española de Investigación de Marketing ESIC, 19(2), 107–123. https://doi.org/10.1016/j.reimke.2015.04.001 Unal, S., & Aydýn, H. (2013). An Investigation on the
Evaluation of the Factors Affecting Brand Love.
Procedia - Social and Behavioral Sciences, 92(Lumen), 76–85. https://doi.org/10.1016/j.sbspro.2013.08.640 Vilches-Montero, S., Nik Hashim, N. M. H., Pandit, A., &
Bravo-Olavarria, R. (2018). Using the senses to evaluate aesthetic products at the point of sale: The moderating role of consumers’ goals. Journal of Retailing and Consumer Services, 40(March 2017), 82-90. https://doi.org/10.1016/j.jretconser.2017.09.008 Yoon, S.-J., & Kang, J.-W. (2005). Validation of Marketing
Performance Model for Service Industries in Korea.
Services Marketing Quarterly, 26(4), 57-76.
https://doi.org/10.1300/J396v26n04_04
Zeithaml, V. A., Parasuraman, A., & Malhotra, A.
(2002). Service quality delivery through web sites: a critical review of extant knowledge. Journal of the Academy of Marketing Science, 30(4), 362.