Original Article
SPECT Image Analysis Using Computational ROC Curve Based on Threshold Setup
Moo-Sub Kim*, Han-Back Shin*, Sunmi Kim*, Jae Goo Shim
†, Do-Kun Yoon*, Tae Suk Suh*
*Department of Biomedical Engineering and Research Institute of Biomedical Engineering, College of Medicine, The Catholic University of Korea, Seoul,
†Department of Radiologic Technology Daegu Health College, Daegu, Korea
Received 21 July 2017 Revised 31 August 2017 Accepted 1 September 2017
Corresponding author Tae Suk Suh
([email protected]) Tel: 82-2-2258-7232 Fax: 82-2-2258-7506
Co-corresponding author Do-Kun Yoon
([email protected]) Tel: 82-2-2258-7504 Fax: 82-2-2258-7506
We proposed the objective ROC analysis method based on the setting of threshold value for evaluation of single photon emission computed tomography (SPECT) image. This proposed ROC analysis method uses the quantification computational threshold value to each signal on the SPECT image. The SPECT images for this study were acquired by using Monte Carlo n-particle extended simulation code (MCNPX, Ver. 2.6.0, Los Alamos National Laboratory, USA). The basic SPECT detectors and specific water phantom were realized in the simulation, and we could get the simulation results by the simulation operation. We tried to analyze the reconstructed images using threshold value application based objective ROC method. We can get the accuracy information of reconstructed region in the image. This proposed ROC technique can be helpful when we have to evaluate the weak signal for the NM image. In this study, the proposed threshold value based computational ROC analysis method can provide better objectivity than the conventional ROC analysis method.
Keywords: SPECT, Computational ROC, Threshold value, Objectivity
Copyright © 2017 Korean Society of Medical Physics
CCThis is an Open-Access article distributed under the terms of the Creative Commons Attribution Non-Commercial License (http://creativecommons.org/licenses/by- nc/4.0) which permits unrestricted non-commercial use, distribution, and reproduction in any medium, provided the original work is properly cited.
Introduction
Nuclear medicine (NM) images have been evaluated through a physical verification method such as modulation transfer function (MTF), root mean square (RMS), Winener spectrum, and entropy analysis, etc.
1-3)However, these evaluation methods frequently caused some unexpected results which are different with an evaluation according to an observer. Although the number of data is same, the evaluation can be absolutely changed depending on the personal subjectivity with visual recognition ability and experience. In addition, because this subjective evaluation method is progressed without the objectivity, the correct evaluation of the image quality can be difficult. Thus, because the evaluation of NM image is easy to depend
on the observer’s vision, the subjectivity based on the physical standard is required. Hawlet chart method, Landolt chart method, Burger's phantom, receiver operation characteristic (ROC) analysis have been used as the representative subjective evaluation method.
4,5)Although the ROC analysis based on signal detection is the subjective evaluation method of the observer, the observer’s subjective decision can be considered as a quantitative factor.
6-9)The conventional ROC analysis method for the NM image is progressed by scoring the quality of the specific signal on the image, and the ROC curve can be made using both the sensitivity and the specificity, according to the score. And the image can be evaluated by comparing the area under the curve (AUC) value. For the score, when there are the signal and
Progress in Medical Physics 28(3), September 2017 https://doi.org/10.14316/pmp.2017.28.3.77 pISSN 2508-4445, eISSN 2508-4453
the noise, if its response is ‘Signal’, it is denoted as ‘true positive (TP)’. When there is the only noise, if its response is ‘No Signal’, it is denoted as ‘true negative (TN)’. On the other hands, when there are the signal and the noise, if its response is ‘No Signal’, it is classified as ‘false negative (FN)’. When there is the only noise, if its response is ‘Signal’, it is classified as ‘false positive (FP)’. For these four classes, each score is assigned to draw the ROC curve. However, we proposed the objective ROC analysis method based on the setting of threshold value, for evaluation of single photon emission computed tomography (SPECT) image. This proposed ROC analysis method uses the quantification computational threshold value to each signal on the SPECT image.
Materials and Methods
The SPECT images for this study were acquired by using Monte Carlo n-particle extended simulation code (MCNPX, Ver. 2.6.0, Los Alamos National Laboratory, USA). The basic SPECT detectors and specific water phantom were realized in the simulation, and we could get the simulation results by the simulation operation. The specification of the detector and source definition is referred from the previous study.
10,11)The water phantom which can emit the gamma ray of 662 keV (Cs-137) at the specific region was used to be scanned using SPECT in the simulation. This cylindrical water phantom (diameter=18 cm, height=6 cm, density=1 g/cm
3) involved three radioisotope uptake regions (RURs).
These three RURs (isotope content ratio=0.14%, 0.55%, 0.31%) took each different size (diameter=2 cm, 4 cm, and 3cm) and position (( − 2.12, − 3.00, − 2.12), (0, − 3.00, 2.00), and (2.12, − 3.00, − 2.12); the center of phantom=(0, 0, 0)). The lutetium yttrium oxyorthosilicate (LYSO, density=7.3 g/cm
3) that is mainly used to detect gamma ray in the NM device was selected for the simulation. The size of detector was 28×28×3 cm
3, and the parallel lead collimator (density=11.3 g/cm
3) with 2 mm thickness, 20 cm height, and 69 frames was attached to the detector.
12)The projection numbers of the SPECT imaging in this study were 16, 32, 64, and 128 (due to 4 head SPECT modality).
For each projection, the numbers of particle source (NPS) was set at 60 million. In addition, to reconstruct SPECT
image, graphics processing unit (GPU; NVIDIA GeForce GTX 770, 2 GB memory GDDR5 graphic card and compute unified device architecture (CUDA)) based ordered subset expectation maximization (OSEM) reconstruction algorithm was used using MATLAB (R2012a, Mathworks Inc., USA).
We tried to analyze the reconstructed images using threshold value application based objective ROC method.
In order to progress this proposed evaluation method, the pixel address matching method is required. The pixel address matching method is similar to the image registration. However, it cannot be called as registration.
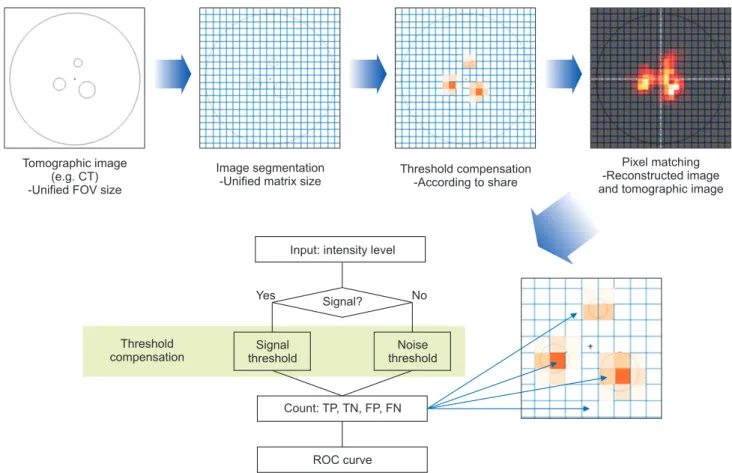
The simple overlapping between the reconstructed image and the actual tomographic image such as the computed tomography (CT) image. The first process is the unification regarding both the pixel size and the matrix number. In spite of pixelated reconstructed image, we should divide the actual tomographic image as the pixel. Thus, we applied the grid pattern frame looks like the pixel to the actual tomographic image. And each pixel address value was assigned depending on the pixel’s row-column. When the matrix size of two kinds of image was same, because each pixel address was same, we can match the address value between the reconstructed image and the actual tomographic image. Second, the setting of standard points for overlapping images was performed. We calculated there points from the reconstructed image and the actual tomographic image. At the actual tomographic image, the target’s center points were measured. And then, the pixels including these points was found. In the case of the reconstructed image, the each pixel including the highest intensity from three RUR was found. Thus, we could overlap these two images.
We tried to include objective factor for drawing the ROC
curve. At each pixel of reconstructed image matched with
the actual tomographic image, when the specific pixel in
the reconstructed image is involved on the part of the RUR
at the actual tomographic image, Signal threshold value is
applied to decide the TP (in case that the signal intensity
level is over the 90%). And the signal threshold value can
be adjusted according to the area ratio. Although the
some pixel is located on the part of the RUR, if the signal
intensity level is below the threshold, it is classified at the
FN. The FN case is remarkable mostly at the edge of the RUR. On the other hands, when the specific pixel in the reconstructed image is involved on the region without
RUR, Noise threshold value is applied to decide the TN (in case that noise intensity level is below 10%). Although some pixels are located at the out of RUR, if the noise
Tomographic image (e.g. CT) -Unified FOV size
Image segmentation -Unified matrix size
Threshold compensation -According to share
Pixel matching -Reconstructed image and tomographic image
Input: intensity level
Signal?
Yes No
Count: TP, TN, FP, FN
ROC curve Threshold
compensation
Signal threshold
Noise threshold
Fig. 1. Diagram of the threshold value based receiver operation characteristic (ROC) analysis method.
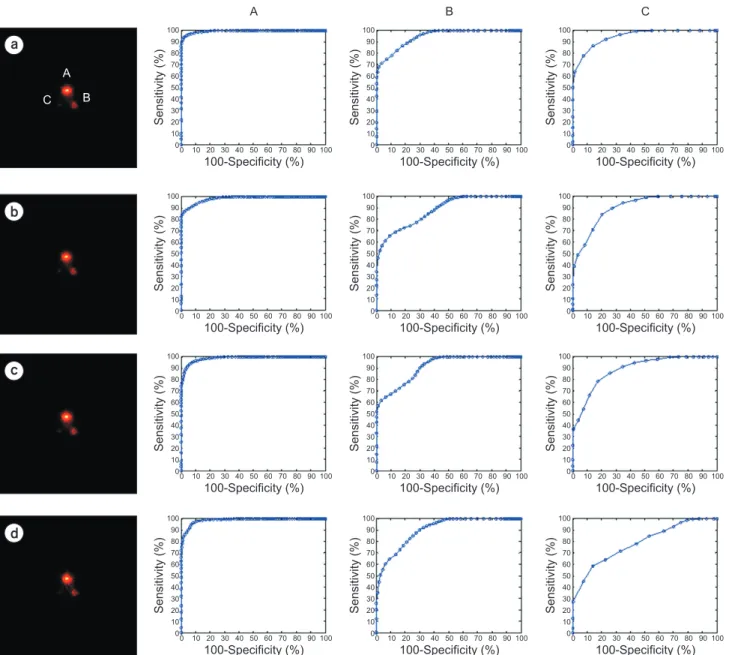
a b c
d e
A B C
Fig. 2. Original water pattern of the
single photon emission computed
tomography (SPECT) phantom
with three radioisotope uptake
regions (RURs) (a). Reconstructed
tomographic image using the graphic
processing unit (GPU) based fast
iterative reconstruction algorithm
with (b) 128, (c) 64, (d) 32, and (e) 16
projections.
intensity level is over the threshold value, it is classified as the FP. Thus, we could get the four factors (TP, FN, TN, and FP) for drawing the ROC curve, and we could calculate the sensitivity and specificity using the many answers from the pixels (as matrix number; N×N). Fig. 1 shows the method of threshold value based ROC analysis.
Results and Discussion
Fig. 2 shows the reconstructed images using the GPU
based OSEM reconstruction algorithm. The original pattern of water phantom including three RURs tagged as A, B, and C was shown at Fig. 2(a), and Fig. 2(b), (c), (d), and (e) show the reconstructed images using 128, 64, 32, and 16 projection data, respectively. Naturally, the more projection number made the better images. We can observe the three RURs clearly at (b), (c). However, in the case of region C in the (d) and (e), it is hard to identify region signal only using naked eyes. Because normal people is difficult to identify a blurred signal, this case can cause the confusing
A C B
Sensitivity (%)
100-Specificity (%)
100 90 80 70 60 50 40 30 20 10
00 10 20 30 40 50 60 70 80 90 100
Sensitivity (%)
100-Specificity (%)
100 90 80 70 60 50 40 30 20 10
00 10 20 30 40 50 60 70 80 90 100
Sensitivity (%)
100-Specificity (%)
100 90 80 70 60 50 40 30 20 10
00 10 20 30 40 50 60 70 80 90 100
Sensitivity (%)
100-Specificity (%)
100 90 80 70 60 50 40 30 20 10
00 10 20 30 40 50 60 70 80 90 100
Sensitivity (%)
100-Specificity (%)
100 90 80 70 60 50 40 30 20 10
00 10 20 30 40 50 60 70 80 90 100
Sensitivity (%)
100-Specificity (%)
100 90 80 70 60 50 40 30 20 10
00 10 20 30 40 50 60 70 80 90 100
Sensitivity (%)
100-Specificity (%)
100 90 80 70 60 50 40 30 20 10
00 10 20 30 40 50 60 70 80 90 100
Sensitivity (%)
100-Specificity (%)
100 90 80 70 60 50 40 30 20 10
00 10 20 30 40 50 60 70 80 90 100
Sensitivity (%)
100-Specificity (%)
100 90 80 70 60 50 40 30 20 10
00 10 20 30 40 50 60 70 80 90 100
Sensitivity (%)
100-Specificity (%)
100 90 80 70 60 50 40 30 20 10
00 10 20 30 40 50 60 70 80 90 100
Sensitivity (%)
100-Specificity (%)
100 90 80 70 60 50 40 30 20 10
00 10 20 30 40 50 60 70 80 90 100
Sensitivity (%)
100-Specificity (%)
100 90 80 70 60 50 40 30 20 10
00 10 20 30 40 50 60 70 80 90 100