176 176
서 론갯벌은육지와해양의전이대로서육지에서 발생하는 각종 오염물질을자연정화하는기능을하는동시에다양한생명체 의서식및산란장으로이용되는곳이다
.
조간대퇴적물의상 층부수센티미터이내에는규조류(diatoms),
남조류(cyanobac- teria),
와편모조류(dinoflagellates)
와 유글레나(euglenids)
등 의 저서미세조류(microphytobenthos)
는 점액성 물질을 방출 하여 생물막(biofilm)
을 형성하며 서식한다(Underwood and
Kromkamp, 1999; Kelly et al., 2001; Consalvey et al., 2004;
Méléder et al., 2005).
저서미세조류는연안저서생태계의일차 생산자로서탄소순환,
영양염순환조절및퇴적물안정화등에 기여할뿐만아니라(Rizzo, 1990; De Jonge and Colijn, 1994;
MacIntyre et al., 1996; Underwood and Kromkamp, 1999),
저 서무척추동물,
퇴적물섭식자와몇종의어류의직접적이고안 정적인먹이원으로서중요한생태학적역할을한다(Montagna et al., 1995; Kang et al., 2003; Krumme et al., 2008).
저서미세조류의종조성과생물량은무생물적환경
(
해수와퇴Article history;
Received 12 May 2012; Revised 14 January 2013; Accepted 11 April 2013
*Corresponding author: Tel: +82. 63. 850. 6579 Fax: +82. 63. 857. 8837 E-mail address: [email protected]
Kor J Fish Aquat Sci 46(2) 176-185, April 2013 http://dx.doi.org/10.5657/KFAS.2013.0176 pISSN:0374-8111, eISSN:2287-8815
ⓒ The Korean Society of Fishereis and Aquatic Science. All rights reserved
Seasonal species composition and biomass of microphytobenthos were examined at the intertidal flats of Jinsanri, Taean, Korea, from April to December 2011. In total, 121 species were identified, including 109 diatoms, 5 blue- green algae, and 5 dinoflagellates. Seasonal variation in species number ranged from 49 to 56 species (minimum in October and maximal in April), while vertical variation across three different shore levels ranged from 64 to 77 spe- cies with maximum at high and minimum at low shore. Species diversity ranged from 3.22 to 3.42 seasonally and from 3.50 to 3.17 across vertical shore levels. Seasonal average values of the normalized difference vegetation index and the vegetation index were 0.06 and 1.14, respectively. Chlorophyll a concentrations were 66.00-120.73 mg/m
2, with a seasonal minimum and maximum in July and October, respectively, and a vertical shore maximum of 137.35 mg/m
2at mid shore. Phaeopigment concentrations peaked in October (50.78 mg/m
2) and at high shore (61.58 mg/
m
2) and were lowest in December (22.53 mg/m
2) and at low shore (15.28 mg/m
2). The number of microphytobenthos ranged from 78,556 to 287,898 cells/cm
2, reaching a maximum in April and a minimum in July. The diatoms Paralia sulcata , Navicula sp., and Delphines surirella were dominant at all tidal levels over the study period. Dinoflagellates were dominant in July at low shore, and blue-green algae were abundant between July and October at mid shore. In conclusion, species composition and primary production of microphytobenthos exhibited clear seasonal and vertical patterns.
Key words: Biomass, Chlorophyll a , Dominant species, Shore level, Species composition
한국 태안군 진산리 저서미세조류의 계절별 종조성 및 생물량 변화
원광대학교 생명과학부/기초자연과학연구소, 1(주)생태와 환경, 2국립수산과학원 갯벌연구소
Seo Kyoung Park, Bo Yeon Kim, Han Gil Choi*, Joung-Soon Oh1, Sang-Ok Chung2, Kyoung-Ho An2 and Kwang-Jae Park2
박서경·김보연·최한길
*·오정순
1·정상옥
2·안경호
2·박광재
2Seasonal Variation in Species Composition and Biomass of Microphytobenthos at Jinsanri, Taean, Korea
Faculty of Biological Science and Institute for Basic Science, Wonkwang University, Iksan, Jeonbuk 570-749, Korea
1
Institute of Eco and Environmental Incorporation, Bucheun 403-012, Korea
2
Tidal Flat Research Institute,National Fisheries Research & Development Institute, Kunsan, 573-882, Korea
적물의영양염유용성
,
파도,
조석,
건조,
광및퇴적물입도등)
과생물적환경(macrofauna
의퇴적물교란,
섭식자의패치등)
에의해영향을받으므로시∙
공간적으로매우다양하게나타난 다(Montani et al., 2003).
저서미세조류는계절성이뚜렷하고,
동일한갯벌에서도퇴적물입도,
영양염상태,
조위에따라서 종조성과분포및생물량등군집구조가다르게나타나는것 으로알려져있다(Oh et al., 2004; Lee et al., 2009; Lucas et
al., 2003).
저서미세조류의종조성과출현개체수는광학현미경을이용하여확인하고단위면적혹은퇴적물무게당엽록 소
a
의 농도를 분광광도계(spectrophotometer)
나 형광광도계(fluorometer)
로생물량을측정한다(Holm-Hansen et al., 1965;
Lorenzen, 1967; Kendrick et al., 1998).
특히,
아세톤에의한엽 록소추출법은엽록소a
와엽록소의분해된(degraded)
형태인phaeopigment
의함량을측정할수있는데, phaeopigment
의양 은초식자의섭식과환경적스트레스에의해변화하는것으로 알려져있다(Helling and Baars, 1985).
최근에는저서미세조류 의생물량을HPLC (High Performance Liquid Chromatogra- phy)
로정량화하거나분광복사기(spectroradiometer)
로NDVI (normalized difference vegetation index)
와VI (vegetation in- dex)
를측정하여나타낸다(Jesus et al., 2006).
우리나라갯벌저서미세조류에군집구조에대한연구는금강 하구역조간대
(Kim and Cho, 1985)
와만경및동진갯벌퇴적 물(Oh and Koh, 1995),
남서부갯벌(Lee, 2002, 2003)
에서광 학현미경을이용하여수행되었으며, HPLC
의색소분석을이용 하여새만금갯벌(Oh et al., 2004),
강화도갯벌(Yoo and Choi, 2005)
과광양만(Lee et al., 2009)
에서계절별종조성과생물량 을추정하는이전연구가있다.
하지만,
서해안은다양한환경 과퇴적물입도를가진갯벌이광활하게발달되어있어서저서 미세조류의종다양성및생물량의계절적변동이있을것으로 추정되지만충분한연구가수행되지않아서매우한정된자료 만존재한다.
따라서본연구의목적은전통적인광학현미경법 을이용하여저서미세조류의종조성과출현량,
엽록소a
와pha- eopigment
함량,
그리고식생지수를측정하는spectroradiom- eter
를이용하여 태안반도 갯벌에서식하는 미세조류의 계절 별그리고조간대조위별생물량의변동을파악하는것이었다.
재료 및 방법
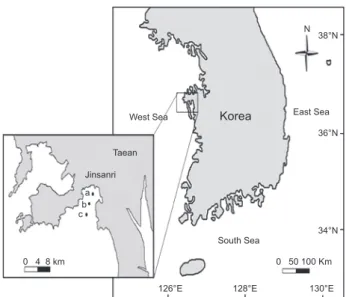
진산리갯벌의조위별미세조류종조성및생물량의계절별 변화를확인하기위하여
2011
년4, 7, 10, 12
월에조간대상부,
중부및하부에서정성및정량채집을실시하였다(Fig. 1).
정성채집은스파툴라
(spatula)
를이용하여조위별퇴적물표층을채취한뒤이시료를루골용액
(Lugol's solution)
으로최종농도가0.2-0.4%
가되도록고정한후광을차단하여아이스박스에보관한상태로실험실로운반하였다
.
저서미세조류생물량의계 절별변화를파악하기위한정량분석은직경3 cm
의sediment corer
를이용해조위별로표층에서5 cm
깊이로8
개의주상시료를채집한후드라이아이스에보관하여실험실로운반하였으며 분석전까지저온냉동고에서
-70℃
로보관하였다.
저서미세조류의출현종은루골용액으로고정된시료를멸균 해수로희석하여광학현미경
(Olympus BX 53, Japan)
하에서 다양한문헌(Dodge 1982; Jin et al., 1985; Underwood, 1994;
Falasco et al., 2009; Pitcher and Joyce, 2009)
을활용하여관찰 및동정하였다.
광학현미경으로동정후,
저서미세조류의주요 분류군인규조류의관찰은Park (2005)
과Woelfel et al.(2007)
의방법을수정하여규조각을세척하여광학현미경과주사전 자현미경(Hitachi S-4800, Japan)
으로종을확인하였다.
조위 와계절별출현종의출현유∙
무에따라종다양도지수와유사 도를PRIMER version 6 (Clarke and Gorley, 2006)
을사용하 여분석하였으며유사도분석에따른각그룹의유의차는SIM- PROF (similarity profile) test
를실시하여검정하였다.
식생분포는
Spectroradiometer (USB2000, Ocean Optics
USA)
로조간대조위별로채집된주상시료8
개의반사율을측정하였으며
,
정규식생지수(NDVI)
와 식생지수(VI)
는 아래의 식으로계산하였다(Rouse et al., 1973; Jordan, 1969).
NDVI = (Infrared - Red)/(Infrared + Red) VI = Infrared/Red
(InfraRed = 748-752 nm
의반사율평균, Red = 673-677 nm
의반사율평균)
저서미세조류의생물량은퇴적물내미세조류의엽록소
a
를 추출하여측정하는데(Montani et al., 2003),
본연구에서는각조위별로채취한
8
개시료의반사율을측정한후표층1 cm
를절단하여뚜껑이있는유리병에넣고아세톤
(90%)
을첨가하여4℃
의암냉소에서엽록소a
를추출하였다. 20
시간후,
분광광도 계(Libra S22, Biochrom England)
를사용하여665
와750 nm
Dec(M) Dec(L) Oct(H) Oct(M) Oct(L) Apr(H) Apr(M) Apr(L) Dec(H) Jul(L) Jul(H) Jul(M)
GroupⅠ GroupⅡ GroupⅢ GroupⅣ 20
40
60
80
100
Bray Curtis Similarity
Korea
East SeaWest Sea
South Sea
0 50 100 Km
126°E 128°E 130°E
38°N
36°N
34°N N
0 4 8 km a cb
Taean Jinsanri
Fig. 1. A map showing the study area at Jinsanri, Taean, Korea.a:
High, b: Mid, c: Low.
에서흡광도를측정하였고
, 1 M
의HCl
를한방울떨어뜨린후5
분뒤에다시측정하였다.
퇴적물의면적은Image J
프로그램 을사용하여측정하여아래의식(Lorenzen, 1967)
으로퇴적물 의단위면적당엽록소a
와phaeopigment
농도를계산하였다.
엽록소
a
농도(mg/m
2) = 11.0 × K × (665
o- 665
a) × v Vf × l
Phaeopigment
농도(mg/m
2) = 11.0 × K × (R × 665
a- 665
o) × v Vf × l
(11.0 =
엽록소a
의흡광계수, K =
초기엽록소농도에서흡 광도감소요소, 665
o=
산처리전의흡광도, 665
a=
산처리후의 흡광도, v =
용매의최종부피, Vf =
시료의면적, l =
분광광도 계cell
의직경, R = phaeopigment
가없는상태에서665
o: 665
a 의최대비율)
저서미세조류의출현한개체수를파악하기위해서각조위별 로직경
3 cm
의sediment corer
로채집한3
개의주상시료에서 표층부터1 cm
를절단하여150
배혹은200
배의멸균해수로희 석하여Sedgwick-Rafter Chamber
를 이용하여×400
배율의 광학현미경 하에서 계수하여 단위면적당 세포수(cell/cm
2)
로 환산하였다.
갯벌저서동물이저서미세조류의생물량에미치는영향을확 인하기위하여
,
조위별로3
개의방형구(25×25 cm)
를무작위 로놓고방형구내에있는퇴적물(
깊이3 cm)
을모종삽으로채 집하여표준망체(2×2 mm, No. 10)
에넣고해수로세척한후 망을통과하지않는저서생물을수집하여플라스틱시료통에 해수와함께넣고포르말린으로고정하였다.
샘플은실험실로 운반한후에종별로구분하여계수한후단위면적당개체수로 환산하였다.
결 과
갯벌 환경
본연구지역인충남태안군진산리갯벌은
7.3 m
의조차를가지는지역이다
.
채집시기의수온은15.0 (12
월)-32.4℃ (7
월),
염분은10. 0 (10
월)-33.1 psu (4
월), pH
는8.01 (12
월)-8.18 (10
월),
용존산소(DO)
는4.20 (7
월)-8.90 mg/L (12
월),
부유물질농 도(SPM)
는33.00 (7
월)-89.40 mg/L (10
월), Silicate
는0.06 (4
월
)-0.30 mg/L (7
월),
엽록소a
농도는1.01 (7
월)-1.75 µg/L (10
월)
의범위를보였으며,
총인(TP)
은0.001 (7
월)-0.021 mg/L (10
월), NH
4-N
는0.072 (10
월)-0.199 mg/L (7
월), NO
2-N
은0.002 (4
월, 10
월)-0.003 mg/L (7
월), NO
3-N
은0.014 (7
월)- 0.029 mg/L (4
월)
의농도를보였다(NFRDI, 2011).
갯벌상부 에서소량의담수가유입되고중부지역에는바지락과동죽의양 식장이위치해있다.
퇴적물은주로미세한모래와실트로구 성되어있고저질의입도는니질사또는사질로서모래가상 부에서99.08%,
중∙
하부에서99.98%
로서모래가많이함유되 어분급이양호하게나타났다.
진산리갯벌의대형저서동물은 총11
개정점에서총31
종이출현하였고다모류(15
종),
갑각류(8
종),
연체동물(6
종)
이우점하였고기타다른동물이2
종이었다
(NFRDI, 2011).
조간대상부와중부에서는별난가시갯지렁이류
(Aricidea pacifica)
와 캘리포니아백금갯지렁이(Nephtys californiensis)
가제1,
제2
우점종이었으며,
동죽(Mactra ven- eriformis)
이다음순서로나타났다(NFRDI, 2011).
진산리갯 벌의노출시간은상부에서390-450
분,
중부에서380-430
분,
하 부에서290-340
분으로주간에비해야간노출시간이50-60
분 이더길었다.
상부는중부보다노출시간은10-20
분많았으며,
하부는상∙
중부에비해약1
시간30
분내외로차이가있었다(NFRDI, 2011).
종조성
진산리갯벌에서
4
계절의정성샘플에서출현한저서미세조 류는 총121
종이었으며,
규조류가109
종으로전체출현종의90.08%
를차지하는가장우점하는분류군이었으며,
남조류(5
종
, 4.13%)
와와편모조류(5
종, 4.13%)
가아우점하는분류군이 고편모조류(1
종, 0.83%)
와유글레나류(1
종, 0.83%)
도관찰되 었다(Table 1).
계절별출현종수는49-56
종으로10
월에최소였 고4
월에최대로나타났다(Table 1).
조위별출현종수는상부에 서77
종(
남조류5
종,
규조류70
종,
유글레나류1
종,
와편모조 류1
종),
중부에서68
종(
남조류1
종,
규조류65
종,
유글레나류1
종,
와편모조류1
종),
하부에서64
종(
규조류60
종,
와편모조 류3
종,
편모조류1
종)
으로상부에서최대이고하부에서최소였 다.
상부에서는규조류∙
남조류가,
중부에서는규조류가,
하부에 서는규조류∙
와편모조류가주요한분류군이었다.
규조류는조 간대의모든조위에서고르게분포하였으나남조류는상∙
중부Table 1. The number of microphytobenthos species observed at three intertidal shore levels and four seasons in Jinsanri, Taean, Korea
Taxon Apr. Jul. Oct. Dec.
H M L Total H M L Total H M L Total H M L Total
Cyanophyceae 1 1 1 1 4 1 5
Dinophyceae 1 1 3 3 1 1
Bacillariophyceae 29 31 29 54 26 28 25 46 29 23 21 42 38 21 17 53
Rhaphidophyceae 1 1
Euglenophyceae 1 1 1 1 1 1 1 1 1 1
Total 31 32 29 56 28 31 28 51 34 24 22 49 39 21 18 55
H, high; M, mid; L, low.
에서그리고와편모조류는중
∙
하부에서출현하여조위별차이 가있었다.
종다양도지수
연구기간동안에종다양도지수는
3.22-3.42
로평균3.32
였다.
계절별로는12
월에최저였고4
월에최대였다(Table 2).
조위별연평균종다양도지수는조간대상부에서최대
(3.50)
였고하부에서
3.17
로서최소였으며,
계절별로는상부에서3.33-3.71
로 여름인7
월에최소값을12
월에최대값을보였다.
조간대중부 에서는3.05-3.47,
하부에서는2.89-3.37
로서모두12
월에최소 이고4
월에최대값을보였다.
유사도 분석
저서미세조류의출현유
∙
무에따라유사도를분석한결과,
이 들의종조성은계절성을보이는것으로확인되었다(Fig. 2).
종 조성에따라구분해보면,
그룹I
은12
월(
중∙
하부)
와10
월(
상∙
중∙
하부),
그룹II
는4
월(
상∙
중∙
하부),
그룹III
은12
월(
상부),
그리고 그룹IV
는7
월(
상∙
중∙
하부)
로계절성을보였다.
그룹III
과그룹IV
의유사도는36.26%
이고그룹II
와그룹III∙IV
의유사도는35.77%
였으며,
그룹I
과그룹II∙III∙IV
는34.16%
의유사도를 보여유의차가확인되었다(P <0.05).
식생지수
태안군진산리갯벌의정규식생지수
(NDVI)
는0.05-0.08
로서10
월에최소이고12
월에최대로계절적변화를보였으며,
평균 값은0.06
으로나타났다(Fig. 3A).
조위별NDVI
의평균값은 조간대상∙
하부는0.07
로동일하였고중부에서는0.06
으로약 간낮았다. 4
월에NDVI
값은상부에서0.03
이고중∙
하부에서각기
0.08
로높게나타남으로써조위별차이를보였으나, 7
월에는상
∙
중∙
하부에서0.06
으로동일하였다. 10
월에는조위별로0.03-0.06
으로중부에서최소값을그리고하부에서최대값을보였다
. 12
월에는상부에서0.11
로연구기간에최대값을보였으며
,
중부와하부에서는0.07
로동일한값을보였다.
식생지수인VI
의 평균값은1.14
였으며,
계절별로는1.10- 1.19
로서10
월에최소였고12
월에최대값을보였다(Fig. 3B).
조위별
VI
값은1.13-1.15
로서조간대중부에서최소였고하부 에서최대였다. 4
월에조위별VI
값은상부에서1.07
로서중∙
하부의
1.17
에비해낮았으며, 7
월에는상∙
하부에서1.13
으로1.12
를보인중부에비해서높게나타났다. 10
월에는조위별로1.05-1.13
으로서중부에서최소였고하부에서최대였으나, 12
월에는상부에서
VI
값이1.27
로연구기간중에서최대였으며,
중부에서1.16,
그리고하부에서1.14
로서높은값을보였다. 엽록소 농도
본연구정점에서엽록소
a
농도는평균92.52 mg/m
2로66.00- 120.73 mg/m
2의계절적변화를보였으며, 7
월에최소였고10
월에최대였다(Fig. 4A).
연구기간에조간대조위별엽록소a
농 도는상부에서59.66 mg/m
2,
중부에서137.35 mg/m
2,
하부에 서80.57 mg/m
2으로중부에서최대값을보였다.
조간대상부 에서엽록소a
농도는31.47-90.88 mg/m
2로서7
월에최소이고10
월에최대였다.
중부에서는7
월에최소(97.11 mg/m
2)
이고10
월에최대값(183.44 mg/m
2)
을보였으며,
하부에서는69.42- 89.47 mg/m
2로서7
월에최소였고4
월에최대였다.
Phaeopigment
농도는연구기간에평균33.11 mg/m
2(22.53- 50.78 mg/m
2)
로서12
월에최소였고10
월에최대로나타났다(Fig. 4B).
조위별phaeopigment
는상부에서61.58 mg/m
2로 서중부(22.48 mg/m
2)
와하부(15.28 mg/m
2)
에비해현저하게 Table 2. Seasonal variations in biodiversity index at three tidal lev-els of Jinsanri, Taean, Korea during the study period Shore
level Apr. Jul. Oct. Dec. Mean
High 3.43 3.33 3.53 3.71 3.50
Mid 3.47 3.43 3.18 3.05 3.28
Low 3.37 3.33 3.09 2.89 3.17
Mean 3.42 3.36 3.27 3.22 3.32
Table 3. Seasonal variations in phaeopigment/chlorophyll a (P/C) at three tidal levels of Jinsanri, Taean, Korea over the study period
Shore level Apr. Jul. Oct. Dec. Mean
High 0.67 1.28 1.10 1.38 1.11
Mid 0.18 0.33 0.13 0.06 0.18
Low 0.12 0.27 0.31 0.06 0.19
Mean 0.32 0.63 0.51 0.50 0.49
Dec(M) Dec(L) Oct(H) Oct(M) Oct(L) Apr(H) Apr(M) Apr(L) Dec(H) Jul(L) Jul(H) Jul(M)
GroupⅠ GroupⅡ GroupⅢ GroupⅣ 20
40
60
80
100
Bray Curtis Similarity
Korea
East SeaWest Sea
South Sea
0 50 100 Km
126°E 128°E 130°E
38°N
36°N
34°N N
0 4 8 km a cb
Taean Jinsanri
Fig. 2. Results of cluster analysis performed based on Bray-Curtis similarity from standardised species presence/absence transformed data. The dotted lines indicate no significant difference between the sampling times and shore height within each group (SIMPROF test).
높게나타났다
.
조간대상부에서phaeopigment
농도는40.19- 100.10 mg/m
2으로서7
월에최소이고10
월에최대였다.
중부에 서는12
월에최소(8.16 mg/m
2)
이고7
월에최대값인32.25 mg/
m
2을보였으며,
하부에서는4.48-27.49 mg/m
2로서12
월에최 소그리고10
월에최대였다.
Phaeopigment/Chlorophyll a (P/C)
의비율은평균0.49
였으 며,
계절별로보면, 4
월에최소인0.32
이고7
월에0.63
으로최대 였다(Table 3).
조위별로는조간대상부에서1.11
로최대였고중 부와하부는매우유사한값을보였다.
조위별P/C
값의변화를 보면,
상부에서는4
월에최소값인0.67
을그리고12
월에최대 값인1.38
을보였다.
조간대중부에서는0.06-0.33
으로12
월에 최소값을7
월에최대값을보였으며,
하부에서는0.06-0.31
로서12
월에최소이고10
월에최대값을나타냈다.
주요종
연구기간동안정량샘플에서계절별로출현한저서미세조류 의세포수는평균
183,121 cell/cm
2로봄철인4
월에최대이고여 름철인7
월에최소였다.
출현종수도4
월에56
종으로출현종이 최소인7
월(35
종)
에비해1.6
배의차이가있었다(Table 4).
계 절별생물량을구성하는주요종(>2.0%)
은4
월에5
종(
전체생 물량의74.34%), 7
월에12
종(81.08%), 10
월에8
종(87.93%),
그리고12
월에는8
종(78.20%)
으로나타났다(Table 4).
연구기 간에모든계절에세포수가많은종은Paralia sulcata, Navicula sp.
와Delphineis surirella
로모두규조류이며,
와편모조류3
종Table 4. Seasonal average abundance and percentage of dominant microphytobenthos species (>2%) growing at three intertidal shore levels of Jinsanri, Taean, Korea
Species Abundance (cells/cm2) Percentage (%)
Apr. Jul. Oct. Dec. Apr. Jul. Oct. Dec.
Amphora holsatica 1,699 2.16
Amphora sp. 2,548 10,333 3.24 4.36
Asteronella kariana 3,397 2.63
Biddulphia obtusa 6,369 5,520 2,972 2.21 7.03 2.30
Ceratium fusus 8,917 11.35
Cylindrotheca closterium 4,246 3.29
Cylindrotheca gracilis 7,219 5.59
Delphineis surirella 13,588 4,671 7,643 13,588 4.72 5.95 3.23 10.51
Dinophysis fortii 6,794 8.65
Gyrosigma sp. 6,794 2.87
Merismopedia sp. 6,794 101,062 8.65 42.68
Navicula cancellata 25,902 9,200 5,945 9.00 3.89 4.60
Navicula sp. 18,259 5,520 7,360 12,739 6.34 7.03 3.11 9.86
Oscillatoria sp. 50,955 21.52
Paralia sulcata 149,894 12,739 14,862 50,955 52.06 16.22 6.28 39.43
Pediatrum sp. 4,246 5.41
Plagiogramma appendiculatum 2,548 3.24
Protoperidinium sp. 1,699 2.16
Dominant species 214,012 63,695 208,209 101,062 74.33 81.09 87.94 78.21
Total 287,898 78,556 236,801 129,229 100.00 100.00 100.00 100.00
No of species 56 35 39 40
0.16
0.12
0.08
0.04
0.00 1.60
1.40
1.20
1.00
0.80
High Mid Low (A)
(B)
NDVI VI
Apr Jul Oct Dec
High Mid Low (A)
(B)
Apr. Jul. Oct. Dec.
Apr. Jul. Oct. Dec.
240 200 160 120 80 40 0
240 200 160 120 80 40 0
Chlorophyll a (mg/m
2) Phaeopigment (mg/m
2)
Apr. Jul. Oct. Dec.
High
Apr. Jul. Oct. Dec.
Apr. Jul. Oct. Dec.
Mid
Low
In di vi du al s/ m
2In di vi du al s/ m
2In di vi du al s/ m
20 100 200 300 400 500
0 400 800 1200 1600 2000
600 1200 1800 2400 3000 3600
Apr. Jul. Oct. Dec.
High
Apr. Jul. Oct. Dec.
Apr. Jul. Oct. Dec.
Mid
Low
Umbonium thomasi Mactra veneriformis Bullacta exarata Sinonovacula
In di vi du al s/ m
2In di vi du al s/ m
2In di vi du al s/ m
20 100 200 300 400 500
0 400 800 1200 1600 2000
0 600 1200 1800 2400 3000 3600
Apr. Jul. Oct. Dec.
High
Apr. Jul. Oct. Dec.
Apr. Jul. Oct. Dec.
Mid
Low
In di vi du al s/ m
2In di vi du al s/ m
2In di vi du al s/ m
20 100 200 300 400 500
0 400 800 1200 1600 2000
0 600 1200 1800 2400 3000 3600
Umbonium thomasi Reticunassa
festiva Mactra veeriformis Maretrix
lusoria Bullacta exarata Neanthes
japonica Sinonovacula constricta
Fig. 3. Seasonal variations of NDVI (A) and VI (B) at three inter- tidal shore levels (High, Mid, and Low) of Jinsanri mudflat, Taean, Korea during the study period.
(Ceratium fusus, Dinophysis fortii, Protoperidinium sp.)
은여 름철인7
월에우점(
전체생물량의22.16%)
하였다.
남조류인Merismopedia sp.
는7
월과10
월, Oscillatoria sp.
는10
월에우 점하는계절종이었으며,
담수녹조류인Pediatrum sp.
도여름 철에만관찰되었다(Table 4).
조위별저서미세조류의세포수는
97,240-215,924 cells/cm
2였으며
,
출현종은48-57
종으로서 생물량은 중부에서 최대였고 출현종수는 상부에서 최대였다
(Table 5).
조위별 주요종(>2.0%)
은상부에서6
종(
전체세포수의75.22%),
중부에서6
종(
세포수의81.44%),
하부에서9
종(87.93%)
으로확인되었다(Table 5).
모든조위에서우점하는종은저서성규조류인Para- lia sulcata, Navicula sp.
와Delphineis surirella
였다.
와편모조 류인Ceratium fusus
와Dinophysis fortii
는하부에서그리고남 조류인Merismopedia sp.
와Oscillatoria sp.
는중부에서우점 하여조위별로우점종에서차이가있었다(Table 5).
담수의영 향을받는종들은Ocellatoria sp.
와Merisomopedia sp.
등으로 여겨지며, Ceratium fusus
와Asterionella kariana
는부유성플 랑크톤으로사료된다.
저서 동물
연구기간에 출현한 저서동물은 서해비단고둥
(Umbonium thomasi),
왕좁쌀무늬고둥(Reticunassa festiva),
동죽(Mactra veneriformis),
백합(Meretrix lusoria),
민칭이(Bullacta exarata),
갯지렁이(Neanthes japonica),
맛조개(Sinonova culaconstricta),
좁살무늬고둥(Hinia festiva)
와밤게(Philyra pisum)
로서총9
종 이관찰되었으며,
계절별로는3-7
종이,
조위별로는6-7
종이출현하였다
(Fig. 5).
서해비단고둥은조간대상부에서 하부까지고르게분포하는종이었으며
,
조위별개체수는89-1,574 indi-
viduals/m
2로서 조간대 하부에서 최대였고 상부에서 최소였다
(Fig. 5).
서해비단고둥의계절별평균개체수는536-1,201 individuals/m
2로겨울에최소였고가을에최대였다.
연구기간 에진산리갯벌에서아우점종인동죽의조위별평균개체수는20-139 individuals/m
2로서조간대상부에서하부로이동할수 Table 5. Average abundance and percentage of dominant species (> 2%) at three intertidal shore levels over the study periodSpecies Abundance (cells/cm2) Percentage (%)
High Mid Low High Mid Low
Amphora sp. 7,643 3,291 3.54 3.38
Biddulphia obtusa 7,856 8.08
Ceratium fusus 6,688 6.88
Cylindrotheca gracilis 9,236 4.28
Delphineis surirella 8,599 13,694 7,325 3.98 5.80 7.53
Dinophysis fortii 3,503 3.60
Gyrosigma sp. 5,732 2.65
Merismopedia sp. 80,892 34.25
Navicula cancellata 25,478 3,397 10.79 3.49
Navicula sp. 19,427 9,554 3,928 9.00 4.04 4.04
Odontella aurita 2,335 2.40
Oscillatoria sp. 38,217 16.18
Paralia sulcata 111,783 24,522 35,032 51.77 10.38 36.03
Dominant species 162,420 192,357 73,355 75.22 81.44 75.43
Total 215,924 236,200 97,240 100.00 100.00 100.00
No of species 57 48 50
Fig. 4. Seasonal variations of chlorophyll a (A) and phaeopigment concentration (B) at three tidal levels (High, Mid, and Low) of Jinsanri mudflat, Taean, Korea during the study period.
0.08
0.04
0.00 1.60
1.40
1.20
1.00
0.80
(B)
NDVI VI
Apr Jul Oct Dec
High Mid Low (A)
(B)
Apr. Jul. Oct. Dec.
Apr. Jul. Oct. Dec.
240 200 160 120 80 40 0
240 200 160 120 80 40 0
Chlorophyll a (mg/m
2) Phaeopigment (mg/m
2)
Apr. Jul. Oct. Dec.
High
Apr. Jul. Oct. Dec.
Apr. Jul. Oct. Dec.
Mid
Low
In di vi du al s/ m
2In di vi du al s/ m
2In di vi du al s/ m
20 100 200 300 400 500
0 400 800 1200 1600 2000
600 1200 1800 2400 3000 3600
Apr. Jul. Oct. Dec.
High
Apr. Jul. Oct. Dec.
Apr. Jul. Oct. Dec.
Mid
Low
Umbonium thomasi Mactra veneriformis Bullacta exarata Sinonovacula
In di vi du al s/ m
2In di vi du al s/ m
2In di vi du al s/ m
20 100 200 300 400 500
0 400 800 1200 1600 2000
0 600 1200 1800 2400 3000 3600
Apr. Jul. Oct. Dec.
High
Apr. Jul. Oct. Dec.
Apr. Jul. Oct. Dec.
Mid
Low
In di vi du al s/ m
2In di vi du al s/ m
2In di vi du al s/ m
20 100 200 300 400 500
0 400 800 1200 1600 2000
0 600 1200 1800 2400 3000 3600