Estimation of Permeability of Green Sand Mould by Performing Sensitivity Analysis on Neural Networks Model
Subba Reddy. N
†, Yong-Hyun Baek, Seong-Gyeong Kim and Hur Bo Young
School of Materials Science and Engineering, Gyeongsang National University, Jinju 660-701, KoreaAbstract
Permeability is the ability of a material to transmit fluid/gases. It is an important material property and it depends on mould parameters such as grain fineness number, clay, moisture, mulling time, and hardness. Modeling the relationships among these variable and interactions by mathematical models is complex. Hence a biologically inspired artificial neural-network technique with a back-propagation-learning algorithm was developed to estimate the permeability of green sand. The developed model was used to perform a sensitivity analysis to estimate permeability. The individual as well as the combined influence of mould parameters on permeability were simulated. The model was able to describe the complex relationships in the system. The optimum process window for maximum permeability was obtained as 8.75-10.5% clay and 3.9-9.5% moisture. The developed model is very useful in understanding various interactions between inputs and their effects on permeability.
Key words: Green sand mould, Permeability, Neural networks, Sensitivity analysis
1. Introduction
Green sand mould is widely used in industry and accounts more than half of the market share due to relatively low cost and simple production process in spite of some defects such as distortion and cracking. Permeability is the property of being permeable and indicates the rate of flow of a liquid or gas through a porous material. The increase in permeability indicates a more open structure in the rammed sand and it will lead to penetration-type defects and rough castings. A decrease in permeability indicates tighter packing and could lead to blows and pinholes. If permeability of the mould is not sufficient to allow the escape of the generated gases, mold pressures will increase, impeding the flow of molten metal or even causing the metal to be blown from the metal therefore, adequate mold porosity is very important. The permeability of sand depend primarily on the size, shape of the sand grains, the clay content, and the correct quantity of water and the
sand itself were rammed to a particular degree of hardness.
As the relationships among these parameters are nonlinear and complex in nature, it is challenging to develop them in the form of mathematical equations. Methods such as linear regression are not well suitable for accurate modeling of data which exhibits considerable noise.
In general sand control has been accomplished by esti- mating of the physical properties of sand mixtures [1,2] and a few new methods were proposed by various researchers [3,4].
Doege and Schmacher used computer to control the sand parameters [5,6]. Many researchers proved the importance of grain size, clay, moisture, mulling time on properties, behavior of the sand mixtures and modeled. However, those reports have been limited to predict quantitatively. The method using neural networks has been identified as a suitable way for overcoming these difficulties [4,7-9]. Earlier publications de- veloped neural networks models by using some experimental data and predicting the remaining data and reporting their
Received: May. 23, 2014 ; Revised: Jun. 23, 2014 ; Accepted: Jun. 25, 2014
†
Corresponding author: N. S. Reddy (Gyeongsang National Univ.) Tel: +82-55-772-1669, Fax: +82-55-772-1670
E-mail: [email protected]
Journal of Korea Foundry Society 2014. Vol. 34 No. 3, pp. 107~111 http://dx.doi.org/10.7777/jkfs.2014.34.3.107 ISSN 1598-706X
© Korea Foundry Society, All rights reserved.
This is an Open-Access article distributed under the terms of the Creative Commons Attribution Non-Commercial License (http://creative-
commons.org/licenses/by-nc/3.0) which permits unrestricted non-commercial use, distribution, and reproduction in any medium, provided the
original work is properly cited.
predictions with respective errors. To the authors best of knowledge, the earlier research is limited to predict the unseen data samples and there are no reports of analyzing the rela- tionships between mould parameters and properties. Hence, the main objective of the present work is to develop a model to predict the relationship of the permeability by performing sensitivity analysis with respect to mould parameters.
2. Data and Modeling Procedure
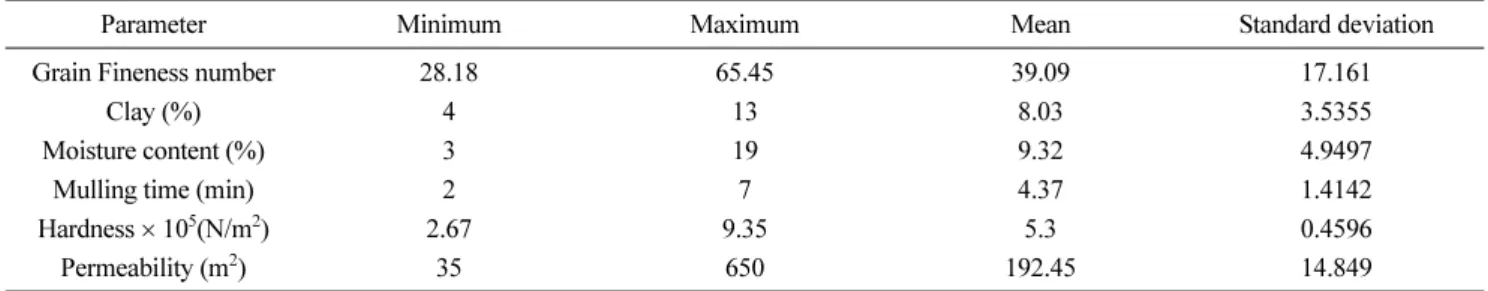
The experimental data set consists of mould controlling parameters namely, grain fineness number, clay, moisture, mulling time, hardness and the permeability. The grain fineness number (GFN) is the number of mesh per inch of the sieve that would just pass the sample if its grains were of a uniform size. The details of experimental procedure and the data can be found elsewhere [7,10]. A total of 78 datasets used in developing the present model and the statistics of the data used in developing the model was shown in Table 1.
A well-established feed forward neural network model consists of an input layer and an output layer with as many units as their respective number of variables and the complete description of the algorithm is found elsewhere [11]. In- between the input and output layers are the hidden layers, each having a certain number of nodes, the actual number of which depends heavily on the system and the acceptable error level of the model. The error-correction step takes place after a pattern is presented at the input layer and the forward propagation is completed. Each processing unit in the output layer produces a single real number as its output, which is compared with the targeted output specified in the training set. Based on this difference, an error value is calculated for each unit in the output layer. The dependence, (or weight), of each of these units is adjusted for all of the interconnections that are established with the output layer. After this, the second sets of weights are adjusted for all the interconnec-
tions coming into the hidden layer that is just beneath the output layer. The process is continued until the weights of the first hidden layer are adjusted. Thus, the correction mechanism starts with the output units and propagates backward through each internal hidden layer to the input layer. Hence the term back-error propagation or back propa- gation (BP). A BP network is trained using supervised learning mechanism. The network is presented with patterns, (inputs and targeted outputs), in the training phase. Upon each presentation, the weights are adjusted to decrease the error between the networks’ output and the targeted output.
Various features in model development were clearly discussed in the earlier publications [12,13]. Sensitivity analysis was carried out on trained neural networks model. Sensitivities provide a first approximation of the effect of various perturb- ations, and so provide an initial assessment as to which interventions might be most useful. There are several ways to approach sensitivity analysis [14,15]. The present work, we used brute force approach: In the brute force approach, to perform a one way sensitivity analysis of neural network model, each input parameter of the network is varied sys- tematically at smaller intervals and the effect on the outputs of the model investigated. The sensitivity analysis procedure used in the present work explained in detail in earlier publications.
3. Results and Discussions
The results generated by the model are voluminous; hence we present a few representative results. The model can be used for the analysis of the data. For example, it is useful to predict the effect and the influence of an individual element or two on the permeability for any particular combination of input variables keeping the remaining unchanged. Sensitivity analysis helps to identify the important relationships between inputs and output [8,12,13]. Fig. 1 shows the predicted per-
Table 1.
Statistics of the data used for the developing the model.Parameter Minimum Maximum Mean Standard deviation
Grain Fineness number 28.18 65.45 39.09 17.161
Clay (%) 4 13 8.03 3.5355
Moisture content (%) 3 19 9.32 4.9497
Mulling time (min) 2 7 4.37 1.4142
Hardness × 105(N/m2) 2.67 9.35 5.3 0.4596
Permeability (m2) 35 650 192.45 14.849
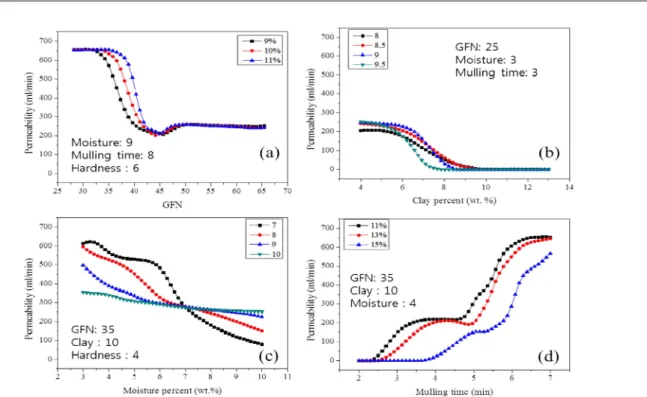
meability by sensitivity analysis varying GFN, % clay, % moisture and mulling time in minutes. The other three elem- ents kept unchanged and their values were shown in re- spective figures.
Fig. 1(a) Predicted curves showing the effect of GFN on Permeability at 9%, 10% and 11% clay additions. Grain fineness number is proportional to the surface area per unit weight of sand exclusive of clay. Permeability is controlled by the amount and size of the voids between densely packed sand grains. The size of the voids is determined by size, size distribution, shape, and packing pattern of the grain.
Small grain size enhances mold strength, but large grain size is more permeable. The permeability decreased with increase in grain fineness number from 28 to 45 at all the addition levels of clay. Further increase in GFN is insignificant irrespective of change in % clay, and the probable reason may be due to mould sand filled densely.
Fig. 1(b) shows the effect of clay on permeability at dif- ferent hardness. This figure clearly shows that the increase in clay contents makes poor permeability. This phenomenon is expected as the clay content increased, more fine clay particles occupy the available spaces between the sand grains, and thereby lowering the permeability of the mixture.
The influence of hardness on permeability is insignificant.
Fig. 1(c) shows the effect of moisture on permeability at 7, 8, 9 and 10 of mulling times. Addition of moisture has decreased the permeability at all the mulling times. It is due to the large amount of water available with the increase in moisture percentage and the air gaps in sand grains were filled and it makes poor permeability. Fig. 1(d) shows the calculated curves of mulling time on the permeability at Fig. 1.
Predicted curves showing the effect of input parameters on permeability. (a) Change in GFN, (b) Change in clay percentage, (c) Changein Moisture percentage and (d) Change in Mulling time in min.
Fig. 2. Combined effects of clay and moisture on the permeability (at 30 GFN, 5.2 min mulling time, 2.5
× 10
5N/m2 hardness.11%, 13%, and 15% moisture percentage. The increase in mulling time has increased the permeability. The lower amount of moisture makes higher permeability.
Fig. 2 shows the surface map of the combined effect of clay and moisture parameters on permeability. The grain fineness number, mulling time and hardness were kept constant as 30, 5.2 and 2.5
×10
5N/m
2respectively. Various color codes shown in Fig. 2 indicate the range of permea- bility as a function of variation in clay and moisture. The predicted contour shapes indicate the complex relationship between the input parameters and the permeability. Each individual point indicates one system. The low percentage of clay require small amount of moisture to have high per- meability. As clay percentage increases, the gaps of the grain sand will be filled with clay and thereby reducing perme- ability significantly. The prediction of poor permeability at higher values of clay and moisture resulted as expected. This contour map helps to understand the range of optimum conditions for the desired permeability and the optimum process window for the maximum permeability is 8.75- 10.5% clay and 3.9-6.3% moisture.
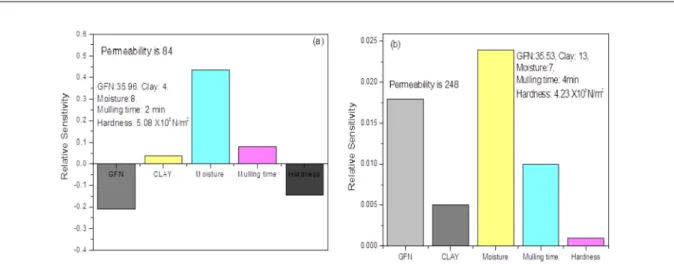
Fig. 3 shows the relative sensitivity of all the inputs on permeability. It will help us to identify which parameters con- tributing to achieve particular value. Two different samples were considered and their permeability values are 84 and 248 respectively. The relative sensitivity explains the con- tribution of each input parameter to achieve the permeability.
In the case of lower permeability GFN and hardness affected negatively. Higher permeability was obtained due to the positive contribution of all the elements and it the uncer- tainties in predictions requires further elaborative study. The
estimation of permeability of green sand mould by perfor- ming sensitivity analysis on neural networks model predic- tions showed that a trained neural network can be used for relationships between inputs and outputs unlike previous neural-network techniques used primarily for predictions of particular values [4,9,10].
4. Conclusions
Present model capability to map the complex nature of the mould system has been demonstrated. Sensitivity analysis can be used to examine the effects of input variables on the permeability, which is incredibly difficult to do experimen- tally. The model successfully reproduces many experimentally observable trends and general features of permeability.
Results predicted by the model provide useful information from relatively small experimental databases. The present model helps in reducing the experiments required and thereby saving a lot of money, material and manpower for designing the new moulds for desired properties. The model predicted the optimum process window for the maximum permeability is 8.75-10.5% clay and 3.9-6.3% moisture. The effectiveness and efficiency of the model can be improved further by adding more reliable experimental data.
Acknowledgements
This study was supported by basic Science Research Program through the National Research Foundation (NRF) of Korea funded by the Ministry of Education, Science and Technology (NRF-2013R1A1A2013823).
Fig. 3.
Relative sensitivities of input parameters for two permeability values.References
[1] Zrimsek AH and Heine RW, Transactions of AFS, “Clay, fines, and water relationships for green strength in moulding sands”, 63 (1955) 575-581.
[2] Heine RW and Schumacher JS, Modern Casting, “Dry strength relationships from green moulding sands”, 54 (1968) 594-506.
[3] Solderling LA, Modern Casting, “New method determines active clay in moulding sand”, 49 (1966) 95-98.
[4] Parappagoudar MB, Pratihar DK, and Datta GL, Applied Soft Computing, “Forward and reverse mappings in green sand mould system using neural networks”, 8 (2008) 239-260.
[5] Doege RL, Transactions of AFS, “Data collection for com- puter analysis of casting quality factors”, 73 (1966) 132-133.
[6] Schumacher, J.S., Brit. Foundryman, “Computer control of sand”, 64 (1971) 121-125
[7] Karunakar DB, and Datta GL, Applied Clay Science, “Con- trolling green sand mould properties using artificial neural networks and genetic algorithms - A comparison”, 37 (2007) 58-66.
[8] Reddy NS, Prasada Rao AK, Chakraborty M, Murty BS, Materials Science and Engineering A, “Prediction of grain size of Al-7Si Alloy by neural networks”, 391 (2005) 131- 140.
[9] Nagur Babu N, Ohdar RK, and Pushp PT, International Journal of Cast Metals Research,“Evaluation of green com- pressive strength of clay bonded moulding sand mix: Neural network and neuro-fuzzy based approaches”, 19 (2006) 110- 115.
[10] Karunakar DB, and Datta GL, Indian Foundry Journal,
“Modelling of green sand mould parameters using artificial neural networks”, 49 (2003) 27-36.
[11] Zurada JM, An introduction to computing with neural nets, West publishing company, New York (1992) 163.
[12] Reddy NS, Krishnaiah J, Hong SG, Lee JS, Materials Science and Engineering A “Modeling medium carbon steels by using artificial neural networks”, 508 (2009) 93-105.
[13] Reddy NS, Lee CS, Kim JH, Semiatin SL, Materials Science and Engineering A, “Determination of the beta-approach curve and beta-transus temperature for titanium alloys using sensitivity analysis of a trained neural network”, 434 (2006) 218-226.
[14] Montaño JJ, and Palmer A, Neural Computing and Applica- tions, “Numeric sensitivity analysis applied to feedforward neural networks”, 12 (2003) 119-125.
[15] Coupé VMH, Van Der Gaag LC, and Habbema JDF, Know- ledge Engineering Review, “Sensitivity analysis: an aid for belief-network quantification”, 15 (2000) 215-232.