• 검색 결과가 없습니다.

Effects of Renewal Pattern of Recycled Nutrient Solution on the Ion Balance in Nutrient Solutions and Root Media and the Growth and Ion Uptake of Paprika (Capsicum annuum L.) in Closed Soilless Cultures

N/A
N/A
Protected

Academic year: 2021

Share "Effects of Renewal Pattern of Recycled Nutrient Solution on the Ion Balance in Nutrient Solutions and Root Media and the Growth and Ion Uptake of Paprika (Capsicum annuum L.) in Closed Soilless Cultures"

Copied!
10
0
0

로드 중.... (전체 텍스트 보기)

전체 글

(1)

Research Report

Effects of Renewal Pattern of Recycled Nutrient Solution on the Ion Balance in Nutrient Solutions and Root Media and the Growth and Ion Uptake of Paprika (Capsicum annuum L.) in Closed Soilless Cultures

Myat Thaint Ko 1,2† , Tae In Ahn 1,2† , Jong Hwa Shin 1,2 , and Jung Eek Son 1,2

1

Department of Plant Science, Seoul National University, Seoul 151-921, Korea

2

Research Institute for Agriculture & Life Sciences, Seoul National University, Seoul 151-921, Korea

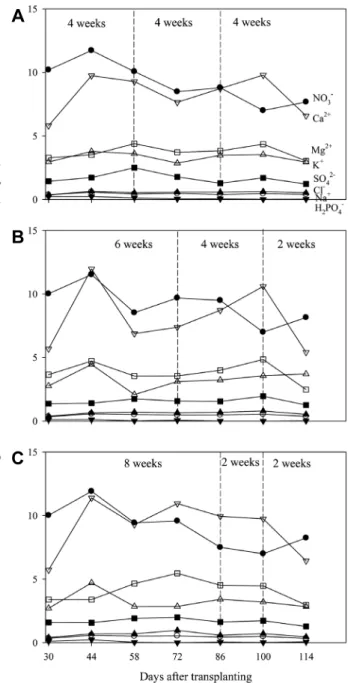
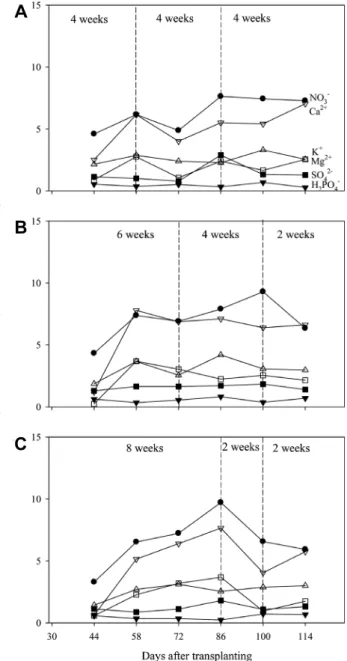
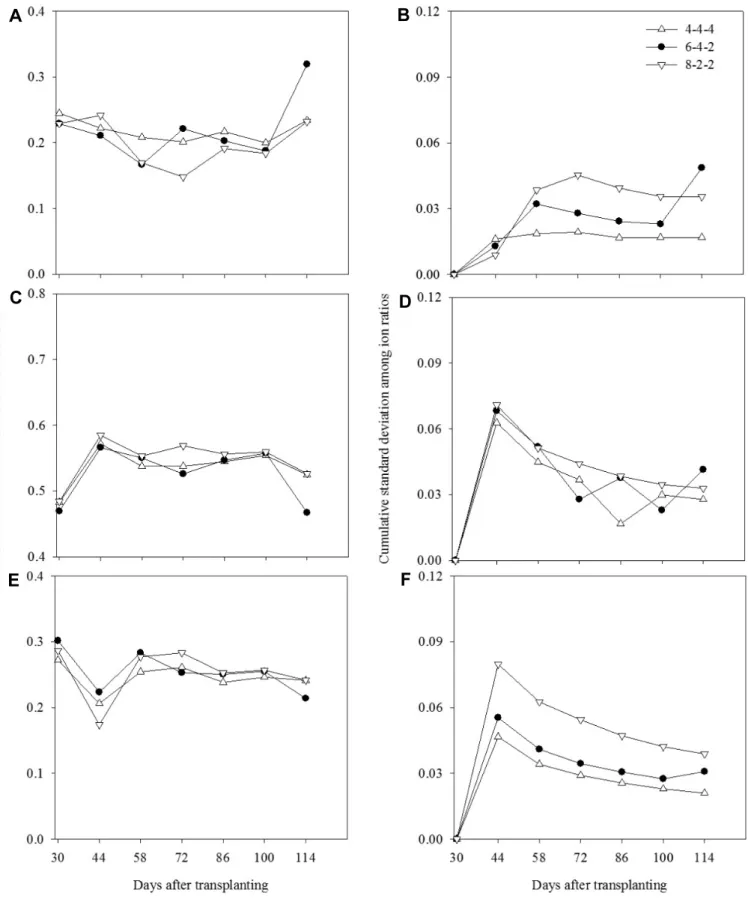
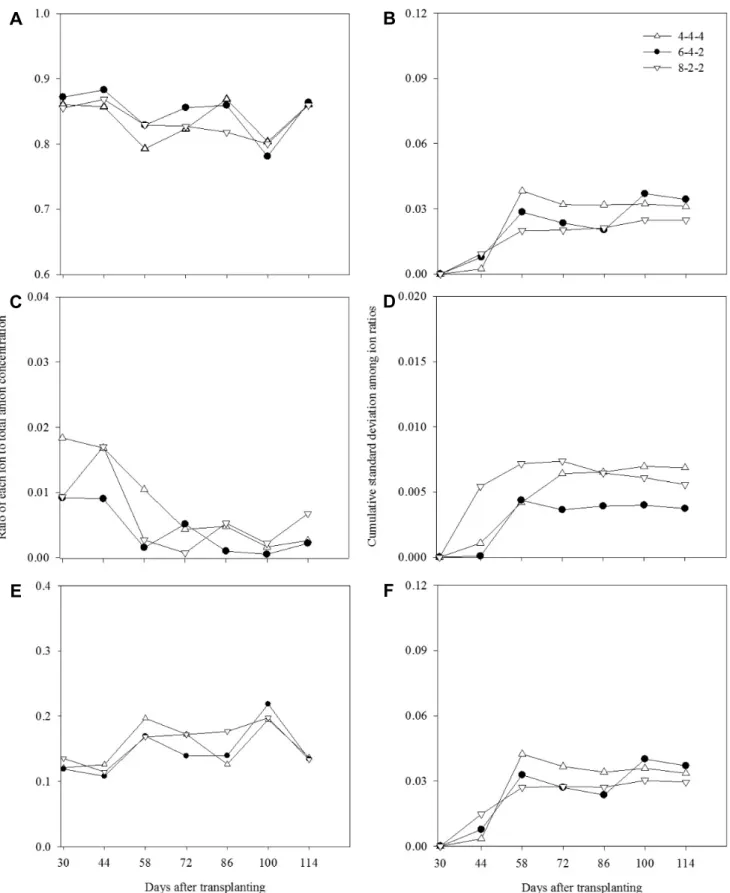
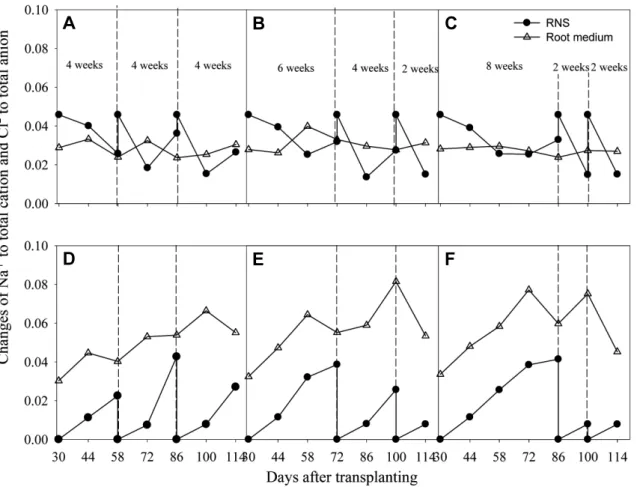
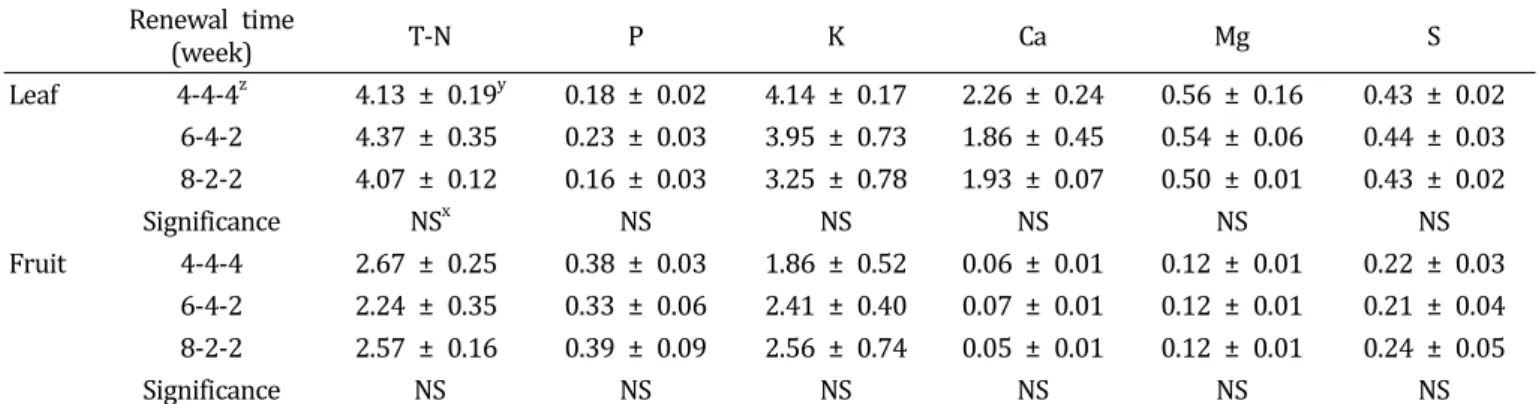
Abstract: Ion imbalance in recycled nutrient solutions is caused by selective ion uptake of plants, which occurs at different rates in different growth stages. The objectives of this study were to investigate the ion balances in both recycled nutrient solutions and rockwool media using different renewal patterns for the nutrient solutions, and to analyze the subsequent effects on uptake of water and nutrients. Over 12 weeks of paprika cultivation, two different renewal patterns (week units) of 6-4-2 and 8-2-2 weeks were compared with a constant renewal pattern of 4-4-4 weeks (control). The nutrient solution in the reservoir tank was constantly maintained at EC 2.5 dS・m
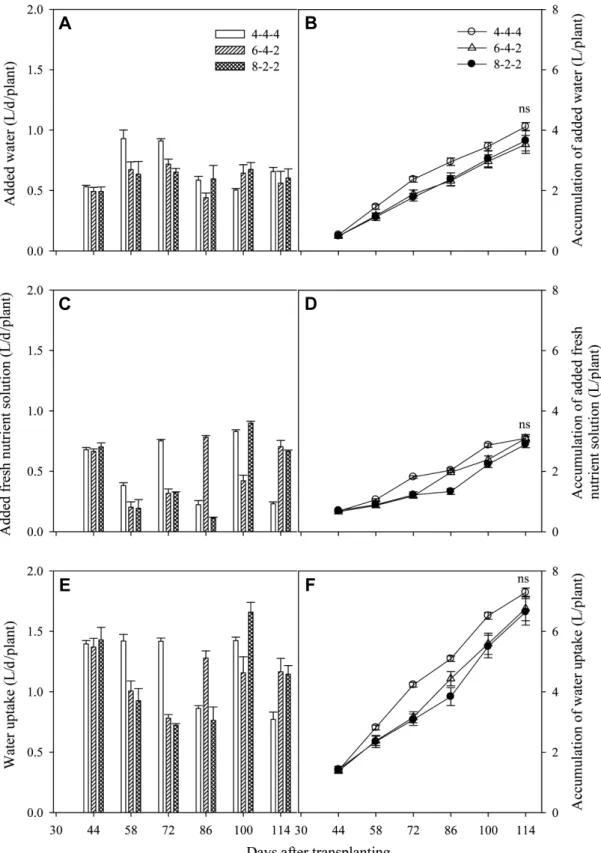
-1

and pH 5.5-6.5. The changes in the ion balance with the 4-4-4 week pattern were smaller than those with the other treatments. In the early growth stage, however, the ion balances similarly changed among all treatments. Greater changes were subsequently observed for the 6-4-2 week pattern. Although fruit yield and shoot fresh weight of paprika were the lowest with 6-4-2 renewal pattern, no significant differences were observed. Our results indicate that renewal intervals can be extended in consideration of growth stage for more efficient and practical operations in closed soilless cultures.

Additional key words: electrical conductivity, growing stage, mineral contents, nutrient adjustment

*Corresponding author: [email protected]

These authors contributed equally to this work.

※ Received 21 August 2013; Revised 14 March 2014; Accepted 2 April 2014. This research was supported by iPET (Korea Institute of Planning and Evaluation for Technology of Food, Agriculture, Forestry, and Fisheries).

Ⓒ 2014 Korean Society for Horticultural Science

Introduction

Due to limited water resource, increased fertilizer price, and environmental pollution, the importance of closed soilless cultures systems is steadily increasing (Holmer et al., 2013). Nevertheless, applications of the system to commercial soilless cultures are still scarce with technical difficulties (Massa et al., 2011) including ion imbalance in the recycled nutrient solution (Hao and Papadopoulos, 2002; Zekki et al., 1996). To maintain ion balances in both recycled nutrient solutions and root media, an adequate management of nutrient solutions is required (Ahn and Son, 2011; Hao and Papadopoulos, 2002; Zekki et al., 1996).

Although a real time measurement by ion sensors is

an ideal approach for accurate nutrient control, stable

operations are not still guaranteed on commercial basis

(Bratov et al., 2010). Instead, electrical conductivity (EC)-

based nutrient control is widely used in commercial closed

soilless cultures (Savvas, 2002). To minimize the change

in ion balance in the EC-based system, consumed nutrient

solution was normally replenished by tap water and stock

solutions manually or by an automated system (Savvas

and Manos, 1999). Subsequently the periodical adjustment

of recycled nutrient solutions was introduced for more

efficient management of nutrient solutions, for instance,

every two weeks. (Savvas, 2002). However frequent analysis

acts as a drawback in commercial closed soilless cultures

(2)

and therefore adequate intervals should be reviewed.

For the adjusting interval of recycled nutrient solutions, Ko et al. (2013a, 2013b) investigated the growth of paprika under different renewal periods with the constant interval.

However, for more practical operation of closed soilless culture systems, extended adjusting intervals are more favorable. As nutrient uptake rate increases with growth stage (Pardossi et al., 2005; Silberbush et al., 2005), adjusting intervals can be flexibly designed with variable renewal patterns considering the stage. The aim of this study was to investigate the ion balances in recycled nutrient solutions and root media at different renewal patterns, and their subsequent effects on uptakes of water and nutrients by paprika for seeking possible ways to extend the adjusting periods.

Materials and Methods Experimental Conditions

This experiment was conducted in a Venlo-type greenhouse at the experimental farm of Seoul National University (Suwon, Korea, Latitude 37.3°N, Longitude 127.0°E). Paprika (Capsicum annuum L. cv. Fiesta) seedlings were planted on the rockwool cube (10 cm × 10 cm × 6.5 cm) at the beginning of April, 2012. One month after planting on rockwool cubes, plants were transplanted in rockwool slabs (100 cm × 15 cm × 7 cm) (Grotop expert, Grodan, The Netherlands) at a density of 3 plants/m 2 . The experiment started 30 days after transplanting (DAT) when average plant height was 90 cm at fruit initiation. Average radiation ranged from 2.6 to 5.5 MJ・m -2 ・d -1 and average temperature was controlled at 24.6 to 31.6°C by hot-water heating systems inside the greenhouse. All the plants were supplied with the nutrient solution of EC 2.5 dS・m -1 and pH 5.5 to 6.5. Nine slabs were used for the experiment. Each slab, in which three plants were grown, was placed on each gutter (100 cm × 20 cm × 10 cm). Additional plant management of pruning and training was carried out every week. Different renewal patterns of the recycled nutrient solutions were applied: 4-4-4 weeks (constant renewal at week 4, 8, and 12) as a control, 6-4-2 and 8-2-2 weeks (different renewals at week 6, 10, and 12 and at week 8, 10, and 12, respectively) as treatments were compared.

Management of Nutrient Solutions

Compositions of the nutrient solution was based on the standard of Research Station for Floriculture and Glasshouse Vegetables (PBG, the Netherlands): 14.17 NO 3 - , 1.14 H 2 PO 4 - ,

5.92 K + , 8.85 Ca 2+ , 3.17 Mg 2+ , and 3.20 SO 4 2- (in meq・L -1 ) as macro elements; and 1.05 Fe 2+ , 0.64 Zn 2+ , 0.09 Cu 2+ , 0.57 Mn 2+ , and 0.08 MoO 4 2- (in ppm) as micro elements.

After irrigation event, the drainage was returned to the reservoir tank (52 cm × 26 cm × 26 cm). EC and pH in the reservoir tanks were monitored every three days by using a multi meter (Multi 3420 SET C, WTW, Germany).

EC and water content in the root media were measured by using a TDR sensor (Grodan, WCM-control, Denmark).

To maintain the set EC of 2.5 dS・m -1 , fresh water (EC 0.17 dS m -1 and pH 7.11) containing 0.21 Na + , 0.29 Cl - , 0.04 K + , 0.71 Ca 2+ , 0.21 Mg 2+ , 0.19 SO 4 2- , 0.39 NO 3 - , and 0.04 PO 4 3- (in meq・L -1 ) was added and then fresh nutrient solution added to reach the fixed volume of nutrient solution (20 L) in the tank. Total nine tanks were used for the experiment. To adjust the pH, 1N nitric acid was used.

Irrigation Based on Solar Radiation

The nutrient solution was supplied by drip irrigation with one emitter (average flow rate of 3 L・h -1 ) per plant based on solar radiation integral (SRI). Solar radiation (W・m -2 ) inside the greenhouse was measured every 10 s by a pyranometer (SQ-110-L10, Apogee, USA) at a height of 2 m from the ground and recorded at was connected to a data-logger (CR-1000, Campbell Scientific, USA). Whenever inside greenhouse SRI reached the set value, irrigation was started. Drainage was controlled within 30 to 50%.

SRI was set 50 J・cm -2 and the irrigation lasted 3 to 4 min per event (150-200 mL/dripper) depending on the percentage of drainage amount. The irrigation frequency was checked every day online and was 8 to 10 times per day in average. During rainy day, the nutrient solution was manually supplied.

Analyses of Plant Growth and Ion Composition in Plants Plant height and leaf area were measured from the start (30 DAT) and to the end (115 DAT) of the experiment.

Leaf area was calculated by using leaf length and width according to Tai et al. (2009). Fully-matured leaves at the 4 th and 5 th nodes from the top of the stem were collected at 115 DAT to measure the nutrient uptake by the plants.

9 leaves were sampled in each treatment. Leaves were

washed with tap water to remove dust or other contamination

and dried for 48 h at 70°C. Fruits were harvested two

times at 87 DAT (8 weeks after treatment) and 115 DAT

(at the end of experiment). At each harvest, fruit number,

fruit fresh and dry weights were measured. For the analysis

(3)

of fruit mineral content, the matured fruit (three fruits per treatment) at the end of experiment were dried in a thermo-ventilated oven at 70°C until they reached a constant weight. The dried leaf and fruit samples were grinded by boll-mil. The 0.5 g of grinded sample was placed into a teflon tube and 10 mL of concentrated nitric acid was added to each tube. For rapid processing, the tubes were placed into blacks and heated to 90°C on a hotplate.

The samples were heated at 90°C for about 1 h or until copious fume evolution subsides. The 1 mL of concentrated perchloric acid was added and the solution temperature was set to maintain at 180°C. The samples were digested until the denseness of the white fumes and continually heated to a clear solution. After the digest, the tube was cooled and 25 mL of deionized water was filled up. The nutrient contents of K, Ca, Mg, P, and S were determined by an inductively-coupled plasmaoptical emission spectrometer (ICP-730ES, Varian Australia Pty Ltd., Australia). Total-N was measured by Kjeldahl (Kjeltec 8400, Foss, Sweden).

Estimation of Water and Nutrient Uptake

The water uptake (L・m -2 ) by the plants was estimated using the difference between initial and final volumes in each reservoir tank (20 L) and the changes in the water contents of root media every two weeks. The evaporation or leakage from the tank was prevented and the evaporation from the rockwool cube was not considered. Water contents in the root media were 60%-70% when measured. Every two weeks, 50 mL of nutrient solutions from the reservoir tanks and root media were collected and analyzed. NO 3 - , H 2 PO 4 - , Cl - , and SO 4 2- were measured by a spectrophotometer (PhotoLab, 6100 [VIS], Germany) with an anion test kit (Spectroquant, Merck KGaA, Darmstadt, Germany), and K + , Ca 2+ , Mg 2+ , and Na + were measured by the ICP-730ES.

Ion in recycled nutrient solution (meq・L -1 )

= (C r V r + C w V w + C f V f ) / (V r + V w + V f ) (1) Water uptake (L, WU) = (V w + V f ) + (V r1 – V r2 ) (2) Nutrient uptake concentration (meq・L -1 )

= [C f V f – {(V r1 C r1 – V r2 C r2 ) + V s (C s1 – C s2 )}] / WU (3 ) where, C r , C w , C f , and C s are ion concentrations (meq・L -1 ) in the recycled nutrient solution, added water, added fresh nutrient solution, and remained nutrient solution in the root media, respectively. V r , V w , V f , and V s are volumes of the recycled nutrient solution, added water, added fresh nutrient solution, and remained nutrient solution in the

root media (L・m -2 ), respectively. 1 and 2 mean the beginning and the end of every two weeks.

Individual cation (or anion) ratio was expressed by dividing cation (or anion) concentration by sum of cation (or anion) concentrations. Water uptake (L/d/plant) was calculated as WU/14 d/3 plants.

Experimental Management and Statistical Analysis

There were three plants per slab and three slabs per treatment. A randomized block design with three replications was used. The levels of nutrient accumulation or depletion in the recycled nutrient solutions and root media, and the nutrient uptake by the plants were analyzed by using the software Sigma-Plot 10 (SPSS, Inc., Chicago, IL, USA). Ion ratios were analyzed by cumulative standard deviations with time. Data were subjected to analysis of variance (ANOVA) using SAS 9.2 (SAS Institute, Cary, NC, USA).

Means and standard errors were analyzed for each nutrient.

Values of p < 0.05 were considered statistically significant by using Duncan’s multiple range tests.

Results and Discussion

Changes in Ion Concentrations in the Recycled Nutrient Solution and Root Media

The deviation of ion concentrations in the recycled nutrient solution from the initial supply was clearly observed in all the treatments and the ion imbalance was smaller in 4-4-4 weeks (control) than 6-4-2 and 8-2-2 weeks (treatments) (Fig. 1). Particularly, the imbalance of Ca 2+ and Mg 2+ in the recycled nutrient solution was affected by the renewal pattern. Ca 2+ was more accumulated in 8-2-2 weeks. Savvas and Manos (1999) and Sonneveld (2000) reported that it is needed to estimate the accumulation or depletion of K + , Ca 2+ , Mg 2+ , and Na + concentrations in the nutrient solutions managed by EC value. The depletion in NO 3 -

concentration in the recycled nutrient solution was observed,

while those in H 2 PO 4 - , SO 4 2- , and Cl - were nearly the same

within 8 weeks regardless of the renewal pattern. Ion

concentrations in the root media changed within relatively

narrow range in 4-4-4 weeks compared to those in 6-4-2

weeks (Fig. 2). Ca 2+ and Mg 2+ were more accumulated in the

root media in 8-2-2 weeks around the middle of experiment

period (72 DAT). Rouphael and Colla (2005) indicated that

the accumulation of bivalent ion like Ca 2+ and depletion of

NO 3 - and K + are well-known alterations occurring in the

composition of nutrient solutions when recycled. Accumulation

and depletion of ions were observed in all the treatments

during the experiment period. However the changes in

(4)

A

B

C

Fig. 1. Change in individual ion concentration in the recycled nutrient solution after adjusting EC and pH every three days.

Dashed-lines represent the renewal time of the recycled nutrient solution. A, B, and C indicate the renewals of the nutrient solution at week 4, 8, 12; week 6, 10, 12; and week 8, 10, and 12, respectively.

A

B

C

Fig. 2. Change in individual ion concentration in the root medium at different renewal times. Dashed-lines represent the renewal time of the recycled nutrient solution. A, B, and C indicate the renewals of the nutrient solution at week 4, 8, 12; week 6, 10, 12; and week 8, 10, and 12, respectively.

ion concentrations were different among all treatments.

Changes in Nutrient Uptake Concentrations

The added water, added fresh nutrient solutions, the total uptakes of nutrient solutions every two weeks and their accumulated values were described in Fig. 3. Although

the added amounts and the water uptake showed different with time due to the different renewal patterns, there were no significant differences in the accumulated values at DAT 114 among all the treatments.

Changes in individual uptake concentrations for 2 weeks

were smaller in 4-4-4 and 6-4-2 weeks than those in 8-2-2

weeks (Fig. 4). In general, the uptake of NO 3 - by the plants

(5)

A B

C D

E F

Fig. 3. Changes in added water (A), accumulation of added water (B), added fresh nutrient solution (C), accumulation of added

fresh nutrient solution (D), water uptake (E) and accumulation of water uptake (F) during the experimental period. 4-4-4,

6-4-2, and 8-2-2 mean the renewals of the recycled nutrient solution at week 4, 8, 12; week 6, 10, 12; and week 8, 10,

and 12, respectively. Vertical bars indicate Mean ± SE of the mean (n = 3). Different letters mean significant difference by

Duncan’s multiple range test at p < 0.05.

(6)

A

B

C

Fig. 4. Change in individual ion uptake concentration at different renewal times. Dashed-lines represent the renewal time of the recycled nutrient solution. A, B, and C indicate the renewals of the nutrient solution at week 4, 8, 12; week 6, 10, 12; and week 8, 10, and 12, respectively.

was the highest and followed by Ca 2+ , K + , Mg 2+ , SO 4 2- , and H 2 PO 4 - . Marcussi et al. (2004) indicated that NO 3 - and K + were the most extracted macronutrients by paprika and followed Ca 2+ , Mg 2+ , SO 4 2- and H 2 PO 4 - . In this study, it was observed that NO 3 - > Ca 2+ > K + > Mg 2+ > SO 4 2- > H 2 PO 4 - . It might be due to the depletion of K + when the nutrient solution was reused.

Changes in Ion Ratios in the Recycled Nutrient Solution and Root Media

The changes in cation ratios were similar among all the treatments before 100 DAT in the root media and became relatively higher in 6-4-2 weeks than 4-4-4 weeks (Fig.

5), while the change in anion ratio was stable in 4-4-4 weeks compared to other treatments (Fig. 6). Cumulative standard deviations in 4-4-4 and 8-2-2 weeks showed similar tendencies. After 58 DAT, the cumulative standard deviations reached plateau for both treatments in anions but decreased in cations, while abruptly changed after the second half of the experimental in 6-4-2 weeks. Stable changes in ion ratio in 8-2-2 weeks and a peak observed in 6-4-2 weeks mean that influence of the nutrient uptakes became greater on closed soilless cultures, and therefore the adjusting intervals could be extended in consideration of growth stage.

The accumulations of Cl - in the root media were higher than those in the recycled nutrient solution, however, Na + concentration did not consistently change in the recycled nutrient solution and root media compared to the initial concentrations (Fig. 7). Increases in Cl - ratio were gradual in 4-4-4 weeks but fast after 72 DAT in 6-4-2 weeks in the root media. Unlike the essential nutrients, control of Na + and Cl - concentrations are very difficult because the water containing both ions determines the levels of accumulations (Savvas et al., 2008).

Growth and Yield of Paprika Plants

There were no significant differences in growth and yield of paprika among all the renewal patterns of 4-4-4, 6-4-2, and 8-2-2 weeks (Table 1). According to Nukaya et al.

(1991), yields are not affected by the accumulation of Cl - and SO 4 2- in the recycled nutrient solution when the EC in the root media is maintained within the acceptable range.

The specific ion-toxic effects of Na + and/or Cl - were not related to the decrease in yield, while the accumulations of Na + and Cl - were linearly related to the concentration of major elements in the nutrient solution (Baas et al., 1995).

Mineral Contents in Leaf and Fruit

There were no significant differences in mineral contents

in leaf and fruit among all the renewal patterns (Table

2). K content in leaf was relatively higher in 4-4-4 and

6-4-2 weeks than that in 8-2-2 weeks, while the opposite

trend was observed in fruit. Ca contents in fruit and leaf

appeared to be higher in 4-4-4 weeks than those in 6-4-2

and 8-2-2 weeks. As shown in Fig. 4, Ca 2+ uptake con-

centrations in 4-4-4 and 6-4-2 weeks were higher than

(7)

A B

C D

E F

Fig. 5. Changes in individual ion ratio to total cations (left) and cumulative standard deviations of the ion ratios (right). 4-4-4,

6-4-2, and 8-2-2- mean the renewals of the recycled nutrient solution at week 4, 8, 12; week 6, 10, 12; and week 8, 10,

and 12, respectively. A and D, B and E, and C and F indicate K + , Ca 2+ , and Mg 2+ , respectively.

(8)

A

C

E

B

D

F

Fig. 6. Changes in individual ion ratio to total anions (left) and cumulative standard deviations of the ion ratios (right). 4-4-4,

6-4-2, and 8-2-2- mean the renewals of the recycled nutrient solution at week 4, 8, 12; week 6, 10, 12; and week 8, 10,

and 12, respectively. A and D, B and E, and C and F indicate NO 3 - , H 2 PO 4 - , and SO 4 2- , respectively.

(9)

A B C

D E F

Fig. 7. Change in Na + ratio to total cations (upper) and Cl- ratio to total anions (bottom) in the recycled nutrient solution (RNS), root medium, and ion uptake. Dotted lines represent the renewal time of the nutrient solution. The renewals of the nutrient solution were conducted at week 4, 8, 12 in A and D; at week 6, 10, 12 in B and E; and at week 8, 10, and 12 in C and F.

Table 1. Growth and yield of paprika in closed rockwool culture during the growing period.

Renewal time z

(week) Yield

(g・m -2 ) Shoot fresh weight (g/plant) 4-4-4 2,841.6 ± 220.8 y 1,601.4 ± 37.1

6-4-2 2,441.2 ± 189.0 1,522.2 ± 86.7

8-2-2 2,705.9 ± 745.2 1,608.3 ± 207.8

Significance NS x NS

z 4-4-4, 6-4-2, and 8-2-2 mean the renewals of the recycled nutrient solution at week 4, 8, 12; week 6, 10, 12; and week 8, 10, and 12, respectively.

y Each value represents Mean ± SD (n = 3).

x NS means non-significant by Duncan’s multiple range test at p < 0.05.

8-2-2 weeks at DAT 114 (at the end of the experiment) and reflected to its contents in leaf and fruit. Marti and Mills (1991) reported that a decline in Ca 2+ uptake occurred

when fruits approach the mature green stage.

Renewal of the recycled nutrient solution using adequate renewal patterns can reduce the ion imbalance in the recycled nutrient solutions and root media without any detrimental effects on yield and plant growth. Relatively stable control of ion ratios in the root media was obtained in 4-4-4 weeks by adjusting the recycled nutrient solution.

And the similar results were observed in 8-2-2 weeks compared to those in 4-4-4 weeks because the shorter renewal interval (2 weeks) was assigned to the latter growth stage. These results indicate that the renewal intervals can be extended rather than using constant intervals by considering the growth stage for more efficient and practical operations in closed soilless cultures.

Literature Cited

Ahn, T.I. and J.E. Son. 2011. Changes in ion balance and individual

ionic contributions to EC reading at different renewal intervals

(10)

Table 2. Leaf and fruit mineral contents at the end of experiment as influenced by renewal time of the recycled nutrient solution.

Renewal time

(week) T-N P K Ca Mg S

Leaf 4-4-4 z 4.13 ± 0.19 y 0.18 ± 0.02 4.14 ± 0.17 2.26 ± 0.24 0.56 ± 0.16 0.43 ± 0.02 6-4-2 4.37 ± 0.35 0.23 ± 0.03 3.95 ± 0.73 1.86 ± 0.45 0.54 ± 0.06 0.44 ± 0.03 8-2-2 4.07 ± 0.12 0.16 ± 0.03 3.25 ± 0.78 1.93 ± 0.07 0.50 ± 0.01 0.43 ± 0.02

Significance NS x NS NS NS NS NS

Fruit 4-4-4 2.67 ± 0.25 0.38 ± 0.03 1.86 ± 0.52 0.06 ± 0.01 0.12 ± 0.01 0.22 ± 0.03 6-4-2 2.24 ± 0.35 0.33 ± 0.06 2.41 ± 0.40 0.07 ± 0.01 0.12 ± 0.01 0.21 ± 0.04 8-2-2 2.57 ± 0.16 0.39 ± 0.09 2.56 ± 0.74 0.05 ± 0.01 0.12 ± 0.01 0.24 ± 0.05

Significance NS NS NS NS NS NS

z 4-4-4, 6-4-2, and 8-2-2 mean the renewals of the recycled nutrient solution at week 4, 8, 12; week 6, 10, 12; and week 8, 10, and 12, respectively.

y Each value represents Mean ± SD (n = 3).

x NS means non-significant by Duncan’s multiple range test at p < 0.05.

of nutrient solution under EC-based nutrient control in closed- loop soilless culture for sweet peppers (Capsicum annum L.

‘Fiesta’). Kor. J. Hort. Sci. Technol. 29:29-35.

Baas, R., H.M.C. Nijssen, T.J.M. Vandenberg, and M.G. Warmenhoven.

1995. Yield and quality of carnation ( Dianthus-Caryophyllus L.) and gerbera ( Gerbera-Jamesonii L.) in a closed nutrient system as affected by sodium-chloride. Sci. Hortic. 61:273-284.

Bratov, A., N. Abramova, and A. Ipatov. 2010. Recent trends in potentiometric sensor arrays-A review. Anal. Chim. Acta 678:

149-159.

Hao, X. and A.P. Papadopoulos. 2002. Growth, photosynthesis and productivity of greenhouse tomato cultivated in open or closed rockwool systems. Can. J. Plant Sci. 82:771-780.

Holmer, R., G. Linwattana, P. Nath, and J.D.H. Keatinge. 2013.

High value vegetables in Southeast Asia: production, supply and demand. Proc. SEAVEG 2012, Chiang Mai, Thailnad, 24-26 Jan. 2012.

Ko, M.T., T.I. Ahn, and J.E. Son. 2013a. Comparisons of ion balance, fruit yield, water, and fertilizer use efficiencies in open and closed soilless culture of paprika ( Capsicum annuum L.).

Kor. J. Hort. Sci. Technol. 31:423-428.

Ko, M.T., T.I. Ahn, Y.Y. Cho, and J.E. Son. 2013b. Uptake of nutrients and water by paprika (Capsicum annuum L.) as affected by renewal period of recycled nutrient solution in closed soilless culture. Hort. Environ. Biotechnol. 54:412-421.

Marcussi, F.F.N., R.L. Villas Bôas, L.J.G. Godoy, and R. Goto.

2004. Macronutrient accumulation and partioning in fertigated sweet pepper plants. Sci. Agric. 61:62-68.

Marti, H.R. and H.A. Mills. 1991. Calcium-uptake and concentration in bell pepper plants as influenced by nitrogen form and stages of development. J. Plant Nutr. 14:1177-1185.

Massa, D., L. Incrocci, R. Maggini, C. Bibbiani, G. Carmassi, F. Malorgio, and A. Pardossi. 2011. Simulation of crop water and mineral relations in greenhouse soilless culture. Environ.

Modell. Softw. 26:711-722.

Nukaya, A., W. Voogt, and C. Sonneveld. 1991. Effects of NO

3-

, SO

42-

, and Cl

-

ratios on tomatoes grown in recirculating system.

Acta Hortic. 294:297-304.

Pardossi, A., F. Falossi, F. Malorgio, L. Incrocci, and G. Bellocchi.

2005. Empirical models of macronutrient uptake in melon plants grown in recirculating nutrient solution culture. J. Plant Nutr.

27:1261-1280.

Rouphael, Y. and G. Colla. 2005. Growth, yield, fruit quality and nutrient uptake of hydroponically cultivated zucchini squash as affected by irrigation systems and growing seasons. Sci.

Hortic. 105:177-195.

Savvas, D. and G. Manos. 1999. Automated composition control of nutrient solution in closed soilless culture systems. J. Agr.

Eng. Res. 73:29-33.

Savvas, D. 2002. Automated replenishment of recycled greenhouse effluents with individual nutrients in hydroponics by means of two alternative models. Biosyst. Eng. 83:225-236.

Savvas, D., E. Chatzieustratiou, G. Peruolaraki, G. Gizas, and N.

Sigrimis. 2008. Modelling Na and Cl concentrations in the recycling nutrient solution of a closed-cycle pepper cultivation.

Biosyst. Eng. 99:282-291.

Silberbush, M., J. Ben-Asher, and J.E. Ephrath. 2005. A model for nutrient and water flow and their uptake by plants grown in a soilless culture. Plant Soil 271:309-319.

Sonneveld, C. 2000. Effects of salinity on substrate grown vegetables and ornamentals in greenhouse horticulture. PhD. Thesis, Wageningen Agricultural University, Wageningen, The Netherlands.

Tai, N.H., T.T. Hung, T.I. Ahn, J.S. Park, and J.E. Son. 2009.

Estimation of leaf area, fresh weight, and dry weight of paprika (Capsicum annuum L.) using leaf length and width in rockwool- based soilless culture. Hort. Environ. Biotechnol. 50:422-426.

Zekki, H., L. Gauthier, and A. Gosselin. 1996. Growth, productivity, and mineral composition of hydroponically cultivated greenhouse tomatoes, with or without nutrient solution recycling. J. Am.

Soc. Hort. Sci. 121:1082-1088.

수치

Fig.  1.  Change  in  individual  ion  concentration  in  the  recycled  nutrient  solution  after  adjusting  EC  and  pH  every  three  days
Fig.  3.  Changes  in  added  water  (A),  accumulation  of  added  water  (B),  added  fresh  nutrient  solution  (C),  accumulation  of  added  fresh  nutrient  solution  (D),  water  uptake  (E)  and  accumulation  of  water  uptake  (F)  during  the  e
Fig.  4.  Change  in  individual  ion  uptake  concentration  at  different  renewal  times
Fig.  5.  Changes  in  individual  ion  ratio  to  total  cations  (left)  and  cumulative  standard  deviations  of  the  ion  ratios  (right)
+4

참조

관련 문서

Changes in the composition and structure of Mediterranean rokey-shore communities following a gradient of nutrient enrichment: Descriptive study and test

Inhibition effects of flavonoids on hOAT1 and hOAT3: The inhibitory effects of five flavonoids such as morin, naringin, naringenin, silybin and quercetin on the uptake of [

The main effects of rooting medium composition, growth regulators and node parts of shoot on rooting and growth of plug plantlets using stem cuttings of

In this study, two experiments were conducted to understand the effects of additional charge on the detailed growth mechanism of Alq 3 and to determine the effect of

It considers the energy use of the different components that are involved in the distribution and viewing of video content: data centres and content delivery networks

Basic aspects of AUTOSAR architecture and methodology Safety mechanisms supported by AUTOSAR.. Technical safety concepts supported by AUTOSAR Relationship to ISO

After first field tests, we expect electric passenger drones or eVTOL aircraft (short for electric vertical take-off and landing) to start providing commercial mobility

1 John Owen, Justification by Faith Alone, in The Works of John Owen, ed. John Bolt, trans. Scott Clark, &#34;Do This and Live: Christ's Active Obedience as the