Korean J Environ Agric (2011) Online ISSN: 2233-4173 Vol. 30, No. 4, pp. 432-439 http://dx.doi.org/10.5338/KJEA.2011.30.4.432 Print ISSN: 1225-3537
Liquid Chromatographic Determination of Etofenprox Residues in Foods with Mass-Spectrometric Confirmation
Young Deuk Lee,1* Chan Hyeok Kwon2 and Kisung Kwon3
1Division of Life and Environmental Science, Daegu University, Gyeongbuk 712-714, Korea
2Food Standardization Division, Korea Food and Drug Administration, Chungbuk 363-951, Korea
3Food Chemical Residues Division, National Institute of Food and Drug Safety Evaluation, Chungbuk 363-951, Korea
Received: 2 November 2011 / Accepted: 26 December 2011
ⓒ 2011 The Korean Society of Environmental Agriculture
*교신저자(Corresponding author),
Phone: +82-53-850-6753; Fax: +82-53-850-6759;
E-mail: [email protected]
432
Abstract
BACKGROUND: An official analytical method was developed to determine etofenprox residues in agricultural commodities using high-performance liquid chromatography (HPLC).
METHODS AND RESULTS: The etofenprox residue was extracted with acetone from representative samples of five raw products which comprised rice grain, apple, mandarin, cabbage, and soybean. The extract was then serially purified by liquid-liquid partition and Florisil column chromatography. For rice and soybean samples, acetonitrile/n-hexane partition was additionally coupled to remove nonpolar lipids. Reversed phase HPLC using an octadecylsilyl column was successfully applied to separate etofenprox from co-extractives. Intact etofenprox was sensitively detected by ultraviolet absorption at 225 nm.
Recovery experiment at the quantitation limit validated that the proposed method could apparently determine the etofenprox residue at 0.02 mg/kg. Mean recoveries from five crop samples fortified at three levels in triplicate were in the range of 93.6∼106.4%. Relative standard deviations of the analytical method were all less than 10%, irrespective of crop types. A selected-ion monitoring LC/mass spectrometry with positive atmospheric-pressure chemical ionization was also provided to confirm the suspected residue.
CONCLUSION(s): The proposed method is simple, rapid and sensitive enough to be employed in routine inspection or monitoring of agricultural products for the etofenprox residue.
Key Words: Analysis, Etofenprox, Food, Residue
Introduction
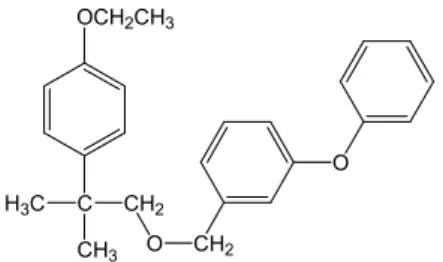
Etofenprox [2-(4-ethoxyphenyl)-2-methylpropyl 3-phenoxybenzyl ether] is a synthetic pyrethroid insecticide disturbing the neural function of insect by interaction with sodium channel (Tomlin, 2009). Unlikely to other synthetic pyrethroids, its low toxicity to fish and aquatic organism enables to use on paddy rice. As a contact and stomach poison to control various insects, several single or combined formulations containing etofenprox are currently available for dilute spray on rice, fruits and vegetables (KCPA, 2011). Etofenprox is known to be highly nonpolar compound which is not translocated in the plant and also to be immobile in soil. Hence, the potential hazard resulted from its residue could be entirely evaluated by the degree of in situ persistence rather than its physical movement to the nearby environment. Taken in conjunction with its considerable persistence in crops, use of etofenprox would inevitably result in occurrence of its terminal residue in the harvest.
As diverse types of crops for etofenprox application are consumed in large quantity, particularly in raw state for fruits and vegetables, evaluation of the etofenprox residue is quite important to ensure safety of the harvest.
Open Access Research Article
Consequently, development of a reliable analytical method is prerequisite for estimation of the residue in crops.
As maximum residue limits (MRLs) of etofenprox in major crops range 0.05∼10.0 mg/kg (KFDA, 2011), highly sensitive method is required to meet 0.02 mg/kg of limit of quantitation (LOQ) or less to fulfill guidelines on analytical method for pesticide residues (CAC, 2003; RDA, 2004). Owing to the strict regulation of MRLs, certainty of analytical methodology should be also laid on providing unambiguous evidence to confirm both the identity and the quantity of any detected residue for the official decision on MRL violation.
OCH2CH3
C CH2 H3C
CH3 O CH2
O
Fig. 1. Molecular structure of etofenprox.
Even though relatively large molecule they might be, most of synthetic pyrethroids are nonpolar compounds with thermal stability and volatility enough to be analyzed by gas-liquid chromatography (GLC). Taking advantage of halogens or nitrile group present in the molecule, synthetic pyrethroid residues have been usually determined by electron-capture detection (ECD) at high sensitivity. However, etofenprox is unfortunately a simple hydrocarbon molecule with no atom or moiety sensitive to any specific detectors commonly used in GLC.
Therefore, etofenprox is not yet included as an analyte in KFDA and US FDA official multi-residue analytical method in foods (KFDA, 2009; US FDA, 1999) in which conventional GLC and HPLC instruments coupled with specific detectors are employed. Recently, several multi-residue methods for the purpose of screening of diverse pesticide residues including etofenprox had been reported using GLC/mass spectrometry (MS) (Paya et al., 2007; Cervera et al., 2010) or liquid chromatography (LC)/MS (Sannino et al., 2004; Paya et al., 2007; Lacina et al., 2010; Wang et al., 2010).
However, non-specific sample preparation which ought to cover wide range of analytes and sample types had necessarily resulted in severe matrix effects such as ion suppression and enhancement in the mass spectrometry. Matrix-matched calibration and/or internal
standardization could partially correct the matrix effect, nevertheless, large fluctuation (5∼56% of analytical error) in the quantitation, particularly depending upon sample types, should be still observed. Those multi-residue methods, therefore, could not be adopted as official tools to clearly discriminate the violation of MRL. As an individual method for precise quantitation, a KFDA method comprising cleavage of 3-phenoxybenzyl moiety followed by iodination to form the electron-capturing derivative is available (KFDA, 2009). However, the method is less sensitive (LOQ of 0.05 mg/kg) to meet the lowest MRL and has no confirmatory tool. Moreover, the derivatization/purification procedure is so complicated to produce poor repeatability that the method seems to be inadequate for the routine inspection.
The present paper describes a new individual method to analyze intact etofenprox residues in crop samples using high-performance liquid chromatography, preferably for the official analysis. The method was developed not only to provide reliability and sensitivity higher than current methods but to achieve readiness for routine operation.
Materials and Methods
Chemicals
Analytical standard of etofenprox (99.9% pure) was kindly supplied by on Dongbang Agro Co., Korea.
Stock standard solution of 500 mg/L was prepared in acetonitrile. The stock solution was stable at 4℃ for at least 6 months. Working solutions for fortification and HPLC calibration were freshly diluted in acetonitrile from the stock solution whenever necessary. Florisil (60∼100 mesh, pesticide residue grade) was purchased from Aldrich Chemical (USA) and activated at 130℃
for more than 5 h prior to use. Acetonitrile and deionized water were HPLC grade. All other solvents were pesticide residue grade or reagent grade freshly redistilled in glass. All other reagents were reagent grade unless specified.
Crop samples
Hulled rice, mandarin, Chinese cabbage and soybean of Chuchung, Goongchun, Garak and Eunha varieties, respectively, from organically-grown fields where no pesticides had been applied were purchased in the commercial market. At maturity control apple sample (Fuji variety) was collected in bulk from an orchard field in Chilgok area, Gyeongbuk Province, Korea, where
no etofenprox had been applied. Composite samples were prepared in compliance with the instructions in Korean Test Guidelines for Pesticide Persistence (RDA, 2004). Rice and soybean grains were finely pulverized to pass 40-mesh sieve using a Wiley-type mill. Apple was minced after removing the hilum and ovary portions. Whole mandarin along with the peel part was cut into large pieces and blended. Chinese cabbage was evenly chopped after discarding the head part. Each analytical sample was stored frozen at-20℃ until analysis.
Extraction and partition
To a 25 g of rice or soybean sample in a 500-mL homogenizer cup was added 20 mL of distilled water to moisten the sample. After brief shaking and standing for 30 min, 100 mL of acetone was added. A 25-g portion of fruit or vegetable sample was weighed in the homogenizer cup, and 100 mL of acetone was added. The mixture was then macerated at 10,000 rpm for 2 min in a high-speed homogenizer (Nihonseiki Kaisha AM-8, Japan). The homogenate was suction-filtered through the filter paper (Toyo No. 6, Japan) on porcelain Büchner funnel. The cup and filter cake were washed with fresh 50 mL of acetone, and the rinsate was combined with the previous filtrate. The filtrate was quantitatively transferred to a 1-L separatory funnel, and sequential addition of 100 mL of n-hexane, 50 mL of saturated sodium chloride solution, and 450 mL of distilled water was followed. After vigorous shaking for 2 min and standing until two layers clearly separated, the lower aqueous phase was discarded. The hexane phase was dried over 20 g of anhydrous sodium sulfate layer, collected in a 250-mL distilling flask, and evaporated just to dryness in vacuo at 40℃. The residue was dissolved in 10 mL of n-hexane and subjected to Florisil column chromatography.
For rice and soybean samples, the residue was dissolved in 40 mL of n-hexane saturated with acetonitrile and transferred to a 250-mL separatory funnel. The hexane phase was then extracted three times with 30 mL portions of acetonitrile saturated with n-hexane.
The acetonitrile extract was combined in a 125-mL distilling flask, and evaporated just to dryness in vacuo at 40℃. The residue was dissolved in 10 mL of n-hexane and subjected to Florisil column chromatography.
Florisil column chromatography
A chromatographic column (11 mm i.d. × 40 cm)
was plugged with glass wool, dry packed with 5 g of activated Florisil, and topped with ca. 2 cm layer of anhydrous sodium sulfate. The column was pre-washed by passing 25 mL of n-hexane until the solvent level reached the top of sodium sulfate layer. The hexane extract (10 mL) from the partition step was poured into the column and the column wall was rinsed twice with 2 mL portions of n-hexane. When the liquid drained to the sodium sulfate layer, the column was eluted with 50 mL of dichloromethane/n-hexane mixture (70/30, v/v), and the fraction was discarded.
The column was then eluted with 60 mL of dichloromethane.
The eluate was collected, rotary-evaporated just to dryness at 40℃, and the residue was reconstituted with 10 mL of acetonitrile for HPLC determination.
High-performance liquid chromatography
High-performance liquid chromatography (HPLC) was performed using a HPLC system consisted of Jasco (Japan) 2080Plus pumps with built-in gradient former, 1575 UV/VIS absorbance detector, 2055S autosampler, and Younglin (Korea) CTS30 column oven and Autochro 2000® data module/processing software. Purospher STAR® RP18e (4.0 mm i. d. × 250 mm, 5 μm spherical, Merck, Germany) was used as the analytical column. Operating parameters used for the determination of etofenprox residues were as follows; column temperature 40℃; mobile phase, acetonitrile/water (85/15, v/v), isocratic; flow rate, 0.8 mL/min; detection, UV absorption at 225 nm, 0.008 AUFS; sample size, 20 μL. Under these conditions, retention time of etofenprox was 13.0 min.
Validation of the analytical method
Recovery experiments were run on control samples to validate the analytical method proposed for etofenprox residues. Prior to extraction, series of control samples were fortified with etofenprox standard solution in acetonitrile at specified concentrations. After standing for 2 h, analytical procedures mentioned above were carried out to produce quality assurance data.
Confirmation of the residue
LC/MS was employed to confirm the etofenprox residue in crop extracts. Using Thermo (USA) TSQ Quantum Ultra LC/MS/MS operated in single quadrupole mode, etofenprox was also separated from sample co-extractives on a Hypersil Gold® C18 column (4.0 mm i. d. × 250 mm, 5 μm spherical, Thermo, USA)
containing the packing material basically identical to HPLC determination. Operating parameters were carefully optimized for maximum ionization of etofenprox as indicated below; ionization, atmospheric- pressure chemical ionization (APCI), positive-ion mode;
column temperature, 40℃; mobile phase, acetonitrile/
water (75/25, v/v), isocratic; flow rate, 1.0 mL/min;
tube lens offset, 87 V, discharge current, 4 μA, capillary temperature, 275℃, vaporizer temperature, 500 ℃; sheath gas pressure, 50 psi; auxiliary gas pressure, 10 psi; mass range (m/z), 100∼500; selected-ion monitoring (SIM) at m/z = 359; SIM span (m/z), 0.5.
Under these conditions, retention time of etofenprox was 13.4 min.
Results and Discussion
According to the residue definition of etofenprox, target analyte of the method is confined to the parent compound because there is no metabolite or degradation products of toxicological significance (CCPR, 2007).
Glancing at physicochemical properties of etofenprox, which show high lipophilicity of log Pow (n-octanol- water partition coefficient) 6.9 and vapor pressure of 8.1 × 10⁻⁴ mPa (25℃) (Tomlin, 2009), GLC seems to be preferable to analyze the residues. However, there is no sensitive detector available in GLC except MS because etofenprox is a simple hydrocarbon molecule with no atom or moiety specific to any detectors commonly used in residue analysis. GC/MS may be also difficult to employ for the purpose of keen decision making or routine analysis due to large fluctuation in quantitation as well as the complicated instrumentation and troublesome calibration. Hence the study was tried to develop an alternative method using HPLC to ensure high reproducibility along with enhanced sensitivity.
When reversed phase HPLC on an octadecylsilyl column was applied, etofenprox showed a sharp symmetrical peak under the mobile phase of acetonitrile/
water mixture, reflecting its nonpolar nature. In the range of 75% to 90% of acetonitrile contents in water, its capacity factor increased almost double as acetonitrile contents decreased by 10%, while the peak shape was kept totally symmetrical. This indicated that etofenprox exists as neutral form in the mobile phase of acetonitrile/
water mixture and thus there was no need for ion-suppression (Snyder et al., 1997).
As etofenprox was not readily oxidized nor reduced and had no fluorophore, ultraviolet absorption
detector was the only choice among common HPLC detectors. Etofenprox standard solution (10 mg/L) in acetonitrile or 50% aqueous acetonitrile was scanned using Hewlett Packard (USA) Model 8452A photodiode- array UV/VIS spectrophotometer. As shown in Fig. 2, no definite λmax of etofenprox was found in the range of 210∼400 nm. To enhance specificity, wavelength of determination was setup to be as long as possible with minimal loss of sensitivity. Absorptivity at determination wavelength of 225 nm was 2.26×104 cm-1M-1, and seemed to be sufficiently high for residue analysis (Lee and Kwon, 1999). No spectral change between two solvents was observed and this also confirmed no dissociation of etofenprox in the HPLC mobile phase of acetonitrile/water mixture.
Wavelength (nm)
220 240 260 280 300 320
Absorbance
0.0 0.2 0.4 0.6 0.8 1.0
CH3CN
CH3CN/H2O (50/50)
λdet.
(225 nm)
Fig. 2. UV absorption spectra of etofenprox.
Under optimized HPLC parameters, LOQ of etofenprox was 1.0 ng at signal to noise ratio (S/N)≥10. As determination was performed at rather short wavelength, there might be much possibility of interference caused by sample co-extractives, particularly in applying one method to diverse type of samples. The study was, therefore, mainly focused on the development of efficient but simple cleanup methods.
Based on the nonpolar and undissociated nature of etofenprox, acetone was used to extract the residue from food samples, considering that its extraction efficiency for nonpolar neutral compounds had been clearly validated in many official methods (US FDA, 1999; Zweig and Sherma, 1986). The acetone extract was then diluted with large amount of saline and directly partitioned with n-hexane to recover the analyte. This partition procedure is quite simple to operate with advantage of omitting tedious concentration step of the extract. Single hexane partition was sufficient to recover more than 95% of etofenprox as
confirmed by no residue found in the repeated partition with n-hexane.
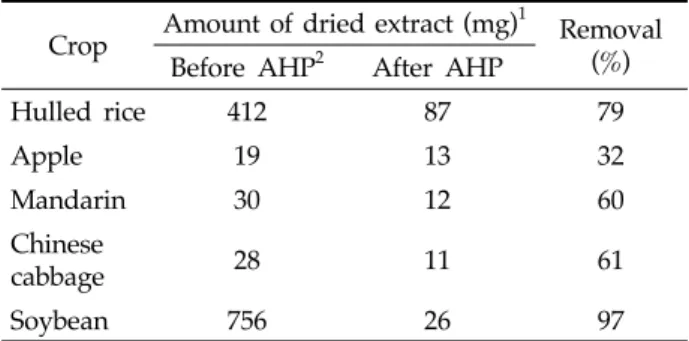
For rice and soybean samples, an attempt was conducted at partition step to remove nonpolar co-extractives, mainly lipids, by employing modified method of acetonitrile/n-hexane partition (US FDA, 1999; Zweig and Sherma, 1986). During the hexane partition of the acetone extract, dried amount of the rice and soybean extracts partitioned to the hexane phase was more than 400 mg/25 g sample, while that of fruit and vegetable samples was all less than 50 mg as indicated in Table 1. It was expected that excess co-extractives from the rice and soybean samples would evidently cause overloading of Florisil column chromatography as well as severe interference in instrumental determination (Lee and Lee, 1998; Lee and Kwon, 2004). When acetonitrile/n-hexane partition was tried, 89 and 96% of etofenprox were recovered by double and triple partitions with acetonitrile saturated with n-hexane, respectively. Triple partition was required to maintain the acceptable loss of etofenprox (less than 10%), while 79 and 97% of co-extractives from rice and soybean samples were each removed.
Crop Amount of dried extract (mg)1 Removal Before AHP2 After AHP (%)
Hulled rice 412 87 79
Apple 19 13 32
Mandarin 30 12 60
Chinese
cabbage 28 11 61
Soybean 756 26 97
1Mean of duplicates.
2After n-hexane partition of acetone extract diluted with saline.
Table 1. Effect of acetonitrile/n-hexane partition (AHP) on the removal of nonpolar co-extractives
Adsorption chromatography was applied to further purify the extracts. As etofenprox is a nonpolar neutral compound, Florisil and dichloromethane/n-hexane mixtures were used as adsorbent and elution solvents, respectively (US FDA, 1999). As shown in Table 2, elution pattern of etofenprox on Florisil column was investigated at different solvent strength. While minimal loss of analyte was ensured, a gradient elution scheme consisted of serial washing and collecting fractions was optimized to sharply separate etofenprox from sample co-extractives.
Elution solvent2
Etofenprox recovery (%)
0∼25 mL 25∼50 mL 50∼75 mL Total
60/40 NE4 NE NE NE
70/30 NE NE 11 11
100/0 0 52 41 93
100/03 50 47 2 99
1Activated Florisil, 5 g was pre-washed with 25 mL of n-hexane.
2Dichloromethane/n-hexane mixture (v/v/).
3Pre-eluted with 50 mL of dichloromethane/n-hexane (70/30), discarded and then eluted with 75 mL of n-hexane.
4Not eluted.
Table 2. Elution profile of etofenprox on Florisil column1
Coupling with the proposed partition and adsorption chromatography, all the extracts appeared so well purified that colorless solutions were obtained for final HPLC determination. Typical HPLC chromatograms of representative crop extracts are shown in Fig. 3.
Fig. 3. HPLC chromatograms of crop extracts for the analysis of etofenprox residues.
A, control; B, fortified at 0.02 mg/kg (LOQ); C, fortified at 0.2 mg/kg.
All the HPLC chromatograms of extracts from control samples showed free of interference near etofenprox retention. Co-extractive peaks eluted later than etofenprox were negligible to enable consecutive HPLC determination at 20 min interval. As confirmed by recovery experiment, LOQ of the proposed method was apparently verified to be 0.02 mg/kg for all the crop samples based on 3% full scale deflection (S/N
≥10). These sensitivities were high enough to quantitate up to 1/2∼1/50 of MRLs (0.05∼10 mg/kg) established for etofenprox in crops (KFDA, 2011).
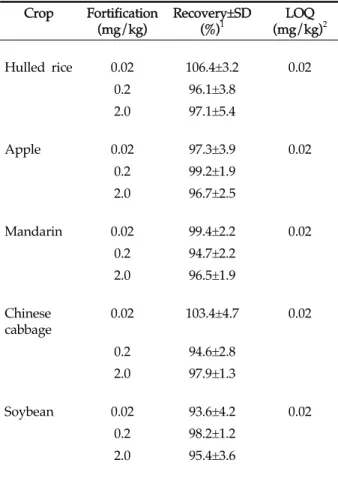
Crop Fortification (mg/kg)
Recovery±SD (%)1
LOQ (mg/kg)2
Hulled rice 0.02 106.4±3.2 0.02
0.2 96.1±3.8
2.0 97.1±5.4
Apple 0.02 97.3±3.9 0.02
0.2 99.2±1.9
2.0 96.7±2.5
Mandarin 0.02 99.4±2.2 0.02
0.2 94.7±2.2
2.0 96.5±1.9
Chinese cabbage
0.02 103.4±4.7 0.02
0.2 94.6±2.8
2.0 97.9±1.3
Soybean 0.02 93.6±4.2 0.02
0.2 98.2±1.2
2.0 95.4±3.6
1Mean values of triplicate samples with standard deviations.
2LOQ at 3% FSD (S/N ≥ 10).
Table 3. Recoveries and LOQs of the analytical method
Percent recoveries of etofenprox generated during the validation of analytical methods are presented in Table 3. Overall recoveries performed at three fortification levels in triplicate each averaged 100.1±6.2% (n=9), 97.8±2.7% (n=9), 96.9±2.8% (n=9), 98.6±4.7% (n=9) and 95.5±3.6% (n=9) for hulled rice, apple, mandarin, Chinese cabbage and soybean samples, respectively.
No lower recoveries were observed in rice and soybean samples in spite of additional acetonitrile/n-hexane partition. Relative standard deviations (RSD) of recoveries
were all less than 10%, irrespective of sample types and spiking levels, indicating that the method could be reproducibly applied to analyze etofenprox residues in various crop samples.
Confirmatory tests play an essential part in the pesticide residue analysis. Even now, there are few analytical techniques available that alone can unequivocally identify pesticide residues in trace quantities. Even if the proposed method was carefully designed to remove and separate the interference as much as possible, there is still probability of the occurrence of other pesticides with very similar retention times in the extract. Unexpected interference could be also encountered with co-extractives of different sample origin and artifacts from laboratory contamination. The purpose of a confirmatory test is to verify the result of an initial analysis and is usually carried out under different experimental conditions, mainly in the different form of measuring devices (Das, 1981; UD FDA 1999). Hence, in the present study, the confirmatory test using LC/MS was additionally developed to validate the identity of the detected etofenprox. As the final extract was dissolved in acetonitrile, GC/MS was not tried to avoid changing the solvent.
Total-ion chromatogram was obtained using a C18 column of packing material practically identical to HPLC determination (Fig. 4). Etofenprox was ionized only under positive-ion mode of atmospheric-pressure chemical ionization (APCI) with the mobile phase of acetonitrile/water mixture. Negative-ion mode of APCI and electrospray ionization (ESI) failed to detect etofenprox, even if a few cases of ionization had been reported when used with protonation additives in the mobile phase (Sannino et al., 2004; Lacina et al., 2010).
Fig. 4. LC/MS total-ion chromatogram of etofenprox.
In APCI(+) mass spectrum of etofenprox (Fig. 5), base peak was not found at molecular ion, (M+H)+ but at a fragment (m/z=359), presumably one-carbon unit cleaved off the molecule (Sannino et al., 2004).
Relative isotope abundance between m/z=359 and m/z=360 as A+1, 100:27, was coincident to the expected value from chemical formula of the fragment (McLafferty and Turecek, 1993).
Fig. 5. Mass spectrum of etofenprox.
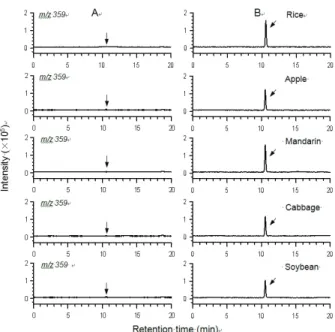
When selected-ion monitoring (SIM) was conducted at m/z=359, identity of etofenprox at LOQ level was evidently confirmed with no interference as shown in Fig. 6. LC/MS is 2 to 5-fold more sensitive than HPLC/UVD and could also be used an alternative instrument for detection of etofenprox residues.
However, matrix-matched calibration should be followed whenever quantitation was performed, because some ion-suppression by the co-extractives was observed.
Fig. 6. LC/MS APCI(+) SIM chromatograms of sample extracts for confirmation of etofenprox residues.
A, control; B, fortified with etofenprox at LOQ of 0.02 mg/kg.
The proposed method satisfies criteria of the analytical method for pesticide residues, which are 70∼120% of recovery range, less than 10% of RSD, and LOQs
more sensitive than 0.05 mg/kg along with half of lowest MRLs, on Guidelines on Good Laboratory Practice in Residue Analysis (CAC, 2003). Analytical procedures do not require any special apparatus or instruments but consist of currently available techniques familiar to the residue analyst as well. The method is so rapid to operate that one experienced person can analyze 12 samples per day. Therefore, authors suggest that the proposed method could be routinely applied to the official analysis of etofenprox residues in various crop samples.
Acknowledgements
This research was supported by Grant 08082KFDA022 from the Korea Food and Drug Administration and Grant 09072NIFDS997 from the National Institute of Food and Drug Safety Evaluation, Korea.
References
Cervera, M.I., Medina, C., Portoles, T., Pitarch, E., Beltran, J., Serrahima, E., Pineda, L., Munoz, G., Centrich, F., Hernandez, F., 2010. Multi-residue determination of 130 multiclass pesticides in fruits and vegetables by gas chromatography coupled to triple quadrupole tandem mass spectrometry, Anal. Bioanal. Chem. 397, 2873-2891.
Codex Alimentarius Commission (CAC), 2003. Guidelines on Good Laboratory Practice in Residue Analysis, CAC/GL 40-1993, Rev.1-2003, Rome, Italy.
Codex Committee on Pesticide Residues (CCPR), 2007.
Draft and Proposed Draft Maximum Residue Limits in Foods and Feeds, CX/PR 07, CAC, Rome, Italy.
Das, K.A., 1981. Pesticide Analysis, pp. 425-453, Marcel Dekker, New York, USA.
Korea Crop Protection Association (KCPA), 2011.
Agrochemicals Use Guide Book, pp. 593-604.
Korea Food and Drug Administration (KFDA), 2011.
MRLs for Pesticides in Foods, p. 62.
Korea Food and Drug Administration (KFDA), 2009.
Analytical methods of pesticide residues in foods-In Korean code of food, pp. 10-4-10∼10-4-18 and pp.
10-4-186∼10-4-188.
Lacina, O., Urbanova, J., Poustka, J., Hajaslova, J., 2010. Identification/quantification of multiple pesticide residues in food plants by ultra-high-performance liquid chromatography-time-of-flight mass spectrometry, J. Chromatogr. A. 1217, 648-659.
Lee, Y.D., Lee, J.H., 1998. High-performance liquid chromatographic determination of tricyclazole residues in rice grain, rice straw, and soil, Agric.
Chem. Biotechnol. 41, 595-599.
Lee, Y.D., Kwon, C.H., 2004. Determination of monocrotophos residues in fruits and soils using high-performance liquid chromatography, Korean J. Environ. Agric. 23, 245-250.
McLafferty, F.W., Turecek, F., 1993 Interpretation of Mass Spectra, pp. 19-34, 4th ed., University Science Books, Sausalito, USA.
Paya, P., Anastassiades, M., Mack, D., Sigalova, I., Tasdelen, B., Oliva, J., Barba, A., 2007. Analysis of pesticide residues using the quick easy cheap effective rugged and safe (QuEChERS) pesticide multiresidue method in combination with gas and liquid chromatography and tandem mass spectrometric detection, Anal. Bioanal. Chem. 389, 1697-1714.
Rural Development Administration (RDA), 2004. Test guidelines for pesticide persistence. In Criteria and Guidelines for Pesticide Registration, RDA Notification No. 2004-4 Annex 8, Korea.
Sannino, A., Bolzoni, L., Bandini, M., 2001. Application of liquid chromatography with electrospray tandem mass spectrometry to the determination of a new generation of pesticides in processed fruits and vegetables, J. Chromatogr. A. 1036, 161-169.
Snyder, L.R., Kirkland, J.J., Glajch, J.L., 1997. Practical HPLC Method Development, pp. 233-266 and 292-317, 2nd ed., Wiley, New York, USA.
Tomlin, C.D.S., 2009. The Pesticide Manual, pp. 454∼
455, 15th ed., British Crop protection Council, Hampshire, UK.
US FDA, 1999. Pesticide Analytical Manual, Vol 1:
Multi-Residue Methods, 3rd ed., US Food and Drug Administration, USA.
Wang, J., Chow, W., Leung, D., 2010. Application of LC/ESI-MS/MS and UHPLC QqTOF MS for the determination of 148 pesticides in fruits and vegetables, Anal. Bioanal. Chem. 396, 1513-1538.
Zweig, G., Sherma, J., 1986. Analytical Methods for Pesticides and Plant Growth Regulators Vol. XV, Principles, Statistics, and Applications, pp. 67-87, Academic Press, Orlando, USA.