Print ISSN: 2288-4637 / Online ISSN 2288-4645 doi:10.13106/jafeb.2020.vol7.no12.115
The Effects of Restrictions in Economic Activity on the Spread of COVID-19 in the Philippines: Insights from Apple
and Google Mobility Indicators
Abraham C. CAMBA, Jr.
1, Aileen L. CAMBA
2Received: August 01, 2020 Revised: October 26, 2020 Accepted: November 05, 2020
Abstract
This study aims to investigate the effects of restrictions in economic activity on the spread of COVID-19 in the Philippines. This research employs daily time-series data of confirmed new COVID-19 cases, Apple mobility trends (i.e., use of public transport to destinations, volume of people driving, and amount of walking to destinations) and Google community mobility (i.e., visits to transit stations, visits to workplaces, and staying-at-home) indicators covering the period February 17 to September 11, 2020. The analysis starts by establishing the correlation pattern of new confirmed COVID-19 daily infections to each independent variable. The results show negative linear correlation of the number of new COVID-19 daily infections with less visit to transit station, increase stay-at-home, less use of public transport, and less amount of walking to destinations. Interestingly, the number of new COVID-19 daily infections indicates some form of positive linear correlation with visits to workplaces and volume of people driving. Moreover, employing robust least square regression via the method of MM-estimation, major findings reveal that across mobility measures, staying-at-home has the highest impact on reducing the spread of COVID-19, followed by visiting transit stations less, less use of public transport, less amount of walking, and less workplace visits.
Keywords: Apple, Coronavirus, COVID-19, Google, Lockdown, Mobility JEL Classification Code: G11, G40, G41, I15, I18
since spread rapidly around the world, nearing 30 million confirmed cases as of September 11, 2020. In the Philippines, after recording the first case of COVID-19 on January 31, 2020, the government has implemented unprecedented measures to restrict economic activity, and to promote social distancing, with the aim of stopping transmission of the SARS-CoV-2 virus.
Understanding the effectiveness of intervention measures such as restrictions in economic activity (i.e., driving, visits to workplaces, staying-at-home, etc.) is critical for mitigating the spread of COVID-19. The nature of economic activity exacerbates the problem of controlling transmission of COVID-19. For instance, the tremendous increase in mobility of humans in all geographical dimensions has facilitated the outbreak of COVID-19 (Tisdell, 2020). Utilization of the population mobility data collected by private companies, can help refine interventions by providing near real-time information about changes in patterns of human movement (Buckee et al., 2020). The estimates of aggregate flows of people are incredibly valuable. Mobility patterns, for example, are helpful to understand what kind of policies are
1. Introduction
A cluster of cases of pneumonia of unknown cause in Wuhan, China, was first reported on December 31, 2019, and a week later identified as COVID-19 (Chen et al., 2020). On March 11, the World Health Organization (WHO) declared COVID-19 a pandemic (Alam et al., 2020; Khan et al., 2020; Khanthavit, 2020). What started as an outbreak in China has now developed internationally. COVID-19 has
1
First Author and Corresponding Author. Assistant Professor II, Department of Economics, College of Social Sciences and Development, Polytechnic University of the Philippines, Sta. Mesa, Manila, Philippines [Postal Address: P. Tuazon Ave., Bgry. Kaunlaran, Quezon City, Metro Manila, 1111, Philippines] Email: [email protected]
2
Associate Professor IV, Department of Economics, College of Social Sciences and Development, Polytechnic University of the Philippines, Sta. Mesa, Manila, Philippines. Email: [email protected].
© Copyright: The Author(s)
This is an Open Access article distributed under the terms of the Creative Commons Attribution
Non-Commercial License (https://creativecommons.org/licenses/by-nc/4.0/) which permits
unrestricted non-commercial use, distribution, and reproduction in any medium, provided the
original work is properly cited.
most effective (Bonaccorsi et al., 2020). In this paper, we add to the literature of understanding the effects of restrictions in economic activity using daily Apple and Google mobility data from February 17 to September 11, 2020, on the spread of COVID-19 in the Philippines.
2. Literature Review
2.1. China and USA Mobility Restrictions
Fang et al. (2020) found that the lockdown of the city of Wuhan on January 23, 2020, contributed significantly to reducing the total infection cases outside of Wuhan. Results also show evidence that imposing enhanced social distancing policies in the 63 Chinese cities outside Hubei province is effective in reducing the impact of population inflows from the epicenter cities in Hubei province on the spread of 2019-nCoV virus in the destination cities elsewhere. Also, Kraemer et al. (2020) used real-time mobility data from Wuhan and detailed case data including travel history to elucidate the role of case importation in transmission in cities across China and to ascertain the impact of control measures.
Early on, the spatial distribution of COVID-19 cases in China was explained well by human mobility data. After the implementation of control measures, this correlation dropped and growth rates became negative in most locations, although shifts in the demographics of reported cases were still indicative of local chains of transmission outside of Wuhan. This study shows that the drastic control measures implemented in China substantially mitigated the spread of COVID-19.
Studies on mobility restrictions were also conducted in the United States. Sen et al. (2020) concludes that stay- at-home potentially decreased the rate of virus spread in Colorado, Minnesota, Ohio, and Virginia. Badr et al.
(2020) used daily mobility data derived from aggregated and anonymized cell (mobile) phone data from January 1 to April 20, 2020, to capture real-time trends in movement patterns for each US county. Findings reveal that mobility patterns are strongly correlated with decreased COVID-19 case growth rates for the most affected counties in the USA, with Pearson correlation coefficients above 0.70 for 20 of the 25 counties evaluated. County-level observations of reported infections and deaths in conjunction with human mobility data and a metapopulation transmission model to quantify changes of disease transmission rates in US counties from March 15 to May 3, 2020, by Pei et al. (2020). Their findings reveal that significant reductions of the basic reproductive numbers in major metropolitan areas in association with social distancing and other control measures. Counterfactual simulations indicate that, had these same control measures been implemented just 1-2 weeks earlier, a substantial number of cases and deaths could have been averted.
Specifically, nationwide, 61.6 percent of reported infections and 55 percent of reported deaths as of May 3, 2020, could have been avoided if the same control measures had been implemented just one week earlier.
2.2. World and EU Mobility Restrictions
A more specific study by Yilmazkuday (2020) using daily Google mobility data covering 127 countries over the period between February 16 and March 29, 2020, suggest that less mobility is associated with lower COVID-19 cases and deaths. That is, a 1-percent increase in being at residential places leads to about 50 fewer COVID-19 cases and about four fewer COVID-19 deaths, whereas 1-percent decrease in visits to transit stations leads to about 22 fewer COVID-19 cases and about two fewer COVID-19 deaths. Similarly, a 1-percent reduction in visits to retail & recreation areas results in about 15 fewer COVID-19 cases and about two fewer COVID-19 deaths, or a 1-percent reduction in visits to workplaces results in about 10 fewer COVID-19 cases and about one fewer COVID-19 death.
Using the latest mobility data, Carella (2020) shown how human mobility in the provinces of Italy might affect the spread of SARS-CoV-2. The analysis shows that human mobility is linked to the spread of the disease and that recent mobility patterns should be included in any epidemiological model used for predicting the evolution of the epidemic.
Kahanec et al. (2020) selected Austria, Belgium, Czechia, France, Germany, Hungary, Italy, Poland, Portugal, Slovakia, Spain and the United Kingdom. Focusing on four restrictions: the prohibition of public events (with more than a specified number of attendees), the closing of schools, the closing of non-essential shops, and the prohibition of non- essential movement from the residence. Results indicate that a prohibition on public events is associated with fewer visits and shorter stays in shops, recreation areas, transit stations and, to a lesser extent, visits to parks and places of work.
Trips to groceries and pharmacies increase slightly (possibly due to the substitution effect), as does time spent at home.
Closing of schools correlates with a decrease of frequenting
of transit stations, parks and workplaces (likely because
some parents must stay home to care for their children), and
to a lesser extent of shops, recreation areas, groceries and
pharmacies. On the other hand, people spend more time in
places of residence. Shop closures have a strong negative
association with all mobility except for increased time spent
at home and in parks. This may indicate that shop closures
divert people into parks. Restrictions on non-essential
movement from the residence appear to have reduced
all forms of mobility, especially in parks, groceries and
pharmacies, retail and recreation, and resulted in an increase
of time spent at home.
2.3. Economic Development and Mobility Restrictions
Sirkeci and Yüceşahin (2020) discovered that countries marked by high human development index (HDI) scores, relatively large populations, high income and sizeable Chinese diasporas have seen the largest volumes of infected populations. There are also evidence confirming an expansion to neighboring countries, as expected, towards Japan and South Korea and other South-East Asian neighbors where initially a significant number of cases were reported.
Results from the study also emphasized that by monitoring immigrant stock data and/or travel volume data based on human mobility corridors (i.e., origins and destinations), countries could have been better prepared to tackle the spread of COVID-19. Another important note is that the spread of the virus does not have an ethnic origin.
Tisdell (2020) argue that the costs to individuals of restrictions appear to vary with the social structure, nature of economies and the stages of their economic development.
Higher income countries are in a better position to provide social safety nets to their citizens to support them if they are restricted in their ability to work as a result of COVID-19. In low-income countries, stringent social measures to control COVID-19 impose a heavy burden on the poor who need to work to earn enough income for their survival. Lockdowns of social groups as proposed by Acemoglu et al. (2020) are likely to create serious economic problems. In the absence of government financial support, most of the poor have little option, but to work (if they can) even if they have COVID-19 or while awaiting the results of testing. Locking down everyone in particular social groups seems to be a very blunt way of reducing COVID-19 deaths and the incidence of the disease.
3. Research Methodology
3.1. Robust Least Squares Regression
The dramatic and unprecedented intensity of the shock due to the COVID-19 pandemic has highlighted the importance of measuring the effects of restrictions in economic activity to stop its spread. Formally, the regression model of interest for Apple mobility trends and Google community mobility indicators is:
COVID
t= β
0+ β
1TRANSIT
t+ β
2WORK
t+ β
3HOME
t+ β
4PUBTRA
t+ β
5DRIVE
t+ β
6WALK
t+ e
t(1) where:
COVID – number of new COVID-19 daily infections TRANSIT – visits to transit stations
WORK – visits to workplaces HOME –staying-at-home
PUBTRA – use of public transport to destinations DRIVE – volume of people driving
WALK – amount of walking to destinations α’s and β’s - are parameter estimates e - the error terms
t - represents time trend
The presence of outliers may represent erroneous data, or may indicate a poorly fitting regression line. Robust regression can be an alternative to least squares regression when data are contaminated with outliers or influential observations. When fitting a least squares regression, we might encounter some outliers or high leverage data points. Robust regression is a good strategy since it weighs the observations differently based on how well behaved these observations are. The method of robust least squares regression is designed to be robust, or less sensitive, to outliers. In this study we applied the method of MM- estimation (Yohai, 1987) to address any outliers in both the dependent (COVID) and independent (TRANSIT, WORK, HOME, PUBTRA, DRIVE, WALK) variables. Prior to estimating the robust least squares regression, it will be useful to check first the presence of outliers (Piepel, 1989;
Sonnberger, 1989; Liu et al., 2004) in the data utilizing influence statistics and leverage plot.
Moreover, coefficient of correlation was utilized to examine the degree of association of the number of new COVID-19 daily infections on the visits to transit stations, visits to workplaces, being at residential places, use of public transport to destinations, volume of driving, and amount of walking to destinations.
Daily time series data from February 17 to September 11, 2020 were sourced online from the websites of World Health Organization (WHO), Apple and Google.
4. Results and Discussion 4.1. Descriptive Analysis
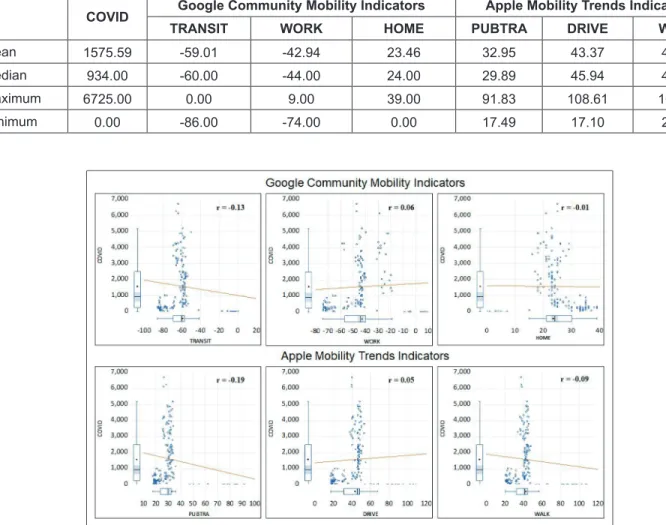
Table 1 describes that for the period covered – from
February 17 to September 11, 2020 – the number of new
COVID-19 daily infections in the Philippines reached its
highest level at 6,725 with mean and median of 1,575.59 and
934, respectively. Visits to transit stations and workplaces
have averaged 59.01 percent and 42.94 less people. Staying
more at home has seen an average 23.46 percent increase. In
terms of Apple mobility trends indicators, the use of public
transport to destinations, volume of people driving, and
amount of walking to destinations averaged 32.95 percent,
43.37 percent, and 42.47 percent, respectively.
4.2. Correlation Diagnostics
The variables are tested whether they exhibit some degree of correlation. Paired correlations (r) were calculated and further supported by the scatter diagrams and box plots shown in Figure 1. The corresponding correlation patterns indicate some form of negative linear correlation of the number of new COVID-19 daily infections (COVID) with TRANSIT, HOME, PUBTRA, and WALK. It is expected that less visit to transit station, increase stay in residential places or staying at home, less use of public transport, and less amount of walking to destinations may reduce the number of new COVID-19 daily infections. In contrast, the number of new COVID-19 daily infections indicate some form of positive linear correlation with WORK and DRIVE.
However, findings reveal that the degree of association
of TRANSIT, WORK, HOME, PUBTRA, DRIVE, and WALK are insignificant to the number of new COVID-19 daily infections with correlation coefficients of -0.13, 0.06, -0.01, -0.19, 0.05 and -0.09, respectively.
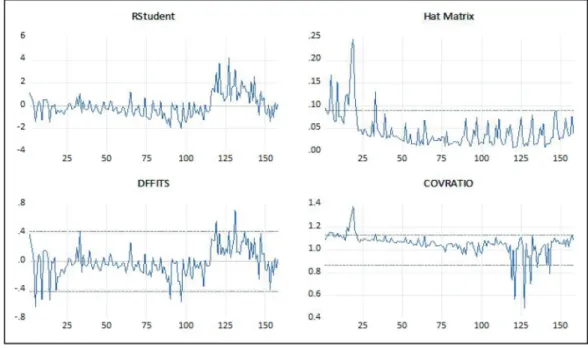
4.3. Robust Least Squares Regression Results Ordinary least squares estimators are sensitive to the presence of outliers. The sensitivity of conventional regression methods to these outlier observations can result to incorrect coefficient estimates. Thus, we utilized influence statistics and leverage plot to detect the presence of outliers for equations 1. The spikes in Figure 2 for equation 1 for all four influence measures point to the presence of outliers, (i.e., observations 127, 19, 131, 121, and 127 as being outliers). This finding is confirmed by the leverage plot view in Figure 3.
Table 1: Descriptive Statistics
COVID Google Community Mobility Indicators Apple Mobility Trends Indicators
TRANSIT WORK HOME PUBTRA DRIVE WALK
Mean 1575.59 -59.01 -42.94 23.46 32.95 43.37 42.47
Median 934.00 -60.00 -44.00 24.00 29.89 45.94 41.29
Maximum 6725.00 0.00 9.00 39.00 91.83 108.61 108.20
Minimum 0.00 -86.00 -74.00 0.00 17.49 17.10 20.66
Figure 1: Scatter Diagrams and Box Plots
Table 2 display the results of the robust least square regression using MM-estimation method. Turning to the coefficient estimates of the Google community mobility indicators, results of the robust least square regression show that visits to transit stations (TRANSIT) and staying-at-home
(HOME) have negative and statistically significant effect on the number of new COVID-19 daily infections. As indicated by the calculated z-statistic values (in absolute term) of 6.89 and 3.87, which are significant at 1-percent level. Thus, a 1-percentage point decrease in visits to transit stations is associated with a 133.87 decrease in the number of new COVID-19 daily infections. Also, the results suggest that a 1-percentage point increase in being at residential places or staying at home leads to 241.80 decrease in COVID-19 cases daily. On the other hand, WORK has negative, but insignificant effect. Thus, a 1-percentage point reduction in visits to workplaces results in 6.30 decrease in COVID-19 daily cases.
As for the coefficient estimates of the Apple mobility trends indicators, we see that PUBTRA has negative and statistically significant effect on the number of new COVID-19 daily infections. Meanwhile, DRIVE has positive and statistically significant effect. Since their calculated z-statistic values (in absolute term) of 2.89 and 6.09 are significant at 1-percent level. Thus, if people in the Philippines cuts down their use of public transport by 1 percentage point will result to a decrease in the number of new COVID-19 daily infections by 67.92. However, changes (i.e., reduction) in the volume of people driving results to an increase in the number of new COVID-19 daily infections by 128.25. On the other hand, WALK has negative, but insignificant effect. Thus, a 1-percentage point reduction in the amount people walking to their destinations result in 36.78 decrease in COVID-19 daily cases.
Figure 3: Leverage Plot (partialled on regressors)
Figure 2: Influence Statistics
The estimated equations also exhibit overall goodness- of-fit and adjusted measures with R2 and Rw2 ranges from 0.38 – 0.68. It means that roughly 38 to 68 percent of the total variation in COVID is accounted for or explained by the equations fitted on the given data. The Rn statistic value of 204.70 with corresponding p-value of 0.00 indicate strong rejection of the null hypothesis that all non-intercept coefficients are equal to zero. This implies that the model is significant. Thus, the number of COVID-19 daily infections has significantly affected by restrictions in economic activity for the period February 17-September 11, 2020.
5. Conclusions
This research investigates the effects of restrictions in economic activity on the spread of COVID-19 in the Philippines. Using daily time series data of new COVID-19 infections, Apple mobility trends and Google community mobility indicators covering the period February 17-September 11, 2020 this paper achieves such an analysis by utilizing paired correlation and robust least square regression. The number of new COVID-19 daily infections indicate some form of negative and positive weak correlation with Apple mobility trends and Google community mobility indicators. In terms of stopping the spread of COVID-19, it is implied that Filipinos have not benefited from driving less.
Across mobility measures from Apple and Google being in residential places or staying at home has the highest impact on reducing the spread of COVID-19, followed by visiting transit stations less, less use of public transport, less amount of walking, and less workplace visits. Moreover, the number of new COVID-19 daily infections exhibit a negative
association with visits to transit stations, being at residential places, use of public transport to destinations, and amount of walking to destinations. Meanwhile, the number of new COVID-19 daily infections indicate positive correlation with visits to workplaces and volume of people driving.
Thus, restrictions in economic activity can play a crucial role in flattening the curve of daily COVID-19 infections.
Although this study focuses exclusively on the effects of restrictions in economic activity using mobility data, the results can have policy implications in stopping the spread the novel coronavirus.
References
Alam, M. N., Alam, S., & Chavali, K. (2020). Stock Market Response during COVID-19 Lockdown Period in India:
An Event Study. Journal of Asian Finance, Economics and Business, 7(7), 131-137. https://doi.org/10.13106/jafeb.2020.
vol7.no7.131
Acemoglu, D., Chernozhukov, V., Werning, I., & Whinston, M.D.
(2020). Optimal Targeted Lockdowns in a Multi-Group SIR Model. Economic Fluctuations and Growth, Health Economics, Public Economics. National Bureau of Economic Research, Cambridge, MA, USA, Retrieved August 18, 2020, from https://www.nber.org/papers/w27102
Badr, H. S., Du, H., Marshall, M., Dong, E., Squire, M. M., &
Gardner, L. M. (2020). Association between mobility patterns and COVID-19 transmission in the USA: a mathematical modelling study. Lancet Infectious Disease. https://doi.
org/10.1016/S1473-3099(20)30553-3
Bonaccorsi, G., Pierri, F., Cinelli, M., Flori, A., Galeazzi, A., Porcelli, F., Schmidt, A. L., Valensise, C. M., Scala, A., Table 2: MM-estimation Method
Coefficient z-Statistic Probability
Constant -2884.89 -2.07 0.04
Google Community Mobility Indicators
TRANSIT -133.87 -6.89 0.00
WORK -6.30 -0.32 0.75
HOME -241.80 -3.87 0.00
Apple Mobility Trends Indicators
PUBTRA -67.92 -2.89 0.00
DRIVE 128.25 6.09 0.00
WALK -36.78 -1.07 0.28
Adjusted R
2= 0.38 Adjusted R =
w20.6 8
=
2