ORIGINAL ARTICLE
Assessment of Non-Point Source Pollutant Loads and Priority Management Areas using an HSPF Model in Sejong City, South Korea
Dohun Lim, Yoonjin Lee
1)*Korea Natural Environment Institute, Goyang 10462, Korea
1)Department of General Education, Konyang University, Nonsan 32992, Korea
Abstract
In this study, the discharge loads of non-point pollution sources were analyzed using a Hydrologic Simulation Program-Fortran (HSPF) model for 46 sub-watersheds in order to guide the management plan for water and streams passing through the city. The results using HSPF showed good applicability in comparison to point measurements, which were based on BOD, TP, and TN. The mean value of the BOD loads was 4.08 kg/km2 per day, and the highest level of BOD was 17.75 kg/km2 per day at Namri. Three potential areas of high priority for the installment of constructed wetlands were selected in order to reduce non-point pollution sources based on BOD loads and on environmental and economic conditions. The results for these scenarios indicated a maximum rate of reduction in BOD of 39.12% within the proposed constructed wetlands.
Key words : Non-point pollutant source, HSPF model, Watershed management, Constructed wetland
1)
1. Introduction
The management of water resources has mostly focused on treating point pollutant sources, leading to a drastic increase in the number of treatment facilities for removing pollutants, including industrial wastewater and sewage treatment plants. As human economic activity has increased, a greater amount and wider range of non-point pollutants have flowed into rivers and lakes. In Korea, water management is practically focused on sources of point pollution. Nevertheless, intense efforts have been made to expand facilities in order to improve the quality of lake and river water, even though such efforts do not contribute to a large
extent to the improvement of surface water quality in areas where the main sources of pollution are non-point in nature (Ko et al., 2008; Kim, 2010; Lee, 2010). Overall, the domestic contribution of non-point pollutants in 2010 was recorded to be about 68% on a BOD basis in river water and about 52% in urban areas. This value is expected to reach a maximum of 72% in 2020 (Collaboration with Relevant Government Ministries in Korea, 2012).
As urbanization increasingly accelerates, regions with once green tracts of land have been transformed to impervious areas such as roads and parking lots.
Rainfall effluent containing pollutants such as heavy metals and accumulated particulate matter collect on
Received 14 April, 2017; Revised 26 July, 2017;
Accepted 27 July, 2017
*Corresponding author: Yoonjin Lee, Department of General Education, Konyang University, Nonsan 32992, Korea
Phone : +82-41-730-5747 E-mail : [email protected]
ⓒ The Korean Environmental Sciences Society. All rights reserved.
This is an Open-Access article distributed under the terms of the Creative Commons Attribution Non-Commercial License (http://
creativecommons.org/licenses/by-nc/3.0) which permits unrestricted non-commercial use, distribution, and reproduction in any medium, provided the original work is properly cited.
these surfaces, and pollutants may then flow toward neighboring water systems, affect the self-purification processes of rivers, destroy aquatic ecosystems, or put at risk the quality of health of human populations.
The removal of non-point pollutants is relatively difficult compared with the removal of point-source pollutants, as the former are widely spread over forest and farmland areas, etc. (Lee, 2011; Shon et al., 2011). In addition, quantitative measurements and management of non-point pollutants are not easy tasks, as the behavior of these pollutants is affected by various factors such as weather, geology, and soil features (Shrestha et al., 2006; Ribarova et al., 2009;
You et al., 2012). Heavy metals and particulate matter generated by cars in paved areas as well as the accumulation of nitrogen and phosphorous due to the use of fertilizers in agricultural area represent several main sources of non-point pollutants (Yeo et al., 2012). Furthermore, non-point pollutants reportedly have a “first flush effect”, wherein high concentrations of pollutants that accumulate during a dry spell are then initially discharged at a high concentration following the first major rain, leading to a high amount of pollutants in the water outflowing to neighboring water systems through storm sewers (Roh et al., 2006; Mattias et al., 2009; Kim et al., 2012).
Urbanization causes an increase in impervious and overland flow in addition to a decrease in subsurface seepage and evapotranspiration. Recently, sudden natural disasters related to climate change in Korea have led to heavy rainfalls that are distinct from those in the past due to the destruction of natural water circulation systems. Urban water systems have mostly focused on directing storm water outside of cities through pipe systems. Low Impact Development (LID) strategies are one means of maintaining or effectively restoring the hydrologic and ecological functions of watersheds and of managing storm water under a more natural approach, thereby minimizing
the influence of urban developments (Kim et al., 2004; Dietz, 2007; Choi et al., 2013). Distinct from gray infrastructure, natural water management aims to disperse storm water and non-point source pollutants at their area of occurrence. Such designs have been developed under different names, including decentralized urban design (DIU) in Germany and Water Sensitive Urban Design (WSUD) in Australia, which have served as countermeasures to minimize water management problems resulting from urbanization and climate change.
Facilities or naturally constructed systems for reducing non-point pollutants can be categorized by retention type, infiltration type, vegetation type, apparatus type, installation type, etc. Constructed wetlands represent one type of LID and may be implemented to improve the natural purification capacity of existing or constructed wetlands through implementing processes of sedimentation, filtration, and absorption, thereby serving to eliminate pollutants and to provide habitats for wild animals and plants (Gavin et al., 2004). Constructed wetlands can be utilized as a supplemental treatment for the organic matter that is processed in existing sewage treatment plants. High concentration of nitrogen and phosphorous could lead to eutrophication (Koo, 2005; Kadlec and Wallace, 2008). In addition, water management methods utilizing constructed wetlands are regarded as an economic means of management and as ecofriendly, as they may utilize existing sections of ecosystems (Mitsch and Gosselink, 2000).
SWAT (Soil and Water Assessment Tool) and HSPF (Hydrological Simulation Program-Fortran) are widely used as semi-distributed watershed runoff simulation models. Both models can be connected with GISs to reduce time required for analysis.
Generally, SWAT is mostly applied in farm villages
and mountainous regions, and HSPF is known to be
suitable for both towns and city areas. The HSPF
model combines both a watershed and a water quality
model and simulates the runoff of non-point source pollutants following rainfall by combining the hydraulic dynamics of streams with the potential effects of sediments and chemicals (Singh et al., 2004; Nasr et al., 2007).
In this research, the discharge levels of non-point pollutants were assessed in order to inform the water quality management for urban streams passing through Sejong City. Non-point source pollutant loads were evaluated in several sub-watersheds using the HSPF model. Priority areas for the management of non-point source pollutants were identified by analyzing the potential effects of implementing constructed wetlands under different scenarios, and a plan for a constructed wetland that would reduce non-point source pollutants is presented.
2. Materials and Methods
2.1. Target area
Sejong City is special autonomous city in South Korea under the direct control of the government with a Metropolitan Council that was newly established in 2012. The city, with a total area of 464.9 m
2, is located on the central inland of Chungcheongnam-do and has a northward to southward orientation. The main land use consists of forest and wooded area (54.32%), while another 24.37% and 3% correspond with agricultural land and urban sites with buildings, respectively. Gum River and Miho Stream run through the city, and Cho Stream flows toward a southward direction, intersecting with Miho Stream.
Miho Stream also flows toward the south, meets Gum River, and finally discharges into Ganghang Bay, located along the eastern seaboard.
2.2. Overview of the HSPF model
The HSPF (Hydrological Simulation Program -Fortran) is an application for modeling for watershed management that was modified from the Stanford
Watershed Model. Win-HSPF was developed with BASIN-58-6458-64 (Better Assessment Science for Integrating Point and Nonpoint Sources) to provide an easy operation environment for users and to take advantage of large amounts of data, including geological, meteorological, etc. An effective and comprehensive management of water resources is feasible with HSPF. File input and corrections are convenient, as the program can directly access data based on time series, and new modules can be added.
In addition, the operating environment of model is relatively simple and easy to use. The HSPF assessment consists of simulations of the water quality and the flood gate, including a PERLND module for pervious areas, an IMPLAND module for impervious areas, and a RCHRES module for water bodies. Each module distinctly considers water flow, soil characteristics, nutrient concentrations, and presence of phytoplankton in addition to other parameters. The pervious layers are divided into three zones: upper zone, lower zone, and ground water.
Crucial factors contributing toward the simulation of the flood gate and the hydrography are the surface storage, evapotranspiration, infiltration, etc., for both pervious and impervious layers. The water simulation is unidirectional, consisting of inflow from one direction and outflow in several corresponding directions. The overland flow, interflow, and groundwater runoff flow into streams by the accumulation and washing of pollutants and those react as pollutants, separated by absorbed onto soil and dissolved matters.
2.3. Model construction
Various data are required such as pollutant data,
DEM (Digital Elevation Model), a land cover map,
and different data measurements, including point
measurements for monitoring water quality and
quantity. Meteorological data on temperature,
precipitation, dew-point temperature, cloud cover,
amount of clouds, evapotranspiration, and wind velocity are required to build an HSPF model.
Meteorological data were collected by the regional meteorological stations of Chungju and Daejeon from 2015 to 2016. The data on wastewater plants were based on national survey data on pollutants and supplied by the National Institute of Environmental Research in Korea and annual reports by local governments. The land cover map for the investigation was created in an EGIS (Environmental Geographic Information System) and supplied by the Ministry of the Environment in Korea. The simulation of the watershed was built with graphic data on land cover, using shape files in Arc View, upon which database input files were overlapped. The calibration and validation of water quality and runoff were performed with measurement data at the watershed exit, considering total maximum loads for an interval of eight days. Items of BOD, TN, and TP were assessed for water quality.
3. Results and Discussion
3.1. Model building
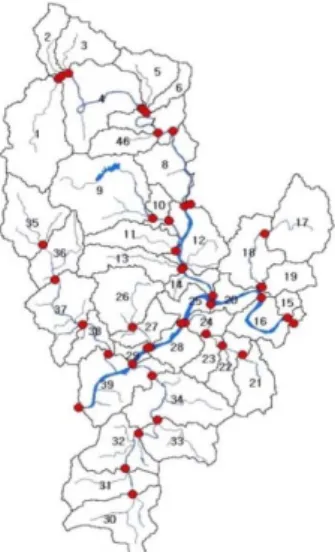
Topographical and meteorological data and a land cover map were inputs in the HSPF model. The city was categorized according to 46 sub-watersheds, considering the water measurement points, soil utilization map, and river map (Fig. 1). Domestic data was corrected from individual institutes to build the model. Specifically, a National Land Map 2008 by the Ministry of the Environment in Korea and a DEM supplied by K-Water from a 2010 base year were used.
The area and mean length of each watershed were extracted to build data on water quality and hydraulic conditions and for monitoring the inflow and outflow. Data on weather and pollutant loads were created by WDMUtil, which is a management program of WinHSPF.
Fig. 1. The 46 sub-watersheds of Sejong City for the HSPF modeling.
3.2. HSPF modeling
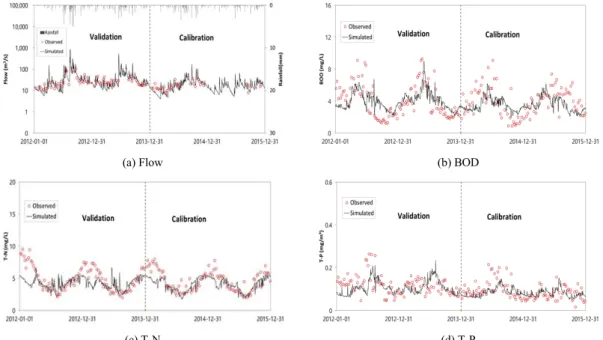
A process for reviewing and verifying flow and water quality was carried out. The revision and verification periods lasted from 2012 to 2013 and from 2014 to 2015, respectively (Fig. 2). The revision of the parameters of the model involved comparing its calculated estimates with point measurement values. The values of % difference, as suggested by Donigian(2000), were used to evaluate the applicability of the HSPF Model in this context.
Three unit areas within regulations for total amount
of water pollutants, Miho C, Gumbon H, and
Gumbon H-1, were selected for the calibration and
validation of water quality and flow. The evaluation
items for water quality were BOD, TN, and TP. The
values of % difference for flow in all three cases were
below 10. For BOD, the values of % difference were
-0.07, 3.82, and 14.15 for Miho C, Gumbon H, and
Gumbon H-1, respectively, for the calibration period
and 10.99, 11.97, and 13.71, respectively, for the
validation period (Table 1). The values of %
difference for TN and TP for all three areas were
below 15, indicating that the values simulated by the
HSPF model reflect well the measured values. The
(a) Flow (b) BOD
(c) T-N (d) T-P
Fig. 2. Comparison of observed and simulated BOD, TN, TP, and water flow in the Miho C area.
Items Miho C Gumbon H Gumbon H-1
% Difference Performance % Difference Performance % Difference Performance
Calibration
Flow(m3/s) 8.86 Very Good -2.80 Very Good -1.39 Very Good
BOD(mg/L) -0.07 Very Good 3.82 Very Good 14.15 Very Good
T-N(mg/L) 12.40 Very Good 9.54 Very Good 7.33 Very Good
T-P(mg/L) 11.74 Very Good 7.25 Very Good 4.91 Very Good
DO(mg/L) -1.06 Very Good -4.07 Very Good 4.99 Very Good
Verification
Flow(m3/s) 5.20 Very Good 8.86 Very Good 9.19 Very Good
BOD(mg/L) 10.99 Very Good 11.97 Very Good 13.71 Very Good
T-N(mg/L) 10.79 Very Good 10.21 Very Good 10.39 Very Good
T-P(mg/L) 9.78 Very Good 8.09 Very Good -3.33 Very Good
DO(mg/L) -1.79 Very Good 1.33 Very Good 10.99 Very Good
Table 1. Results of the calibration and validation analysis for the water flow and quality generated by the HSPF model
verification and validation for the water items were
also performed using data for the sites of Chocheon, Walhacheon, Yongsucheon, Daegyocheon (all values of % difference were blow 15, although these data are not presented).
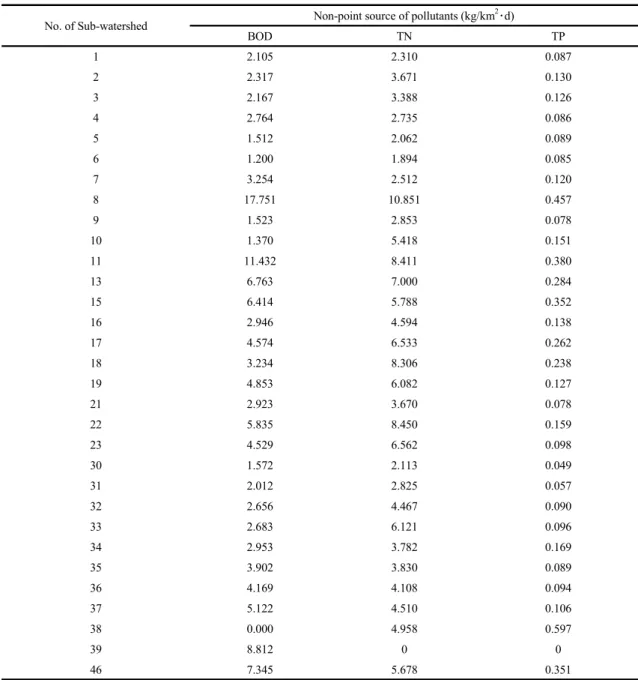
3.3. Pollutants discharged in unit watershed area
The pollutant load per unit of the watershed area, considering BOD, TN, and TP, was assessed using HSPF modeling and details are presented in Table 2.
Assessments for the district of the government
administration (sub-watersheds no. 14, 20, 24, 25, 26,
27, 28, and 29) were excluded because those areas
are narrow and include mostly administrative
No. of Sub-watershed Non-point source of pollutants (kg/km2・d)
BOD TN TP
1 2.105 2.310 0.087
2 2.317 3.671 0.130
3 2.167 3.388 0.126
4 2.764 2.735 0.086
5 1.512 2.062 0.089
6 1.200 1.894 0.085
7 3.254 2.512 0.120
8 17.751 10.851 0.457
9 1.523 2.853 0.078
10 1.370 5.418 0.151
11 11.432 8.411 0.380
13 6.763 7.000 0.284
15 6.414 5.788 0.352
16 2.946 4.594 0.138
17 4.574 6.533 0.262
18 3.234 8.306 0.238
19 4.853 6.082 0.127
21 2.923 3.670 0.078
22 5.835 8.450 0.159
23 4.529 6.562 0.098
30 1.572 2.113 0.049
31 2.012 2.825 0.057
32 2.656 4.467 0.090
33 2.683 6.121 0.096
34 2.953 3.782 0.169
35 3.902 3.830 0.089
36 4.169 4.108 0.094
37 5.122 4.510 0.106
38 0.000 4.958 0.597
39 8.812 0 0
46 7.345 5.678 0.351
*No 12, 14, 24-29 were excluded for the assessment
Table 2. Loads of non- point source pollutants in the sub-watersheds of Sejong City
buildings. Several apartment buildings already had installed facilities to reduce pollutants. Mean levels of BOD, TN, and TP in 2012 were estimated to be 4.08, 4.55, 0.17 kg per day/km
2, respectively, within the city (Fig. 3). The highest levels of BOD and TN
loading per unit area were shown in Jochiwon-eup
and Osong-eup (administrative districts). The values
of BOD and TN were 17.75, 10.85 kg per day/km
2,
respectively, in 8 sub-watersheds categorized as
having highest levels of these pollutants.
(a) BOD (b) T-N (c) T-P Fig. 3. BOD, TN, and TP loads of non-point sources of pollutants in Sejong City.
Three drainage spots, Namri (area A), Deunggok (area B), and Bongam (area C), corresponding with sub-watershed areas 8, 15, and 11, were finally selected as high priority areas for management, as they impact the water quality of Jo Stream, Bongam Stream, and Deunggok Stream, respectively (Figs. 4 and 5). The no. 8 unit corresponds with the downtown area, which mainly has residential, road, commercial, and agricultural uses. These areas with management potential were selected based on the loads of discharged BOD, in addition to the following points:
site security; high potential for pollution by non-point sources; catchment interpretations conceivable regions;
and the presence of livestock farming areas with poor management, where wastes flow directly toward streams, thereby contributing considerable levels of non-point pollutants.
3.4. Assessment of appropriate technology applications
For three sites, constructed wetlands were proposed to reduce non-point pollution. The target areas for such treatment were 15.97, 2.89 and 11.64 km
2. A
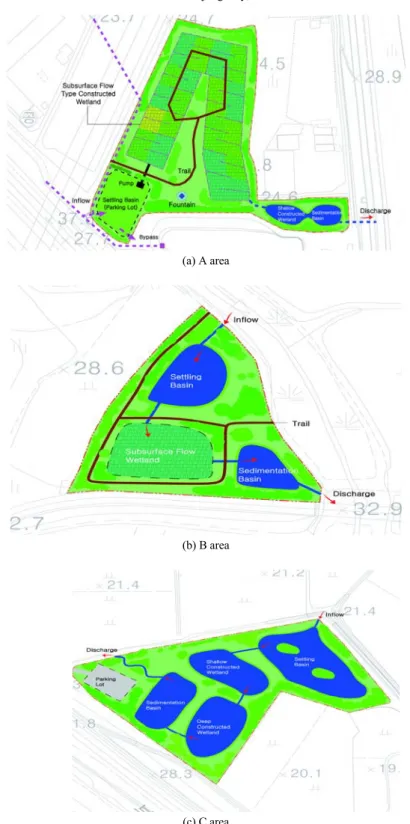
subsurface flow type wetland was suggested for area A (rainfall-settling basin-subsurface flow type constructed wetland-shallow constructed wetland- sedimentation basin-discharge) In particular, this process can be utilized in conjunction with existing retarding basins at rainwater pump stations. A high efficiency constructed wetland was planned for area B (rainfall-inlet watercourse-primary settling basin- subsurface flow wetland-surface flow wetland-discharge);
meanwhile, rainfall-inlet water way-primary settling basin-shallow constructed wetland-deep constructed wetland-sedimentation basin-discharge was suggested for area C (Fig. 6).
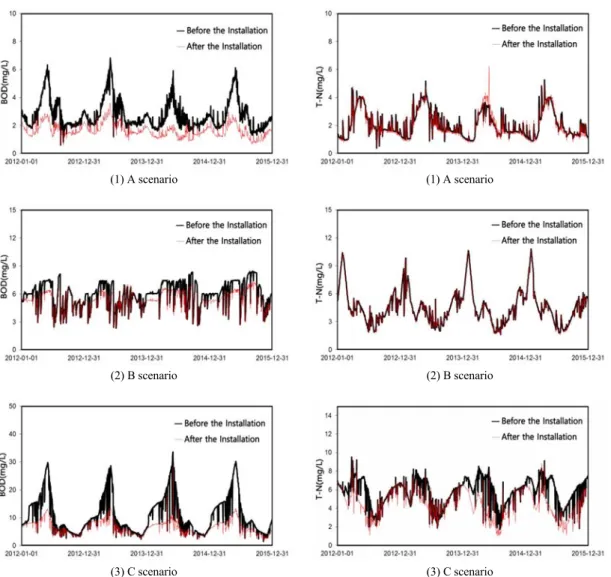
The removal efficiency of BOD for constructed
wetlands was assessed by the HSPF model to be
39.12%, 8.38%, and 36.61% for sites A, B, and C,
respectively. The TN removal efficiency was
estimated at 4.9%, 0.94%, and 17.71% for sites A, B,
and C, respectively. Constructed wetlands at areas A
and C were estimated to work efficiently and have a
relatively large treatment capacity compared with
area B. Moreover, area A had certain advantages
(1) A scenario
(2) B scenario
(3) C scenario
(1) A scenario
(2) B scenario
(3) C scenario Fig. 4. Variations in BOD for the three scenarios of constructed
wetlands.
Fig. 5. Variations in TN for the three scenarios of constructed wetlands.
facilitating the collection of rainfall due to the existence of storm water pipes and its location near a drainage area, thereby reducing the required facilities.
The highest efficiencies of TN and TP removal are shown in area C.
Area A was finally selected in this study as the top candidate for the following reasons. First, the BOD reduction efficiency was assessed to be the highest with the installment of a wetland this area, and the
removal efficiencies of TN and TP were also
considerably fair. The existence of a separate sewer
system in area A could facilitate the interception of
storm water and be easy to maintain because the area
is close to Chocheon Stream. This area also has good
access to areas for walking and can form a resting
area for people passing through, such as an ecological
park, thereby also serving the functions of attracting
greater publicity and providing education on the
(a) A area
(b) B area
(c) C area
Fig. 6. Plan for the installment of a constructed wetland in a potential priority treatment area.
Name Main stream/ Drainage area Subwatershed No.
Area (km2)
Suggested process
Facility area (m2) A
scenario Cheocheon/Namri 8 15.81
Waterway type wetland constructed
wetland
13650
B
scenario Deunggokcheon/Deunggok 15 2.92 High effective wetland 21000
C
scenario Bongamcheon/Bongam 11 11.65 Constructed
wetland 20000
Table 3. Point assessments for priority treatment areas and the installment of facilities for the management of non-point pollutants in Sejong City