결구배추 잎의 이화학적 성분 조성
⁃연구노트⁃
성기운1․황인욱2․정신교1
1경북대학교 식품공학부
2동아대학교 식품영양학과
Physicochemical Composition of Head-Type Kimchi Cabbage Leaves
Gi-Un Seong1, In-Wook Hwang2, and Shin-Kyo Chung1
1School of Food Science and Biotechnology, Kyungpook National University
2Department of Food Science and Nutrition, Dong-A University
ABSTRACT To increase the consumption of head-type kimchi cabbage leaves as fresh food ingredients, the phys- icochemical composition was investigated depending on leaf parts. Kimchi cabbage leaves were divided into three portions, such as outer (L1), mid (L2), and inner (L3), and their proximate compositions were determined along with dietary fiber, free sugar, organic acid, free amino acid, and mineral contents. Contents of moisture, crude protein, and crude fat were highest in L1, whereas contents of crude ash and carbohydrate were highest in L3 (P<0.05).
Calories ranged 24.5∼26.5 kcal/100 g with no significant difference among leaf parts, and dietary fiber content of L1 was highest (P<0.05). Fructose, glucose, and sucrose contents were highest in L3 (P<0.05). Citric acid, malic acid, and succinic acid were detected, and contents of citric acid and malic acid were highest in L3, in contrast, succinic acid was highest in L1 (P<0.05). Glutamic acid, constituting over 30% of the total free amino acid contents, was highest in L3, whereas γ-aminobutyric acid contents were highest in L1 (P<0.05). K, Na, Ca, and Mg were the major minerals in head-type kimchi cabbage, and their contents showed no significant differences (P<0.05). It can be proposed that marketing of head-type kimchi cabbage as a fresh-cut vegetable could be enhanced due to the different quality characteristics of its leaf parts.
Key words: kimchi cabbage leaves, composition, dietary fiber, γ-aminobutyric acid(GABA), quality
Received 27 January 2016; Accepted 22 March 2016
Corresponding author: Shin-Kyo Chung, School of Food Science and Biotechnology, Kyungpook National University, Daegu 41566, Korea
E-mail: [email protected], Phone: +82-53-950-5778
서 론
배추는 십자화과에 속하는 두해살이 잎줄기 채소로 우리 나라의 대표적인 채소이다. 배추는 호냉성으로서 김장용으 로 주로 가을에 재배됐으나 최근에는 계절별로 적합한 품종 이 개발되어 연중 출하가 가능하게 되었으며, 포기 형태에 따라 결구형, 반결구형, 불결구형으로 분류된다(1,2). 배추 는 식이섬유, 각종 비타민 성분과 칼슘을 비롯한 무기질 성 분이 풍부하고, 십자화과 채소 특유의 생리활성 물질인 glu- cosinolate(3)를 함유하고 있어서 독특한 향미와 함께 항암 효과가 뛰어난 것으로 보고되어 있다(4,5). 국내에서 배추는 연간 200만 톤 이상이 생산되고 있으며 수급의 균형과 적정 가격의 유지를 위하여 한식의 주재료 및 부재료로서 수요를 더욱 확대하고 증가하는 방안이 마련되어야 한다(6).
현대의 식생활 패턴의 변화로 인한 고지방 및 고단백질
식품 섭취의 증가와 함께 이에 따른 대사성 질환을 예방하기 위하여 항산화성이 풍부한 과일 및 채소류의 소비가 꾸준하 게 늘어나고 있다(7,8). 과일 및 채소류 섭취의 증가로 인하 여 암, 당뇨, 심장질환, 치매 등의 발병률을 감소시킬 수 있다 는 과학적 증거들이 최근에 더욱 많이 보고되고 있으며(9), 채소류에 포함된 비타민 C, 비타민 E, 카로티노이드, 플라보 노이드, 탄닌 및 여러 페놀성 화합물은 잠재적인 항산화 성 분으로 알려졌다(10). 한편 김치 이외의 용도로 특히 결구배 추 부위에 따라 육류 음식과 곁들여 먹거나 추어탕을 비롯하 여 각종 전골류 음식 등의 부재료로 활용된다. 이에 본인 등은 결구배추를 신선편의 채소류 소재로의 활용을 증대하 기 위하여 겉, 중, 속잎 부분으로 구분하여 항산화 활성과 폴리페놀 성분을 측정하고 주성분 분석(Principal Compo- nent Analysis, PCA)으로 그 차이를 보고(11)한 바 있다.
결구배추의 성분 특성에 관한 연구로는 이화학적 성분 특성 (12-15), 수확 시기에 따른 품질 특성(16), 저장 중 품질 특성의 변화(17-20) 및 생리활성 성분에 관한 연구(21,22), 플라보노이드를 포함하는 폴리페놀화합물의 항산화 활성에 관한 연구(23-25)가 보고되어 있다.
따라서 본 연구에서는 결구배추의 부위별 일반성분, 식이
섬유, 당 및 아미노산, 무기질과 같은 이화학적 성분 특성을 분석하여 보고하고자 한다.
재료 및 방법
실험 재료
본 실험에 사용한 결구배추(Brassica rapa L. ssp. peki- nensis)는 전라남도 해남군에서 2013년도에 노지 재배한
‘휘파람’ 품종을 화원농협(Hwawon Agricultural Cooper- ative, Haenam-gun, Korea)에서 공여 받았다. 분석용 시 료는 배추 잎을 겉잎(L1), 중잎(L2), 속잎(L3)으로 3등분하 여 각각을 3회 세척 후 탈수하여 동결건조기(Bondiro. Mod (TFD8503), Ilshin Lab Co., Seoul, Korea)에서 건조하였 으며, 분쇄기(FM-681C, Hanil, Incheon, Korea)로 분쇄하 여 시료로 사용하였다.
일반성분, 식이성분 및 열량 분석
일반성분은 AOAC법(26)에 준하여 시행하였다. 수분 함 량은 105°C 상압가열건조법으로, 조단백질 함량은 Micro Kjeldahl법으로, 조지방 함량은 Soxhlet 추출법으로, 그리 고 조회분 함량은 550°C 건식회화법으로 각각 분석하였다.
탄수화물 함량은 100에서 수분, 조단백질, 조지방, 조회분 함량을 뺀 것으로 하였다. 총식이섬유 함량은 효소-중량법 인 Prosky 등(27)의 방법에 따라 total dietary fiber assay kit(Sigma-Aldrich Co., St. Louis, MO, USA)을 사용하여 정량하였다. 시료 1.00 g에 phosphate buffer(pH 6.0) 50 mL, α-amylase 0.1 mL를 넣어 95°C에서 15분간 반응시키 고 pH 7.5로 조절하여 60°C에서 protease 0.1 mL를 넣어 30분간 반응시켰다. 다시 pH 4.5로 조절하여 amylogluco- sidase 0.1 mL를 넣어 30분간 반응시켜 전분과 단백질을 제거하였다. 걸러진 잔사는 불용성 식이섬유 정량에, 여과액 은 따로 모아 95% EtOH을 가하여 침전시키고 다시 여과하 여 수용성 식이섬유 정량에 사용하였다. 총식이섬유 함량은 측정한 불용성 및 수용성 식이섬유 함량의 합으로 산출하였 다. 열량 계산은 분석시료 100 g 중 조단백질, 조지방 및 탄수화물에 단백질 4, 지방 9, 탄수화물 4의 계수를 곱하여 서 구하였다.
유리당 및 유기산 분석
배추 시료의 유리당 및 유기산 분석을 위한 전처리는 배추 시료 50 g을 마쇄 착즙 후 여과하여 얻은 여과액을 원심분리 (3,200 rpm, 20 min, 4°C) 하여 상징액을 취한 다음 증류수 로 50 mL로 정용하였다. 이 시료를 0.45 μm membrane filter로 여과하여 high performance liquid chromatog- raphy(HPLC, 1260 Infinity Quaternary LC System, Agi- lent Technologies, Palo Alto, CA, USA)로 분석하였다.
유리당 분석은 Zorbax-Carbohydrate analysis column (250×4.6 mm, 5 μm, Agilent Technologies)을 사용하여
1.4 mL/min의 유속으로 refractive index detector(RID)에 의해 분석하였다. 이동상은 acetonitrile : water(75:25, v/
v)를 이용하였다. 유기산 분석은 Aminex HPX-87H cation- exchange column(300×7.8 mm, 9 μm, Bio-Rad Labora- tories, Hercules, CA, USA)으로 0.6 mL/min의 유속으로 UV detector를 사용하여 214 nm에서 분석하였다. 이동상 은 5 mM sulfuric acid를 이용하였다. 각각 fructose, glu- cose, sucrose와 citric acid, malic acid, succinic acid (Sigma-Aldrich Co.)의 표준품을 사용하여 외부표준법으 로 정량하였다.
유리 아미노산 분석
분말시료 10 g에 75% EtOH 100 mL를 가하여 80oC에서 2시간 환류 추출 후 여과한 여액을 감압 농축하여 0.2 M sodium citrate buffer(pH 2.2) 용액 5 mL로 정용하고, Sep-pak C18 cartridge로 처리하여 0.45 μM membrane filter로 여과한 다음 automatic amino acid analyzer(Bio- chrom 30, Biochrom Ltd., Cambridge, UK)로 분석하였다 (28).
무기질 분석
무기질 함량 측정은 AOAC법(26)에 준하여 시행하였다.
시료 2 g, 20% HNO3 10 mL 및 60% HClO4 3 mL를 가한 후 12시간 이상 가열하여 노란색의 맑은 용액이 될 때까지 실시하고 반응이 끝나면 시료 용액을 0.45 μm membrane filter로 여과하여 0.5 M HNO3으로 50 mL volumetric flask로 정용한 다음 분석용액으로 하였다. 0.5 M HNO3을 대조구로 하여 Inductively coupled plasma optical emis- sion spectrometer(ICP-OES, IRIS Intrepid, Thermo Elemental Ltd., Winsford, UK)로 분석하였다(Ca 393.366, Co 228.616, Cu 324.754, Fe 259.940, K 766.491, Mg 285.213, Mn 257.610, Mo 202.030, Na 588.995, Zn 213.856 nm).
통계 처리
모든 실험은 3회 반복하여 평균±표준편차(mean±stand- ard deviation)로 나타내었으며, Statistical Analysis Sys- tem(SAS, version 9.4, SAS Institute Inc., Cary, NC, USA)을 이용하여 다중범위 검정(Duncan's multiple range test, P<0.05)을 실시하여 분석하였다.
결과 및 고찰
일반성분, 식이성분 및 열량
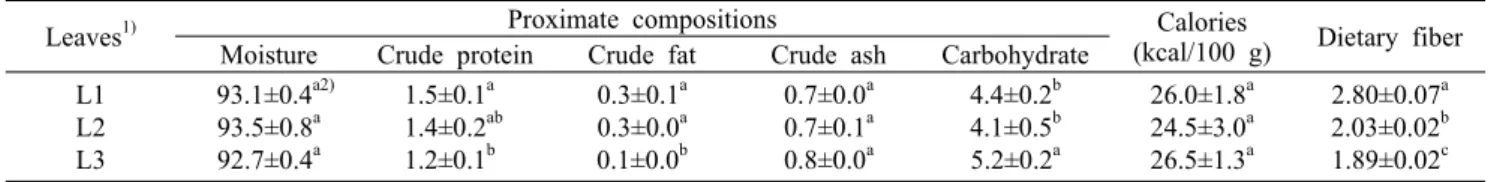
배추 잎의 일반성분 및 총식이섬유 함량을 측정한 결과는 Table 1과 같다. 수분 함량은 부위별로 92.7~93.5% 범위를 나타내었다. 탄수화물의 함량은 부위별로 4.1~5.2%의 범위 를 나타내었으며, 배추 잎의 속잎 부위가 중잎과 겉잎보다
Table 1. Proximate compositions and total dietary fiber contents of the head-type kimchi cabbage leaves (%, wet basis)
Leaves1) Proximate compositions Calories
(kcal/100 g) Dietary fiber Moisture Crude protein Crude fat Crude ash Carbohydrate
L1 L2 L3
93.1±0.4a2) 93.5±0.8a 92.7±0.4a
1.5±0.1a 1.4±0.2ab 1.2±0.1b
0.3±0.1a 0.3±0.0a 0.1±0.0b
0.7±0.0a 0.7±0.1a 0.8±0.0a
4.4±0.2b 4.1±0.5b 5.2±0.2a
26.0±1.8a 24.5±3.0a 26.5±1.3a
2.80±0.07a 2.03±0.02b 1.89±0.02c
1)L1: outer portion, L2: mid-portion, L3: inner portion.
2)Values with different letters within the same column are significantly different at P<0.05.
Values are expressed as the mean±SD (n=3).
Table 2. Free sugar and organic acid contents of the head-type kimchi cabbage leaves (%, wet basis)
Leaves1) Free sugar Organic acid
Fructose Glucose Sucrose Citric acid Malic acid Succinic acid L1
L2 L3
1.23±0.03b2) 1.54±0.03b 2.51±0.35a
1.53±0.06b 1.85±0.07b 2.86±0.35a
0.08±0.01b 0.13±0.03a 0.11±0.00ab
ND3) ND 0.02±0.00a
0.04±0.00c 0.06±0.01b 0.08±0.00a
0.19±0.01a 0.14±0.03b 0.10±0.01b
1)L1: outer portion, L2: mid-portion, L3: inner portion.
2)Values with different letters within the same column are significantly different at P<0.05.
3)ND: not detected.
Values are expressed as the mean±SD (n=3).
높게 나타났다(P<0.05). 조단백질은 부위별로 1.2~1.5%의 범위를 나타내었으며, 조지방 함량은 부위별로 0.1~0.3%의 범위로 나타났고, 겉잎의 조단백질 및 조지방의 함량이 가장 높았다(P<0.05). 회분은 0.7~0.8%의 범위로 배추 잎의 부 위별 차이는 보이지 않았다. 이러한 부위별 배추 잎의 함량 결과는 유기농 배추와 일반배추를 비교 분석한 보고(2)와 유사하였다. 배추 잎의 부위별 열량은 100 g당 24.5~26.5 kcal의 범위로 차이가 없었다(P<0.05). 식이섬유 성분은 주 로 비전분성 다당류로 혈중 콜레스테롤 제거, 변비 억제 등 과 같은 생리활성을 가진다(29). 배추 잎의 총식이섬유 함량 은 부위별로 1.89~2.80%의 범위로 Park과 Kim(30)의 보 고와 유사하였으며, 겉잎, 중잎, 속잎(L1> L2 > L3) 순으로 높게 나타났다(P<0.05).
유리당 및 유기산 함량
배추 잎의 유리당 및 유기산 함량을 분석한 결과는 Table 2에 나타내었다. 배추에서 분석한 유리당은 fructose, glu- cose 및 sucrose 3가지였으며, fructose와 glucose의 함량 에 비하여 sucrose의 함량이 낮게 나타났다. 부위별 fruc- tose 함량 및 glucose 함량은 속잎 부위에서 각각 2.51%, 2.86%로 높게 나타났으며, 배추 잎의 부위별 sucrose 함량 은 0.08~0.13%의 범위를 나타내었다. 이러한 결과는 월동 배추의 유리당 함량을 측정한 연구(15,31)와 비슷한 값을 보였으며, 속잎의 함량이 높은 것을 확인할 수 있었다. 배추 잎에서 검출 및 정량된 유기산은 citric acid, malic acid 및 succinic acid였다. Citric acid의 함량은 속잎 부위에서 0.02%로 나타났으나 겉잎과 중잎에서는 검출되지 않았고 malic acid는 부위별로 0.04~0.08%의 범위를 나타내었으 며, 배추 잎의 부위별 citric acid 및 malic acid의 함량은 속잎이 모두 높게 나타났다(P<0.05). 배추 잎의 부위별
succinic acid 함량은 0.10~0.19%의 범위였으며, 겉잎이 가장 높은 함량을 나타내었다. 계절별 배추의 유기산 함량을 비교한 결과 citric acid는 0.01~0.05%의 범위를 나타내었 고, malic acid는 0.12~0.15%로 측정되어 유사한 결과 (2,19)를 나타내었다.
유리 아미노산 함량
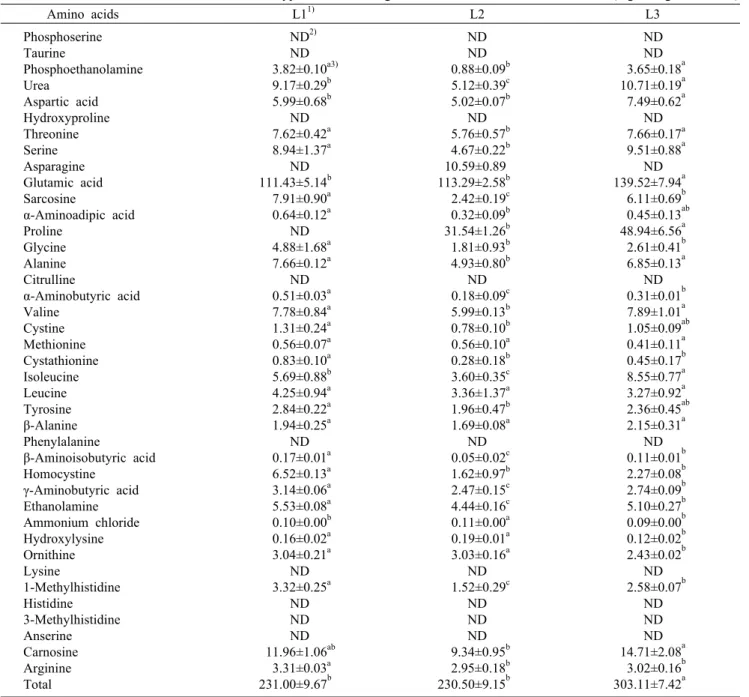
배추 잎의 유리 아미노산 함량을 측정한 결과는 Table 3과 같다. 부위별 총아미노산 함량은 230.50~303.11 mg/
100 g의 범위로 나타났으며, 속잎의 함량이 중잎과 겉잎보 다 높았다(P<0.05). 유리 아미노산 중에서 glutamic acid의 함량이 111.43~139.52 mg/100 g으로 가장 높았으며, 이 는 glutamic acid가 배추의 주요 유리 아미노산이라는 보고 와 일치한다(12). 부위별 glutamic acid의 함량은 속잎 부위 의 함량이 가장 높게 나타났다. 신경계의 흥분을 완화하고 수면을 촉진하는 효과가 있는(32) γ-aminobutyric acid (GABA)의 함량은 겉잎(L1)에서 높게 나타났다.
무기질 함량
배추 잎의 무기질 함량을 측정한 결과는 Table 4와 같다.
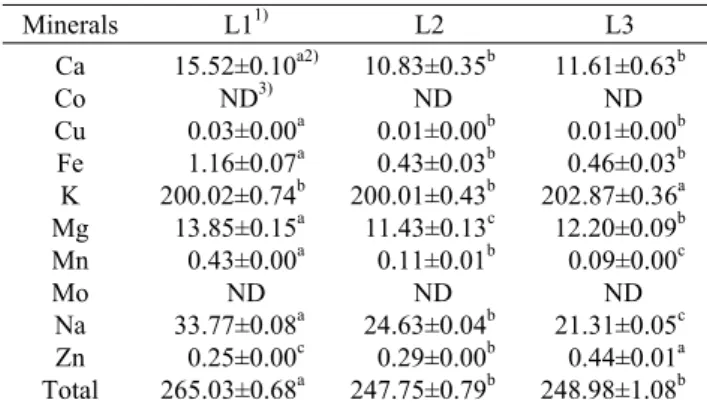
Na, K, Ca 및 Mg 등의 10종의 무기질 성분에 대하여 각각의 함량을 측정한 결과 K의 함량이 200.01~202.87 mg/100 g으로 가장 높게 나타났다. 배추의 주요 무기질 성분은 K, Na, Ca 및 Mg로 확인되었으며(1,2), 속잎(L3) 중의 K 함량 및 Zn 함량은 높았으나, 다른 무기질 함량은 겉잎(L1)에서 높았다.
요 약
김치용 결구배추를 겉잎(L1), 중잎(L2), 속잎(L3)으로 세 등
Table 3. Free amino acid contents of the head-type kimchi cabbage leaves (mg/100 g, wet basis)
Amino acids L11) L2 L3
Phosphoserine Taurine
Phosphoethanolamine Urea
Aspartic acid Hydroxyproline Threonine Serine Asparagine Glutamic acid Sarcosine
α-Aminoadipic acid Proline
Glycine Alanine Citrulline
α-Aminobutyric acid Valine
Cystine Methionine Cystathionine Isoleucine Leucine Tyrosine β-Alanine Phenylalanine
β-Aminoisobutyric acid Homocystine
γ-Aminobutyric acid Ethanolamine Ammonium chloride Hydroxylysine Ornithine Lysine
1-Methylhistidine Histidine 3-Methylhistidine Anserine Carnosine Arginine Total
ND2) ND 3.82±0.10a3) 9.17±0.29b 5.99±0.68b ND 7.62±0.42a 8.94±1.37a ND 111.43±5.14b 7.91±0.90a 0.64±0.12a ND 4.88±1.68a 7.66±0.12a ND 0.51±0.03a 7.78±0.84a 1.31±0.24a 0.56±0.07a 0.83±0.10a 5.69±0.88b 4.25±0.94a 2.84±0.22a 1.94±0.25a ND 0.17±0.01a 6.52±0.13a 3.14±0.06a 5.53±0.08a 0.10±0.00b 0.16±0.02a 3.04±0.21a ND 3.32±0.25a ND ND ND 11.96±1.06ab 3.31±0.03a 231.00±9.67b
ND ND 0.88±0.09b 5.12±0.39c 5.02±0.07b
ND 5.76±0.57b 4.67±0.22b 10.59±0.89 113.29±2.58b 2.42±0.19c 0.32±0.09b 31.54±1.26b 1.81±0.93b 4.93±0.80b
ND 0.18±0.09c 5.99±0.13b 0.78±0.10b 0.56±0.10a 0.28±0.18b 3.60±0.35c 3.36±1.37a 1.96±0.47b 1.69±0.08a
ND 0.05±0.02c 1.62±0.97b 2.47±0.15c 4.44±0.16c 0.11±0.00a 0.19±0.01a 3.03±0.16a
ND 1.52±0.29c
ND ND ND 9.34±0.95b 2.95±0.18b 230.50±9.15b
ND ND 3.65±0.18a 10.71±0.19a 7.49±0.62a ND 7.66±0.17a 9.51±0.88a ND 139.52±7.94a 6.11±0.69b 0.45±0.13ab 48.94±6.56a 2.61±0.41b 6.85±0.13a ND 0.31±0.01b 7.89±1.01a 1.05±0.09ab 0.41±0.11a 0.45±0.17b 8.55±0.77a 3.27±0.92a 2.36±0.45ab 2.15±0.31a ND 0.11±0.01b 2.27±0.08b 2.74±0.09b 5.10±0.27b 0.09±0.00b 0.12±0.02b 2.43±0.02b ND 2.58±0.07b ND ND ND 14.71±2.08a 3.02±0.16b 303.11±7.42a
1)L1: outer portion, L2: mid-portion, L3: inner portion.
2)ND: not detected.
3)Values with different letters within the same row are significantly different at P<0.05.
Values are expressed as the mean±SD (n=3).
분하여 부위별로 일반성분을 포함한 이화학적인 성분을 측 정하여 비교하였다. 조단백질 및 조지방 함량은 겉잎(L1)이 높았고, 조회분 및 탄수화물 함량은 속잎(L3)이 높았다 (P<0.05). 열량은 24.5~26.5 kcal/100 g이었고 부위별로 유의적인 차이가 없었으며, 총식이섬유는 겉잎(L1)이 가장 높았다(P<0.05). 유리당은 fructose, glucose, sucrose가 확인되었으며, 속잎(L3)에서 fructose 및 glucose 함량이 높았다(P<0.05). 유기산은 citric acid, malic acid, suc- cinic acid가 검출되었으며, citric acid와 malic acid 함량은
속잎(L3)이 높았고 succinic acid는 겉잎(L1)이 높았다(P<
0.05). 총유리 아미노산의 30% 이상을 차지하는 glutamic acid 함량은 속잎(L3)에서 높았으며, γ-aminobutyric acid 의 함량은 겉잎(L1)이 가장 높았다(P<0.05). 결구배추 잎의 주요 미네랄 성분은 K, Na, Ca, Mg이며, 이 중 K의 함량이 가장 높았다. 총미네랄 함량은 겉잎(L1)이 가장 높았다 (P<0.05). 결구배추 잎은 부위에 따라 이화학적 성분 조성 이 다른 특성을 가지므로 신선편의 식재료로서 활용성이 더 욱 증대될 수 있을 것으로 생각한다.
Table 4. Mineral contents of the head-type kimchi cabbage leaves (mg/100 g, wet basis)
Minerals L11) L2 L3
Ca Co Cu Fe K Mg Mn Mo Na Zn Total
15.52±0.10a2) ND3) 0.03±0.00a 1.16±0.07a 200.02±0.74b 13.85±0.15a 0.43±0.00a
ND 33.77±0.08a 0.25±0.00c 265.03±0.68a
10.83±0.35b ND 0.01±0.00b 0.43±0.03b 200.01±0.43b 11.43±0.13c 0.11±0.01b
ND 24.63±0.04b 0.29±0.00b 247.75±0.79b
11.61±0.63b ND 0.01±0.00b 0.46±0.03b 202.87±0.36a 12.20±0.09b 0.09±0.00c
ND 21.31±0.05c 0.44±0.01a 248.98±1.08b
1)L1: outer portion, L2: mid-portion, L3: inner portion.
2)Values with different letters within the same row are signifi- cantly different at P<0.05.
3)ND: not detected.
Values are expressed as the mean±SD (n=3).
감사의 글
본 연구는 농림축산식품부・농림수산식품기술기획평가원 첨 단생산기술개발사업의 연구비 지원으로 수행되었으며 이에 감사드립니다.
REFERENCES
1. Lee KH, Kuack HS, Jung JW, Lee EJ, Heong DM, Kang KY, Chae KI, Yun SH, Jang MR, Cho SD, Kim GH. 2013.
Comparison of the quality characteristics between spring cultivars of Kimchi cabbage (Brassica rapa L. ssp. peki- nensis). Korean J Food Preserv 20: 182-190.
2. Seong JH, Park SG, Park EM, Kim HS, Kim DS, Chung HS. 2006. Contents of chemical constituents in organic Ko- rean cabbages. Korean J Food Preserv 13: 655-660.
3. Fenwick GR, Heaney RK, Mullin WJ. 1983. Glucosinolates and their breakdown products in food and food plants. Crit Rev Food Sci Nutr 18: 123-201.
4. Colditz GA, Branch LG, Lipnick RJ, Willett WC, Rosner B, Posner BM, Hennekens CH. 1985. Increased green and yellow vegetable intake and lowered cancer deaths in an elderly population. Am J Clin Nutr 41: 32-36.
5. Lee YS, Jang WS, Eui MJ, Lee SJ, Jang JJ. 1990. Inhibitory effect of Chinese cabbage extract on diethylnitrosamine-in- duced hepatic foci in Sprague-Dawley rats. J Korean Cancer Assoc 22: 355-359.
6. Ku KH, Jeong MC, Chung SK. 2013. Industrialization of salted Chinese cabbages and fresh-cut Chinese cabbage. Food Science and Industry 46(4): 2-11.
7. Ames BN, Gold LS, Willett WC. 1995. The causes and pre- vention of cancer. Proc Natl Acad Sci U S A 92: 5258-5265.
8. Hwang IW, Kim CS, Chung SK. 2011. The physicochemical qualities and antioxidant activities of apple juices marketed in Korea. Korean J Food Preserv 18: 700-705.
9. Liu RH. 2013. Dietary bioactive compounds and their health implications. J Food Sci 78: A18-A25.
10. Dasgupta N, De B. 2007. Antioxidant activity of some leafy vegetables of India: A comparative study. Food Chem 101:
471-474.
11. Seong GU, Hwang IW, Chung SK. 2016. Antioxidant ca- pacities and polyphenolics of Chinese cabbage (Brassica ra- pa L. ssp. Pekinensis) leaves. Food Chem 199: 612-618.
12. Park KW, Kim MZ. 1985. Influences of cultivar and storage period on the quality of Chinese cabbage. J Kor Soc Hort Sci 26: 299-303.
13. Kim HD, Yun SJ, Chung HD. 1994. Separation of yellow pigments in the inner leaves of Chinese cabbage and their relationship with taste. J Kor Soc Hort Sci 35: 525-533.
14. Kim JY, Lee EJ, Park SK, Choi GW, Baek NK. 2000. Phys- icochemical quality characteristics of several Chinese cab- bage (Brassica pekinensis RuPR) cultivars. Korean J Hortic Sci Technol 18: 348-352.
15. Hong E, Kim GH. 2006. Changes in vitamin U, amino acid and sugar levels in Chinese cabbage during storage. Korean J Food Preserv 13: 589-595.
16. Klieber A, Porter KL, Collins G. 2002. Harvesting at differ- ent times of day does not influence the postharvest life of Chinese cabbage. Sci Hortic 96: 1-9.
17. Seong GU, Chung HS, Chung SK. 2015. The cutting proc- ess improvement for cut kimchi cabbage quality. Korean J Food Preserv 22: 154-157.
18. Kim SS, Seong GU, Hwang HY, Jeong MC, Chung SK.
2014. The short-term storage characteristics of cut kimchi cabbages treated with Ca2+. Korean J Food Preserv 21: 157- 162.
19. Lee JS, Choi JW, Chung DS, Lim CI, Park SH, Lee YS, Lim SC, Chun CH. 2007. Cold storage, packing and salting treatments affecting the quality characteristics of winter Chinese cabbages. Korean J Food Preserv 14: 24-29.
20. Jeong ST, Kim JG, Kang EJ. 1999. Quality characteristics of winter Chinese cabbage and changes of quality during the Kimchi fermentation. Korean J Postharvest Sci Technol 6: 179-183.
21. Kim YK, Kim GH. 2003. Changes in 3-butenyl isothiocya- nate and total glucosinolates of seeds and young seedlings during growth of Korean Chinese cabbages. Korean J Food Preserv 10: 365-369.
22. Song L, Thornalley PJ. 2007. Effect of storage, processing and cooking on glucosinolate content of Brassica vegetables.
Food Chem Toxicol 45: 216-224.
23. Miean KH, Mohamed S. 2001. Flavonoid (myricetin, quer- cetin, kaempferol, luteolin, and apigenin) content of edible tropical plants. J Agric Food Chem 49: 3106-3112.
24. Chen IC, Chang HC, Yang HW, Chen GL. 2004. Evaluation of total antioxidant activity of several popular vegetables and Chinese herbs: a fast approach with ABTS/H2O2/HRP system in microplates. J Food Drug Anal 12: 29-33.
25. Harbaum B, Hubbermann EM, Wolff C, Herges R, Zhu Z, Schwarz K. 2007. Identification of flavonoids and hydrox- ycinnamic acids in pak choi varieties (Brassica campestris L. ssp. chinensis var. communis) by HPLC-ESI-MSn and NMR and their quantification by HPLC-CAD. J Agric Food Chem 55: 8251-8260.
26. AOAC. 1990. Official methods of analysis. 15th ed. Associ- ation of Official Analytical Chemists, Washington, DC, USA.
27. Prosky L, Asp NG, Schweizer TF, DeVries JW, Furda I.
1988. Determination of insoluble, soluble, and total dietary fiber in foods and food products: interlaboratory study. J Assoc Off Anal Chem 71: 1017-1023.
28. Moon KD, Kim JK, Kim JH. 1997. The compositions of fatty acid and amino acid and storage property in dried per- simmons. Korean J Post-Harvest Sci Technol Agric Prod- ucts 4: 1-10.
29. Jin TY, Oh DH, Eun JB. 2006. Change of physicochemical characteristics and functional components in the raw materi- als of saengsik, uncooked food by drying methods. Korean J Food Sci Technol 38: 188-196.
30. Park WK, Kim SH. 1991. Quantitative analysis and physical properties of dietary fiber in vegetables. J Korean Soc Food Nutr 20: 167-172.
31. Kang EJ, Jeong ST, Lim BS, Jo JS. 1999. Quality changes in winter Chinese cabbage with various storage methods.
Korean J Postharvest Sci Technol 6: 173-178.
32. Cha YS, Oh SH. 2000. Investigation of γ-aminobutyric acid Chinese cabbages and effects of the cabbage diets on lipid metabolism and liver function of rats administered with eth- anol. J Korean Soc Food Sci Nutr 29: 500-505.