Vol.33, No.9 pp. 645~651, 2009 (ISSN-1598-5725)
Design and Construction of the Cylindrical Slit Type Shore Structures
Joong Woo Lee†, Ki-Dae Nam*, Sang-Gill Park**, Sug-Moon Kim***, Seok-Jin Kang****
†Division of Civil and Environmental Engineering, Korea Maritime University, Busan 606-791, Republic. of Korea
*,**,**** Dept. of Civil and Environmental Engineering, Korea Maritime University, Busan 606-791, Republic. of Korea
*** Chief Executive Officer of Buman Construction
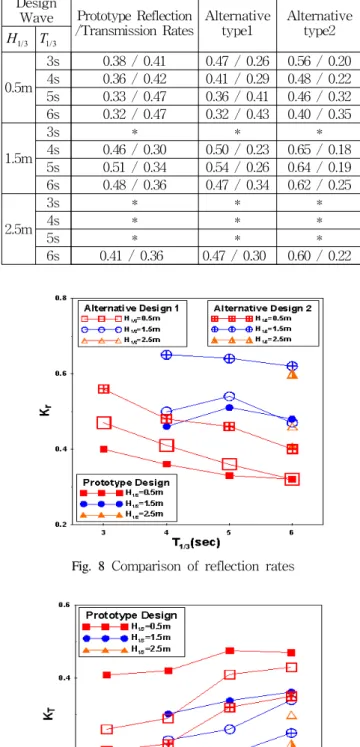
Abstract : In this study, a series of laboratory experiments were carried out to investigate the weak reflection of regular and random water waves over a train of protruded permeable shore structures. A cylindrical slit type breakwater and the alternatives are employed and compared for reflecting and transmitting capabilities of incident waves including wave forces. A series of random waves were generated by using the Bretschneider-Mitsuyasu frequency and directional spectrum. Measured spectrum of irregular waves without breakwaters is verified by comparing with those of the input waves generated. Weak reflection is occurred at the breakwater center of the peak frequency. If the row of breakwaters is fixed at three layers and the relative height of breakwater is fixed at 0.6, around 45% of incident wave energy is reflected to offshore. It is also found that the transmission of directional random waves increases as the maximum frequency parameter increases. A very good agreement is observed. Reflection coefficients of permeable submerged breakwaters are less than those of impermeable breakwaters. The upside-down L shape is recommended for a small fishery harbor mooring in terms of reflecting capability and of practical application. The final design was applied to the wharf of a small beach of Seolly, near Namhae at the southeast coast of Korea.
Key words : cylindrical slit type breakwater, directional spectrum, permeable, reflection, transmission, wave force
†Corresponding author : Joong Woo Lee, [email protected] 051)410-4461 * [email protected] 051)140-4981
** [email protected]
*** [email protected] 051)515-8050
**** [email protected]
1. Introduction
Recently, most of coastal areas are tremendously changed by reclamation and construction of coastal structures such as dikes, revetments, breakwaters, jetties, and groins, etc. These structures cause water circulation problems together with bottom and coastline changes. Extension of harbor scale established newly necessity of prolong the existing breakwaters, and thereby the extended harbor area arrived to the limit of water quality and accretion and erosion problem.
Sometimes the sand is eroded from the beaches, requiring repeated artificial nourishment. The local communities claim on these and request the government to control this matter.
Blocked breakwater construction enhances the protection from the wave attack to the coast and harbor area but constrains water circulation for those areas. When a constraint water area of small tidal motion brings a sudden destruction of natural flow environment, it becomes worse as it exceeds the limit of the harbor self purification capacity.
Also, the strong multiple reflections of waves generate problem in safe mooring of vessel because the wave heights
in this area are increased by reflection and most of wave
energies enter to the harbor basin. In recent years the
research for the construction of coastal structures for
seawater exchange has shown various shapes adopting slit
type caissons. One example for that in Korea is the wave
overtopping well type breakwater which had built in Mukho
harbor (KORDI, 2005). The seawater circulation had
promoted in the inner harbor and the water quality was
improved quite well. Design of seawater exchange
breakwater had shown the proper flux through this
breakwater caused flow inside the inner harbor, and still it
had met for the request of harbor tranquility even for
resisting the strong wave force. It was necessary to
construct the extra overtopping wave well. In this study, we
introduced a series of design for shore structures improving
the efficiency of seawater exchange together with tranquility
behind breakwater. It is investigated in terms of the
structural stability, wave transmission and reflection, and
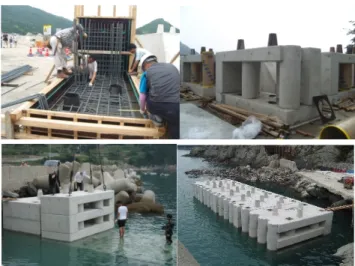
wave force by these designs and introduced the field
construction of units and installation of the units to the
planned wharf area.
2. Experimental facility
2.1 Water tank and wave generator
The tests were executed in the water tank of Korea Maritime University. The dimensions of the flume are length of 28m x height of 1m x width of 5.4m with a maximum water depth of 0.8m. The capability of wave generator in hydraulic piston form presented Table 1. A capacitance type wave gauge is attached to the wave generator paddles and used for the control of the reflective waves. Waves propagating towards the paddles are absorbed by the paddle and not re-reflected, thereby not disturbing the measurements. The wave generator is capable of generating both regular and irregular waves of any specified spectral.
Wave absorber on back side of wave generator was placed and at the wave absorber on the other tank end ripraps on end part of water tank was installed. A system for wave generator paddles is controlled by motion of oil-hydraulic cylinder, and position of wave generator plate is detected consecutively by the sensing device. An acrylic water flume in the water tank of 4000mm x 910mm x 1000mm was installed to separate the structure way with non structure way because there could be reflection from the side part of water tank due to wide width.
Table 2 Specification of wave generator Capability of wave generator Maximum significant wave
height
0.2m (at the depth of water 0.8m)
Reappearance wave length 0.2m~10m Reappearance wave period 0.5sec~2sec
2.2 Measurement device
Capacitance type wave gauge used in this hydraulic model experiment has a fast reaction rate and less error. This type is suitable for indoor scale model test and the wave height was measured at 5 locations at the same time during the tests. The wave data that measured in wave gauge is linear and measuring range is ±25 cm. It can measure the water level change very precisely within 0.5% error. Zero calibration before the experiment was done to confirm that the measured corresponds to the signal voltage. A/D converter used in this experiment is a device that converts analog signal acquired from the measurement device to digital signal, and D/A converter does similar to controlling means of wave generator, by converting digital signal to analog signal of wave control unit.
3. Conceptual block and breakwater design for model experiment
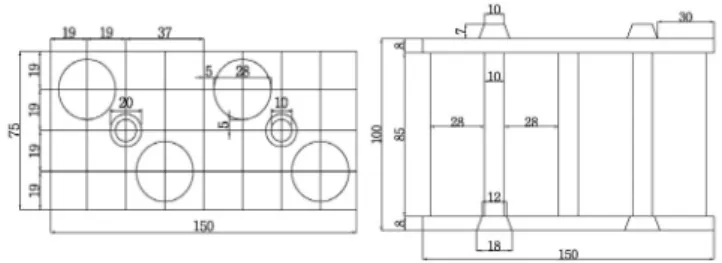
Scale model test of reduced scale of designed block unit and structures is depending on the size of water tank, actual size of structure, dimension of experiment wave, performance of wave generator, etc. The model tests were carried out with a geometrical scale of 1/25. Similarity for the model was based on the required water depth for wave gauge effectiveness and wave generator capabilities. The scale factor is the ratio between the values of prototype and model respectively. Unit blocks used in the experiment are 1:25 block of actual size. Plane and section views for designed unit blocks are shown in Fig.1. Fig.2 shows the final unit block model made.
Fig. 1 1:25 Unit block design (a: Plane view, b: Front view)
Fig. 2 1:25 Unit block design (Bird's-eye view)
4. Experimental condition and procedures
4.1 Test sections
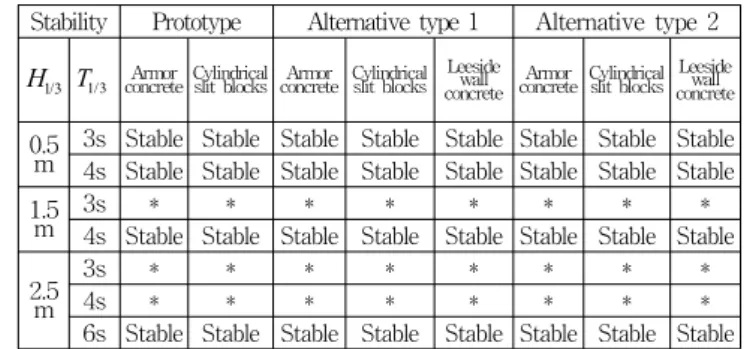
To determine the stability of the breakwaters, 3 alternative
breakwater test sections above the riprap mound were
applied on the breakwaters, considering the environmental
condition of Samcheonpo and Namhae water area, southeast
coast of Korea, at the water depth of 8m and approximately
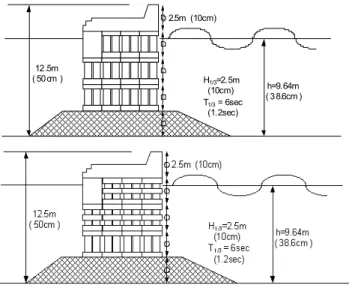
highest higher water level of 9.64m. The design wave at the
structure was 2.5m of height and 6 seconds of period. The
crest height of the structure was chosen for the dimension
limit permitting partial wave overtopping to (1.0⨯ ∼
1.25⨯ ) as in Fig.3. The alternatives of the prototype
section plan, in reply for solution of the higher transmission which causes the problem of calmness inside harbor, was adopted as in Fig.4. The so harbor top concrete block top plate and an alternative experiment doing by connecting structure go side by side and do comparative analysis each other.
H
1/ 3=2.5m (10cm) T
1/3= 6sec
(1.2sec)
h=9 .64m ( 38.6 cm ) 2.5m (10 cm)
12.5m ( 50cm )
Fig. 2 Prototype of section design
H
1/3=2.5m (10cm) T
1/3= 6sec
(1.2sec)
h=9.64m ( 38.6cm ) 2.5m (10cm)
12.5m ( 50cm )
Fig. 3 Alternatives of section design
4.2 Experimental setup
The wave heights were measured at 4 locations in Fig.
5(a) to analyze the irregular wave spectrum. Fine adjustment of the wave generator was controlled by the analysis of wave measurement at No.2 and No.3 gauges. Wave generator was adjusted as it possible for target spectrum, and this means that the irregular waves of spectrum was reached at the structure front face correctly. To yield reflection and transmission rates for the structure, 5 wave gauges were set as in Fig. 5(b). For the reflection rate, 3 wave gauges were set at the point of one wave length away and separated the incoming and reflecting waves. Waves from No.4 and No.5 wave gages were analyzed to get the wave transmission rates. Fig.6 is set up for wave forces at the structure face, such as uplift pressure and wave pressure.
1
4 3 2
1 2 3 4
5
Fig. 4 Experimental setup (a: for irregular wave spectrum, b: for reflection and transmission rates)
Fig. 5 The locations of wave pressure gauges (a: for uplift pressure, b: for wave pressure)
4.3 Test procedure and conditions
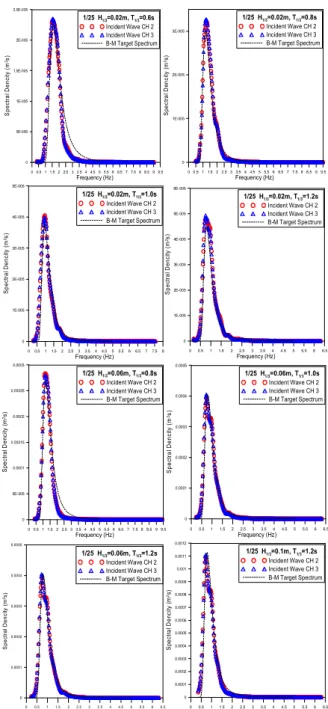
Flowchart of irregular wave generation system is appeared at Fig. 7. First, the target wave spectrum is transformed to a spectrum of wave paddle according to characteristic function of paddle operation, the component waves with irregular phase are converted to analogue signals for wave generator after passing through D/A converter. After separation of the incident and reflected waves at the face of structure, the measured incident wave spectrum is being compared to the target spectrum. If both spectra have a good agreement, then we can start the experiment. But in case of big discrepancies, it is necessary to feed back to modification of the characteristic function of paddle operation, repeatedly. For separation of incident wave with respect to reflected wave, we used the method which Goda and Suzuki (1976) had proposed to use wave records from 3 wave gauges with certain interval and adopted the modified Bretschneider-Misuyasu spectrum by Goda (1985) for incident wave as in Eq.(1).
exp (1)
where, is the wave energy density function, is the frequency, and both and are significant wave height and period, respectively. The target spectrum is
a.
b.
a. b.
Bretschneider-Mituyasu spectrum, and it was controlled so that the time series of incident wave at the structure face may conform with significant wave height of target wave, and the target spectrum of incident wave was finally derived under non-breaking wave condition. The incident wave conditions at the tide level of HWOST for the local fishery harbor was summarized at Table 2, and Fig.8 shows comparisons of target wave spectrum and incidence wave spectrum. It turned out that they were agreed well each other.
Fig. 6 Flow chart for irregular wave generation
Table 3 Design and model test wave conditions Prototype target
waves 1/25 Model waves
Remark H 1/3 T 1/3 H 1/3 T 1/3
0.5m
3s 0.02m 0.6s
* Impossible to control the wave generator, because it occurs breaking waves
4s 0.02m 0.8s
5s 0.02m 1.0s
6s 0.02m 1.2s
1.5m
3s * *
4s 0.06m 0.8s
5s 0.06m 1.0s
6s 0.06m 1.2s
2.5m
3s * *
4s * *
5s * *
6s 0.10m 1.2s
0 0.5 1 1.5 2 2.5 3 3.5 4 4.5 5 5.5 6 6.5 7 7.5 8 8.5 9 9.5
Frequency (Hz)
05E-006 1E-005 1.5E-005 2E-005 2.5E-005
S pec tr al D enc ity ( m
2s)
1/25 H
1/3=0.02m, T
1/3=0.6s Incident Wave CH 2 Incident Wave CH 3 B-M Target Spectrum
0 0.5 1 1.5 2 2.5 3 3.5 4 4.5 5 5.5 6 6.5 7 7.5 8 8.5 9 9.5
Frequency (Hz)
0 1E-005 2E-005 3E-005
S pec tr al D enc ity ( m
2s)
1/25 H
1/3=0.02m, T
1/3=0.8s Incident Wave CH 2 Incident Wave CH 3 B-M Target Spectrum
00.511.522.533.5 44.555.566.577.58
Frequency (Hz)
01E-005 2E-005 3E-005 4E-005 5E-005
S pec tr al D enc ity ( m
2s)
1/25 H
1/3=0.02m, T
1/3=1.0s Incident Wave CH 2 Incident Wave CH 3 B-M Target Spectrum
0 0.5 1 1.5 2 2.5 3 3.5 4 4.5 5 5.5 6 6.5
Frequency (Hz)
01E-005 2E-005 3E-005 4E-005 5E-005 6E-005
S p ec tr al D e nc ity ( m
2s)
1/25 H
1/3=0.02m, T
1/3=1.2s Incident Wave CH 2 Incident Wave CH 3 B-M Target Spectrum
0 0.5 1 1.5 2 2.5 3 3.5 4 4.5 5 5.5 6 6.5 7 7.5 8 8.5 9 9.5
Frequency (Hz)
0 5E-005 0.0001 0.00015 0.0002 0.00025 0.0003
S pe ct ral D e nc ity ( m
2s)
1/25 H
1/3=0.06m, T
1/3=0.8s Incident Wave CH 2 Incident Wave CH 3 B-M Target Spectrum
0 0.5 1 1.5 2 2.5 3 3.5 4 4.5 5 5.5 6 6.5
Frequency (Hz)
00.0001 0.0002 0.0003 0.0004 0.0005
S pec tr al D e nc ity ( m
2s)
1/25 H
1/3=0.06m, T
1/3=1.0s Incident Wave CH 2 Incident Wave CH 3 B-M Target Spectrum
0 0.5 1 1.5 2 2.5 3 3.5 4 4.5 5 5.5 6 6.5
Frequency (Hz) 0
0.0001 0.0002 0.0003 0.0004 0.0005
Spectral Dencity (m2s)
1/25 H
1/3=0.06m, T
1/3=1.2s Incident Wave CH 2 Incident Wave CH 3 B-M Target Spectrum
0 0.5 1 1.5 2 2.5 3 3.5 4 4.5 5 5.5 6 6.5
Frequency (Hz)
00.0001 0.0002 0.0003 0.0004 0.0005 0.0006 0.0007 0.0008 0.0009 0.001 0.0011 0.0012