논 문
* 서울대학교 농업생명과학대학 조교수 ([email protected])
** 서울대학교 농업생명과학대학 교수 ([email protected])
키워드 : 하천유출량, 관개회귀수량, 농업유역
농업유역의 일별 하천유출량 추정
Prediction of Daily Streamflow on Agricultural Watersheds
Abstract
The objective of this study was to develop a hydrologic simulation model to predict daily streamflow from a small agricultural watershed considering irrigation return flow. The proposed IREFLOW(Irrigation REturn FLOW) model consists of hillslope runoff model, irrigation scheme drainage model, and irrigation return flow model, and simulates daily streamflow from an irrigated watershed. Two small watersheds were selected for monitoring of hydrological components and evaluating the model application. The relative error (RE) between observed and simulated daily streamflow were 2.9% and 6.4%, respectively, on two small agricultural watersheds (Baran and Gicheon) for the calibration period. The values of RE in daily streamflow for the validation period were 6.0% for the Baran watershed, and 2.8% for the Gicheon watershed.
Ⅰ. 서 론
Lee, Haeng Woo ∙
Im, Sang JunㆍPark, Seung Woo∙ Park, Kwang Soo 박 승 우**박 광 수****
임 상 준*
이 행 우*
한국관개배수 제13권 제2호
KCID J. VOL. 13, No.2 (2006. 12) pp.86-94
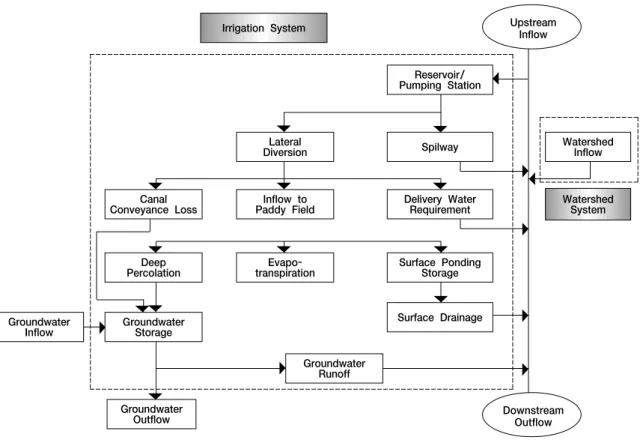
Ⅱ. IREFLOW 모형의 개발
Fig. 1. Flow chart of IREFLOW model
Irrigation System
Watershed System Upstream
Inflow
Downstream Outflow Reservoir/
Pumping Station
Spilway Watershed
Inflow Lateral
Diversion
Inflow to Paddy Field
Evapo- transpiration Canal
Conveyance Loss
PercolationDeep
Groundwater Storage Groundwater
Inflow
Groundwater Outflow
Delivery Water Requirement
Surface Ponding Storage
Surface Drainage
Groundwater Runoff
ThruFl RN
ThruFl
RN
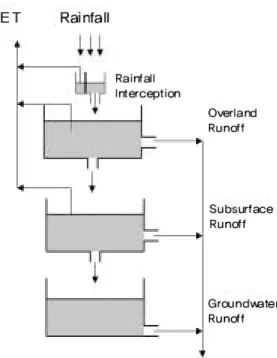
Fig. 2. Conceptual framework of hillslope runoff model
E E RN
E
E
SatuArea
SatuArea
SATUMX SWT
SatuArea
SurFlow
tSatuArea ThruFl
tSurFlow
Perc
t=
Perc
tPERCMX
SWT
SWT
t=SWT
t-1ThruFl
tSurFlow
tPerc
tUnSatuFlow
t= CR (UWT
t- H
u) DnFlow
t= CP UWT
tUnSatuFlow
DnFlow UWT
H
uGWFlow
t= CF (GWT
t)
ExSWT
t-10
SWT
t-10.5 SATUMX
SWT
t-10.5 SATUMX PERCMX
PERCMX 2SWT
t-1SATUMX
2(SATUMX-SWI)
SATUMX SWI SATUMX
SWI SATUMX
GWFlow CF Ex
GWT
GWT
t= GWT
t-1+ DnFlow
t- GnFlow
tDR
t= ST
tCH ST
tCH DR
t= 0.0, ST
tCH
DR
tST
t
CH
ST
t= ST
t-1IR
tRN
tINF
tET
tIR INF
ET
QRF DWR
OF
QRF
t=OF
t+ DWR
tDWR OF
OF
DRF
t= GWFIR
tGWFNO
tDRF GWFIR
GWFNO
RETFLO
t= QRF
t+ DRF
tⅢ. IREFLOW모형의 적용
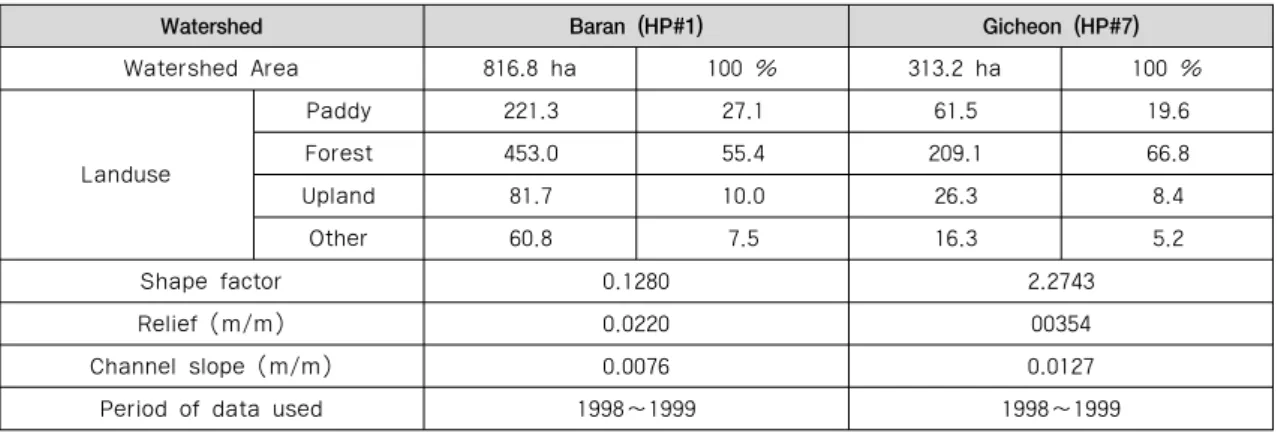
Table 1. Geomorphological characteristics and landuse of project areas and data used
Watershed Baran (HP#1) Gicheon (HP#7)
Shape factor 0.1280 2.2743
Relief (m/m) 0.0220 00354
Channel slope (m/m) 0.0076 0.0127
Period of data used 1998~1999 1998~1999
Watershed Area 816.8 ha 100 % 313.2 ha 100 %
Landuse
Paddy 221.3 27.1 61.5 19.6
Forest 453.0 55.4 209.1 66.8
Upland 81.7 10.0 26.3 8.4
Other 60.8 7.5 16.3 5.2
Table 2. Estimation of irrigation return flow
Watershed Irrigation water (mm)
Irrigation return flow (mm) Return flow rate
Quick Delayed Total (%)
Baran (HP#1)
1,004 1998
1999 1998 1999
105.4 229.6 335.0 33.3
1,143 109.7 258.4 368.1 32.2
Gicheon (HP#7)
918 197.2 239.9 437.1 47.6
1,085 165.2 253.4 418.6 38.5
Fig. 3. Monitoring networks at the Baran watershed Fig. 4. Monitoring networks at the Gicheon watershed
Table 3. Results of daily streamflow simulation for the calibration period
Watershed Simulation period
Rainfall (mm)
Streamflow (mm)
Observed Simulated Relative error(%)
HP#1 ’98. 4~’98. 9 1,189.9 1,057.5 1,088.1 2.9
HP#7 ’98. 4~’98. 12 1,110.5 1,261.3 1,180.3 6.4
Ⅳ. 결 론
Table 4. Results of daily streamflow simulation for the validation period
Watershed Simulation period
Rainfall (mm)
Streamflow (mm)
Observed Simulated Relative error(%)
HP#1 ’99. 3~’99. 7 917.0 889.3 836.2 6.0
HP#7 ’99. 1~’99. 10 1,460.0 1,396.8 1,356.9 2.8
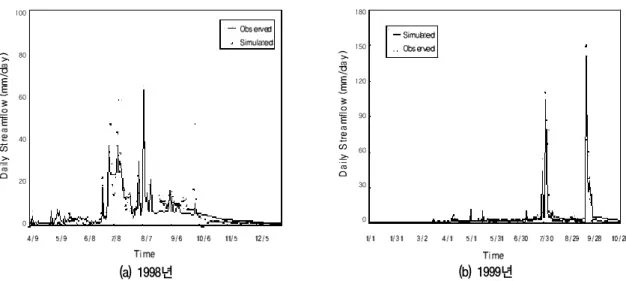
Fig. 5. Observed and simulated streamflows on a small watershed, HP#7
(a) 1998년 (b) 1999년
1. 김태철, 노재경, 박승기, 1992, 관개저수지의 이수 관리 방법, 한국농공학회지 34(1), pp.34-40.
2. 김현영, 1988, 관개용 저수지의 일별 유입량과 방 류량의 모의발생, 서울대학교 박사학위논문.
3. 안세영, 이근후, 1990, 제대천 유역 답지대의 물수 지, 한국농공학회지 32(3), pp.56-66.
4. Anderson, M. G. and Burt, T. P., 1990, Process studies in hillslope hydrology, John Wiley & Sons, p.539.
5. Akira, K., Kawagoshi, N., and Sasanabe, S., 1995, Characteristics of water management and outflow load from a paddy field in a return flow irrigation area, Journal of JSIDRE, 63(2), pp.179-184.
6. Chung, S. O., 1998, A study on the return flow of irrigation water in paddy fields, Journal of KSAE, 40, pp.1-6.
7. Ito, Y., Shiraishi, H., and Oonishi, R., 1980, Numerical estimation of return flow in river basin, JARQ, 14(1), pp.24-30.
100
80
60
40
20
0
180
150
120
90
60
30
0