https://doi.org/10.5229/JKES.2018.21.1.12
− 12 −
eISSN 2288-9000
Effects of Aluminum and Silicon as Additive Materials for the Zinc Anode in Zn-Air Batteries
Yong-Seok Lee and Kwang-Sun Ryu*
Department of Chemistry, University of Ulsan, Ulsan 680-749, Korea
(Received January 18, 2018 : Revised February 12, 2018 : Accepted February 13, 2018)
Abstract : To solve low cycle efficiency of the zinc anode in Zn-air batteries by corrosion, this study examined the effects of Al as a cathodic protection additive to Zn. The Al-mixed Zn anodes were produced by mixing Zn and Al powder (1, 2, and 3 wt. %). To compare the effects of the Al additive, Si was selected under the same conditions. The morphology and elemental composition of the additives in the Zn were characterized by scanning electron microscopy, energy dispersive X-ray spectroscopy, and inductively coupled plasma – mass spec- trometry. The anti-corrosion effects of the Al and Si-mixed Zn anodes were examined by linear polarization. Cyclic voltammetry and charge-discharge tests were conducted to evaluate the electrochemical performance of the Al and Si-mixed Zn anodes. As a result, the Al-mixed Zn anodes showed highest corrosion resistance and cycling performance. Among these, the 2 wt.%
Al-mixed Zn anodes exhibited best electrochemical performance.
Keywords : Zinc-air battery, Zinc anode, Aluminum, Silicon, Corrosion, Reversibility
1. Introduction
Zn-air batteries are promising candidates for sec- ondary alkaline batteries as a replacement for lith- ium-ion batteries owing to their low cost and high specific energy density of 1086 Wh kg-1.1) On the other hand, the batteries have not been commercial- ized as secondary batteries because of their poor reversibility and charge-discharge performance. One of the reasons for the low cycling performance the Zn anode contributes to the poor charge-discharge properties of Zn-air cell due to dendrite formation, corrosion reaction, and hydrogen evolution reaction (HER). In particular, zinc corrodes spontaneously due to the reaction between zinc and water, which leads to the HER. The side reaction consumes the alkaline electrolyte, resulting in a decrease in the efficiency of zinc and finally the poor cycle life- time of Zn-air batteries.1,2)
In an attempt to solve this problem, many studies have been examined organic, inorganic, and surfac-
tant additives or alloys with other metals.3-9) C. W.
Lee et al. studied a Zn-Ni-In alloy anode due to the increasing hydrogen overpotential and reduction of the HER.8) C. J. Lan et al. produced a Zn-Al alloy anode. Because aluminum has a more nega- tive redox potential than zinc, the OCV values of the Zn-Al anode have more negative potentials than the pure Zn electrode and the alloy anode showed high discharge capacities in the Zn-air cell system.9) In addition, aluminum is often used as a cathodic protection material suppressing zinc corrosion because it has a more negative oxidation potential than zinc.10) Therefore, aluminum reacts instead of zinc at the potential area of zinc corrosion and suppresses zinc corrosion and the HER.
The overall aim of this study was to suppress the corrosion reaction of zinc and improve the elec- trochemical performance of the zinc anode in Zn- air batteries using Al as an additive material. The Al-added Zn anode was prepared by mixing Al and Zn powders. In addition, for comparison with the effects of Al additives, Si was selected as the com- parison target because it also has a more negative potential than zinc but lower than aluminum [11].
*E-mail: [email protected]
The Al and Si mixed Zn composites were pre- pared by grinding Zn powder (99%, Daejung chem- ical) and Al (99%, Daejung chemical) or Si powder (99.9%, Alfa Aesar) with 1, 2, and 3 wt. % of Zn powder. In the half-cell test, for the fabrication of zinc-based electrodes, the composite powders were mixed with 15 wt.% polytetrafluoroethylene (PTFE, 60 wt. % in D.I H2O, Sigma-Aldrich).
In the full cell test, zinc gel anodes were fabri- cated. The anodes were composed of 65.6 wt. % 6M KOH (93%, Daejung chemical), 0.016 wt. % poly- acrylic acid (PAA, Sigma-Aldrich) and 32.8 wt. % Zn powder with the Al and Si powders. For gelation, 6M KOH as the electrolyte was mixed with PAA as the gelling agent for 2h. After gelation, the powders were added and mixed with stirring for 10 min at room temperature. The contents of the Al and Si were 1, 2, and 3 wt. % of the zinc powders.
Surface morphology of the bare Zn, Al or Si added Zn powders were examined by scanning electron microscopy (SEM, Carl Zeiss Supra 40).
Energy dispersive spectroscopy (EDS, Carl Zeiss Supra 40) and inductively coupled plasma - atomic emission spectrometry (ICP-AES, Thermo Electron iCAP6500) were performed to confirm the distribu- tion and contents of the Al and Si powders in the Zn powders.
For the linear polarization and cyclic voltammetry test, the conventional three-electrode cell was adopted with a platinum wire as a counter elec- trode and a standard calomel electrode (SCE) as the reference electrode. The working electrode was pure zinc, Al-, and Si-added zinc electrodes, and 6 M KOH was used as the alkali electrolyte. Linear polarization was conducted to measure the hydrogen
as the separator. The air cells were charged and discharged at an applied current density of 65mA/g and a cut-off time of 30 min using a battery tester (Series 2000 battery tester, Marco) at room tem- perature.
3. Results and Discussion
3.1. Characterization of the Al- or Si-added Zn powder
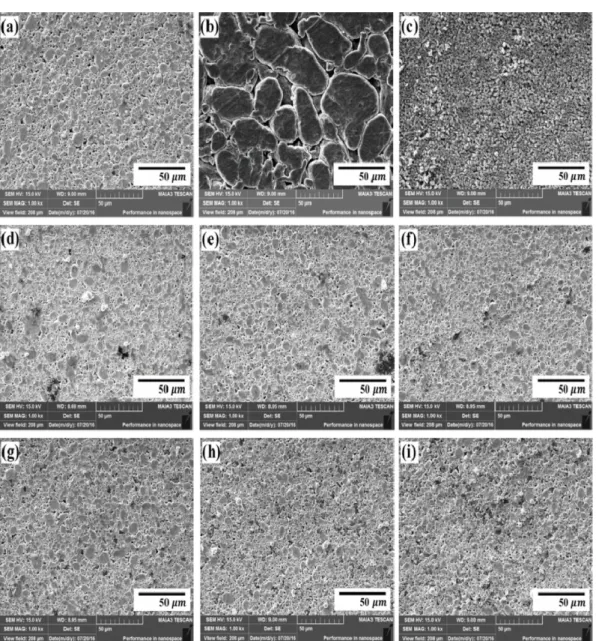
Fig. 1 shows SEM images of (a) pure Zn, (b) pure Al, (c) pure Si particles, (d)-(f) 1, 2, and 3 wt. % Al-added Zn particles, and (g)-(i) 1, 2, and 3 wt. % Si-added Zn particles. The Al particles had a larger size than the Zn particles, whereas the Si particles had a smaller size than the Zn particles.
As shown in Fig. (d)-(f), the Al particles appeared to be included in the Zn particles. The black color region in SEM images (d)-(f) are Al particles. The Si particles were not observed because of their small particle size.
SEM-EDS analysis was conducted to compare the dispersion of Al and Si particles. The mapping images in Fig. 2 (a)-(c) and (d)-(e) show the dis- persion of Al and Si particles (Red color is Zn particles, green color is Al particles in (a)-(c), and blue color is Si particles). According to the increas- ing of Al and Si content, many added particles were observed in the images. Si particles were more dispersed than Al due to the difference in particle size. ICP-MS was conducted to determine the content of Al and Si accurately in the Zn pow- der matrix. The analyzed content of Al and Si is listed in Table 1. The content of Al in the 1, 2, and 3 wt. % Al-mixed Zn was determined to be
1.1, 2, and 3%, which is in good agreement with the expected value. In the case of Si, the content was 1.4, 2.3, and 3.0% respectively, which is slightly different from that observed with Al.
3.2. Electrochemical analysis
Linear polarization was performed to assess the effects of Al and Si as anti-corrosion additives. The
Zn electrodes were tested at -2.0 V versus the SCE reference electrode. Fig. 3 (a) and (b) show linear polarization curves of the Al and Si-added Zn elec- trode with various contents. The corrosion current and corrosion resistance were calculated using the following equation [12].
R Ω( ) ΔIcorr (1) Ecorr ---
=
Fig. 1. FE-SEM images of (a) pure Zn particles, (b) pure Al particles, (c) Pure Si particles, (d)-(f) 1, 2, and 3 wt. % Al- mixed Zn particles, (g)-(i) 1, 2, and 3 wt. % Si-mixed Zn particles.
where R is the corrosion resistance, and ΔIcorr and Ecorr are the corrosion current and corrosion potential (-2.0 V) applied to this test, respectively. We have
observed a small bump at the initial state of the curve of Al-mixed Zn electrodes. This may be due to the high instantaneous current of the electrodes by higher Fig. 2. EDS mapping images of (a)-(c) 1, 2, and 3 wt. % Al-mixed Zn particles, (d)-(f) 1, 2, and 3 wt. % Si mixed Zn particles.
Table 1. Al and Si content in Zn powders by ICP-AES analysis.
Sample Al content (%) Sample Si content (%)
1 wt. % Al 1.1 1 wt. % Si 1.4
2 wt. % Al 2.0 2 wt. % Si 2.3
3 wt. % Al 3.0 3 wt. % Si 3.0
electronical conductivity than Zn and Si.
Table 2 lists the calculated results. At all Al and Si contents, the corrosion resistance was reduced except for 1 wt. % Si. This means that Al and Si react with the alkaline electrolyte (H2O) at the potential area of the corrosion reaction instead of Zn. Among them, the Al-added Zn electrode showed lower corrosion resistance than the Si-added electrode. This may be because the oxidation poten- tial of Al is closer to the HER potential of Zn than Si. In terms of content, the 2 wt. % Al- and Si-added Zn electrodes exhibited the highest corro- sion resistance.
3.3. Cyclic voltammetry
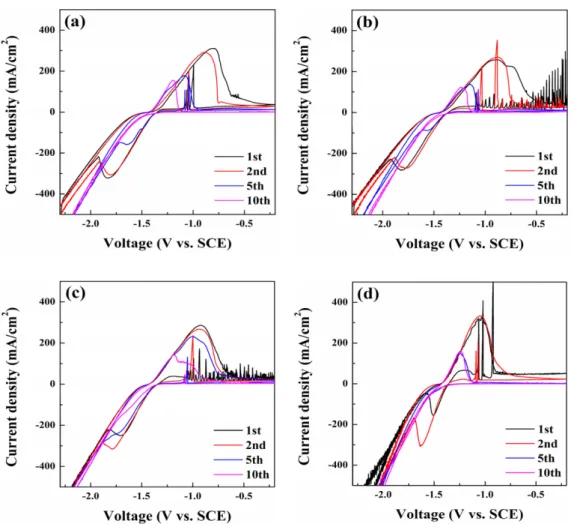
Cyclic voltammetry was conducted to evaluate the electrochemical properties of the Al- and Si- added Zn electrodes from -2.3 V to -0.2 V versus the SCE in 6M KOH at a scan rate 1mV/s. Fig. 4 shows the cyclic voltammograms of the (a) pure
zinc and (b)-(d) Al-mixed Zn anode with various contents. To evaluate the electrochemical proper- ties, the polarization between the anodic and cathodic current peak was calculated first. The peak separation, meaning polarization, was taken as an estimate of the reversibility of the oxidation and reduction reactions.13,14) Table 3 lists the calculated polarization. Compared to the pure Zn and Al- mixed Zn anodes, the polarization decreased except for the 1 wt. % Al-mixed Zn anode. In particular, the 3 wt. % Al-mixed Zn anode showed the small- est peak separation (691 mV). Secondly, the anodic and cathodic peak areas were considered to esti- mate the cycling efficiency. Because the peak area in the cyclic voltammograms means the charge and capacities, the peak area of the anodic and cathodic indicates the efficiency of the oxidation and reduc- tion reaction.3) The 3 wt. % Al-mixed Zn anode exhibited a larger oxidation area than the pure Zn anode at the 1st anodic reaction. On the other hand, Fig. 3. Linear polarization curves of (a) pure Zn and Al-mixed Zn anodes and (b) pure Zn and Si-mixed Zn anodes.
Table 2. Corrosion resistance from the linear polarization curve.
Initial current (mA/cm2) Final current (mA/cm2) ΔIcorr (mA/cm2) Rp (Ω)
Zn bare 475 253 222 9.01
Al 1 wt. % 408 292 115 17.4
Al 2 wt. % 526 423 103 19.4
Al 3 wt. % 504 376 128 15.6
Si 1 wt. % Si 2 wt. % Si 3 wt. %
537397 473
288244 276
249153 197
8.0313.1 10.2
the lowest oxidation and reduction peak area was obtained from the 5th ~ 10th cycle. This means that the reversibility of the 3 wt. % Al mixed Zn anode is lower than that of the pure Zn anode. The Al reacts with H2O to produce H2 bubbles that hinder the diffusion of Zn2+ and OH- ions. In contrast, the 1 wt. % and 2 wt. % Al mixed Zn anodes showed
higher oxidation and reduction peak areas from the 1st ~ 10th cycle. Among them, the 2 wt. % Al- mixed Zn anode exhibited a reduction peak area at the 10th cycle. This explains why the 2 wt. % Al- mixed Zn anode has the highest cycling efficiency.
According to the polarization and cycling efficiency tests, the 2 wt. % Al-mixed anode showed the high- Fig. 4. Cyclic voltammograms of (b) pure Zn anode, (b) 1 wt. %, (c) 2 wt. %, and (d) 3 wt. % Al-mixed Zn anodes.
Table 3. Polarization between anodic and cathodic reaction.
Eanodic (mV) Ecathodic (mV) ΔEa,c (mV)
Zn bare -813 -1829 945
Al 1 wt. % -733 -1942 1209
Al 2 wt. % -1046 -1746 700
Al 3 wt. % -1023 -1714 691
Si 1 wt. % Si 2 wt. % Si 3 wt. %
-892-934 -1023
-1821 -1712 -1511
929778 448
est reversibility.
Fig. 5 shows cyclic voltammograms of the (a) pure zinc and (b)-(d) Si-mixed Zn anode with vari- ous contents. The Si-mixed Zn anode showed simi- lar peak separation to the Al-mixed Zn anodes. On the other hand, the oxidation and reduction peak areas were not increased. In addition, the reduction peak area of the 3 wt. % Si-mixed Zn anode was not observed. This means that the cycling efficiency of the anode was not improved. This may be because the oxidation potential of Al is closer to the HER potential of Zn than Si. Therefore, the Si additives have a lesser effect than the Al additive.
When the oxidation and reduction peak areas from the 1st to 10th cycles were examined, the 2 wt. %
Si-mixed anode showed improved cycling effi- ciency compared to the pure Zn anode.
3.4. Cycling performance
A charge-discharge Zn-air cell test was conducted to evaluate the cycling durability of the Al- and Si- mixed Zn anode at a current density of 65 mA/g and a cut-off time of 30 min. Fig. 6 shows the charge-discharge curves of (a) bare Zn, (b)-(e) Al- mixed Zn anode with various contents. The end condition of the cycling tests was set when the voltage of the air cells moved off the working voltage area of the Zn-air cell (0 V to 2.3 V). The pure Zn electrode was examined for 15 hours while the Al-mixed Zn electrodes were examined for 16 Fig. 5. Cyclic voltammograms of (b) pure Zn anode, (b) 1 wt. %, (c) 2 wt. %, and (d) 3 wt. % Si-mixed Zn anodes.
Fig. 6. Charge-discharge tests (a) pure Zn anode, (b) 1 wt. %, (c) 2 wt. %, and (d) 3 wt. % Al-mixed Zn anodes.
Fig. 7. Charge-discharge tests (a) pure Zn anode, (b) 1 wt. %, (c) 2 wt. %, and (d) 3 wt. % Si-mixed Zn anode.
hours (1 wt. %), 21 hours (2 wt. %), and 17 hours (3 wt. %). This corresponds to the results of linear polarization and cyclic voltammograms. Because Al reacts with H2O at the potential area of the corro- sion reaction of Zn, the HER by Zn is suppressed and the efficiency of the Zn anode is increased. As a result, the reversibility and cycling durability of the Zn anodes were improved. Unlike the Al-mixed Zn anodes, the Si-mixed Zn anodes showed a lower reducibility and cycling durability than the pure Zn electrode except for the 2 wt. % Si-mixed anode (Fig. 7). Only the anode mixed with 2 wt. % Si was examined by 16 times (vs. 15 times of pure Zn). On the other hand, the performance of 2 wt. % Si was different from that of pure Zn. In addition, the 1 and 3 wt. % Si-mixed anodes showed a poor cycle lifetime. It may be related to a side reaction, which was observed as sharp peaks in the cyclic voltammogram at 1 cycle.
4. Conclusion
Al or Si was adapted as anti-corrosion additives for the Zn electrode in Zn-air batteries. The materi- als were mixed with Zn (1, 2, and 3 wt. %). SEM confirmed the morphologies of the Zn, Al, and Si powder. EDS mapping and ICP-AES were con- ducted to examine the dispersion of Al or Si in the Zn matrix. Linear polarization showed that the Al or Si-mixed Zn anodes had higher corrosion resis- tance than the pure Zn anode. Cyclic voltammetry and the charge-discharge cyclic tests showed that the reversibility and efficiency of the Zn anode were improved in the systems of the half cell and Zn-air full cell. A comparison of Al and Si revealed the Al-mixed Zn electrodes to have a bet- ter anti-corrosion effect and electrochemical perfor-
mance than the Si-mixed the electrodes due to more negative oxidation potential of Al than that of Si. Among the Al-mixed electrodes, the 2 wt. % Al-mixed electrodes showed the longest cycle life- times.
Acknowledgement
This study was supported by a National Research Foundation of Korea (NRF) grant funded by the Korean Government (MEST) (NO. 2012-M1A2A2).
References
1. Y. Li, H. Dai. Chem Soc Rev., 43, 5257-5275 (2014).
2. G. Toussaint, P. Stevens, L. Akrour, R. Rouget, F. Four- geot. J. Electrochem. Soc., 28, 25-34 (2010).
3. J. Vatsalarani, S. Geetha, D. C. Trivedi, P. C. Warrier. J.
Power Sources, 158, 1484-1489 (2006).
4. Y. D. Cho, G. T. K. Fey. J. Power Sources, 184, 610-616 (2008).
5. J. Huang, Z. Yang, B. Yang, R. Wang, T. Wang. J. Power Sources, 271, 143-151 (2014).
6. C. W. Lee, K. Sathiyanarayanan, S. W. Eom, H. S. Kim, M. S. Yun. J. Power Sources, 160, 1436-1441 (2006).
7. J. Dobryszycki, S. Biallozor. Corrosion Science, 43, 1309-1319 (2001).
8. C. W. Lee, K. Sathiyanarayanan, S. W. Eom, H. S. Kim, M. S. Yun. J. Power Sources, 159, 1474-1477 (2006).
9. C. J. Lan, T. S. Chin, P. H. Lin, T. P. Perng. J. New Mat.
Electrochem. Systems, 9, 27-32 (2006).
10. T. Kaewmaneekul, G. Lothongkum. Corrosion Science, 66, 67-77 (2013).
11. L. David R., ed. CRC Handbook of Chemistry and Phys- ics. 87th ed. Boca Raton (FL): CRC Press, p. 2608.
(2006)
12. Y. Ein-Eli, M. Auinat, D. Starosvetsky. J. Power sources, 114, 330-337 (2003).
13. L. Bing, Y. Huatang, Z. Yunshi, Z. Zuoxiang, S. Deying, J. Power Sources, 79, 277-280 (1999).
14. Dennis A. Corrigan, Richard M. Bendert, J. Electrochem.
Soc., 136, 723-727 (1989).