총설
처리기술에 근거한 산업폐수 배출허용기준 국내 적용성 연구(Ⅱ) : 산업폐수 위해성 지표를 이용한 오염부하 기여도 분석
김경진ᆞ김원기*ᆞ정상구*ᆞ정진영**ᆞ김재훈***ᆞ김상훈***ᆞ염익태†
성균관대학교 사회환경시스템공학과
*무배출형환경설비지원센터
**영남대학교 환경공학과
***국립환경과학원
Assessment of Technology Based Industrial Wastewater Effluent Limitation and Standards for the Application of Domestic Industries (II)
: Analysis Pollution Loads Contribution by Risk Assessment Indicator in Industrial Wastewater
Kyeongjin Kim⋅Wongi Kim*⋅Sanggu Jung*⋅Jinyoung Jung**⋅Jaehun Kim***⋅Sanghun Kim***⋅Icktae Yeom†
Department of Civil & Environmental Engineering, Sungkyunkwan University
*Center for zero emission technology, Sungkyunkwan University
**Department of Environmental Engineering, Yeungnam University
***National Institute of Environmental Research
(Received 15 December 2009, Revised 26 February 2010, Accepted 2 March 2010)
Abstract
Introduction of Technology-Based Effluent Limitations (TBELs) concepts into Korea requires extensive and through analyses on the expected pollutants reduction effects and the cost factor for the industry side. In addition, the TEBLs should be optimized for the regulatory environments of Korea and be applied in a progressive manner to minimize the undesirable effects. It is also necessary to assess the contribution of each industrial categories’s to the pollution of natural water bodies to find the priority of TEBLs application. For these purposes, the pollution loads of various industrial categories were analyzed using risk assessment indicator based on Toxic Weighting Factors (TWFs). First, the TWFs were calculated for the pollutants regulated using the method adopted by USEPA. And the effluent characteristics of the eighty two categories of industry in Korea were investigated. Although the analytical data on the wastewater from different industrial categories are relatively limited, the results from two previous studies were used. The first study, conducted by the National Institute of Environmental Research in 2001~2004, investigated the wastewater characteristics from 255 industrial sources covering the major 20 industrial categories. The second study includes more recent analytical data for the wastewater from 500 industrial sources , covering all the 82 industrial categories. In the result of the pollution loads analyses, the category of ‘Synthetic and Chemical manufacture’ was found to show the highest raw pollution load. On the other hand the category of ‘Ion & Steel manufacture’
was found to show the highest effluent pollution loads, which can be considered as the real impacts on natural water streams.
The top five categories occupied 62.2% of the total effluent pollution loads. Through the analyses, the relative importances of each industrial categories and the priorities of TEBL-based pollution reduction were determined.
keywords : Industrial categories, Industrial wastewater, Pollution load assessment, Technology-Based Effluent Limitation (TBELs), Toxic Weighting factors (TWFs)
1. 서 론
1)국내에서 사용하고 있는 화학물질은 40,731종에 이르며 매년 400여종이 새로운 화학물질들이 국내로 들어오고 있 다. 수질유해물질 중 휘발성 유기물질, 유기용제, 다환 방
†To whom correspondence should be addressed.
향족 탄화수소 등 합성유기화합물과 중금속 등에 의한 수 질오염은 인간의 건강은 물론 수생태계에도 큰 영향을 미 칠 수 있기 때문에 선진국과 마찬가지로 국내에서도 수질 유해물질들의 유해성을 중심으로 산업폐수 관리체계를 강 화하고 있는 추세이다. 현재 국내 폐수 배출시설은 45,163 개소(2007년 기준)가 등록되어 있으며, 이들 배출시설들은 82개 업종(환경부, 「수질 및 수생태계 보전을 관한 법률, 시행규칙」 별표 4)으로 분류하고 있다. 미국은 산업폐수 배
출특성에 따라 56개 업종, 450개 세분류로 구분하고, 업종 별 세분류별로 배출 및 처리특성을 고려한 기술근거 배출 허용기준(Technology-Based Effluents Limitations, TBELs) 가이드라인을 제시하고 있다(USEPA, 2008). 국내의 경우 최근 기존 배출허용기준 적용의 문제점을 보완하고 합리적 산업폐수 관리차원에서 TBELs 제도 도입을 추진하고 있으 나 미국의 경우와 TBELs 제도 도입배경 및 목적이 다르므 로 국내 상황을 고려하여 제도 도입을 추진해야 할 것이다.
미국의 경우 TBELs은 NPDES(National Pollutant Discharge Elimination system)에 따라 인허가 시 배출시설별로 배출 특성과 배출수계에 따른 개별 배출허용기준을 설정하기 위한 가이드라인으로 활용되고 있으나 국내의 경우 수질 근거 배출허용기준을 일괄적용 하고 있다. 또한 준비과정 에서도 미국 EPA의 경우 전 업종에 대해 20~30년 동안 업종별로 조사, 연구과정을 통해 단계적으로 도입하였으며 지속적인 개정작업을 수행하고 있는 상황이다(국립환경과 학원, 2008). 따라서 국내의 경우 전 업종에 대한 전면적 인 도입보다는 폐수 발생량이 많은 업종들, 독성오염물질 배출량이 많은 업종들을 대상으로 우선적으로 TBELs를 적용하는 것이 합리적이다. 이를 위하여 업종별, 규모별 오염부하 기여도를 산정하고 우선순위를 정해 단계적으로 TBELs를 수립하는 것이 효과적이라 판단된다.
미국 EPA는 격년으로 업종별 산업폐수 배출특성분석을 통하여 인체 및 수생태계 위해성을 반영한 업종별 배출부 하 기여도를 산정하고, 대상 업종들을 선정하여 TBELs 기 준들을 보완하는 작업을 진행하고 있다(국립환경과학원, 2009). 국내의 경우도 산업폐수 업종별 배출부하 기여도 분석을 통해 업종별 배출특성을 파악하고 우선순위를 거 쳐 단계적인 TBELs 도입을 추진해야 할 것으로 판단된다.
업종별 발생폐수의 위해성 지표를 이용한 오염부하 기여 도분석 연구는 1) 위해성 지표인 수질오염물질별 독성물질 가중치 인자(Toxic Weighting factors, TWFs)산정, 2) 기존 업종별 배출업소 조사자료 분석을 통한 배출특성 파악, 3) 위해성 지표를 이용한 업종별 오염부하 산정을 통한 기여 도 분석으로 진행하였다.
TWFs는 아직 국내 위해성 연구자료가 충분하지 않기 때 문에 미국 EPA 산정방식과 National Recommended Water Quality Criteria(USEPA, 2009a)을 이용하여 산정하였으며, 기여도 분석에 사용된 업종별 조사자료들은 국립환경과학 원에서 수행하였던 ‘폐수처리공정별 BAT 평가 및 원단위 산정(환경부, 2001~2004)’ 연구에서 조사된 20개 업종 255 여개 배출시설 수질자료와 한국과학기술연구원 및 성균관 대학교에서 수행하였던 ‘산업폐수 관리체계 개선방안 연구 (환경부, 2005~2008)’에서 조사된 82개 업종 500여개 배출 시설 자료들을 활용하였다. 대상 자료들이 업종별 발생특성 을 대표한다고 판단하기는 어렵지만 전체 82개 업종을 대 상으로 비교적 체계적인 현장조사를 통하여 발생폐수와 처 리수 데이터를 제시하고 있으므로 업종별 배출 부하 기여 도 분석 기초자료로 활용하였다.
2. 위해성 지표를 이용한 업종별 오염부하 기여도 분석의 필요성
국내 폐수배출시설 규모별 폐수발생 현황을 살펴보면 2007년 현재 전체 배출시설 45,163개소 중 대형 배출시설 인 1종, 2종 사업장은 1.8%(1종: 0.7%, 2종: 1.1%)에 불과 하며 대부분 소규모 배출시설이 전체의 95%(5종: 91%, 4 종: 4%)를 차지하고 있으나, 폐수 발생량은 1종, 2종 사업 장이 전체의 56%를 차지하고 있다. 또한 개별 업종에서도 용수사용량이 많은 담배제지목제업종의 경우 전체 폐수배 출시설의 0.1%에 해당되는 459개소에서 전체 폐수발생량 의 10.6%에 해당하는 320,077천 m3/일을 배출하고 있으며, 대부분인 소규모 배출업소인 조립금속업종은 2,236개소에 서 97,700천 m3/일만을 배출하고 있다(환경부, 2008). 따라 서 국내의 경우는 폐수 발생량이 많은 업종, 독성오염물질 배출량이 많은 업종을 대상으로 TBELs을 적용하는 것이 합리적이며, 이를 위하여 업종별, 규모별 오염부하 기여도 를 산정하고 우선순위를 정해 단계적으로 수립하는 것이 효과적이라 판단된다.
EPA에서는 업종별 오염부하 산정을 위하여 업종별 배출 특성 분석 프로그램인 ‘Effluent Guidelines Program’을 통 해 각 주에서 수집된 업종별 독성화학물질 배출자료(Toxic Release Inventory, TRI)와 개별배출시설들의 인허가 및 모 니터링 자료(Permit Compliance System, PCS)들을 활용, 200여종의 수질유해물질들을 독성가중치인자를 고려하여 업종별 오염물질 배출부하 기여도를 평가하는 배출오염부 하 기여도분석(Screening-Level)을 실시하고 있다(USEPA, 2005b). 그러나 기존 국내 업종별 배출오염부하 산정에서 는 폐수 발생량 및 유기물질(BOD) 발생량 자료만을 활용 하고 있다. 2007년도 현재 국내 업종별 BOD부하 발생량은 음식료품(620천 kg/일), 담배제지목재(598천 kg/일), 섬유피 혁(446천 kg/일) 업종 순서로 배출하고 있는 것으로 나타나 고 있다(환경부, 2008). 업종별 BOD 발생량과 수질유해물 질 배출량과 연관성은 크지 않으며, 화학제품 제조시설 등 에서는 낮은 BOD 배출량에도 불구하고 다량의 수질유해물 질을 배출하고 있다. 2009년 현재 입법예고된 특정수질유 해물질은 1,4-다이옥산, 비스(2-에틸헥실)프탈레이트, 염화비 닐, 아크릴로니트릴, 브로모포름, 아크릴아미드 6종으로 환 경부 보고서 자료에 따르면 이 중 염화비닐, 아크릴로니트 릴이 가장 광범위하게 배출되고 있는 것으로 나타났다. 또 한 1, 4-다이옥산은 낙동강 수계에 비교적 고농도로 검출되 고 있다. 특정수질 유해물질은 아니지만 일반 수질오염물질 로 추가된 퍼클로레이트의 경우에도 전자, 제련 등 여러 업종에서 공통적으로 배출하고 있는 물질로 역시 낙동강 수계에서 고농도로 검출되고 있는 것으로 조사되었다(국립 환경과학원, 2006~2009).
이러한 수질유해물질에 대한 대책마련을 위해서는 배출 업종을 조사하고 독성가중치를 고려한 업종별 오염부하 기 여도 분석을 통해 수계 위해성 영향을 정확히 파악하여 업 종별 특성에 적합한 배출허용기준 적용 등 업종별 산업폐수
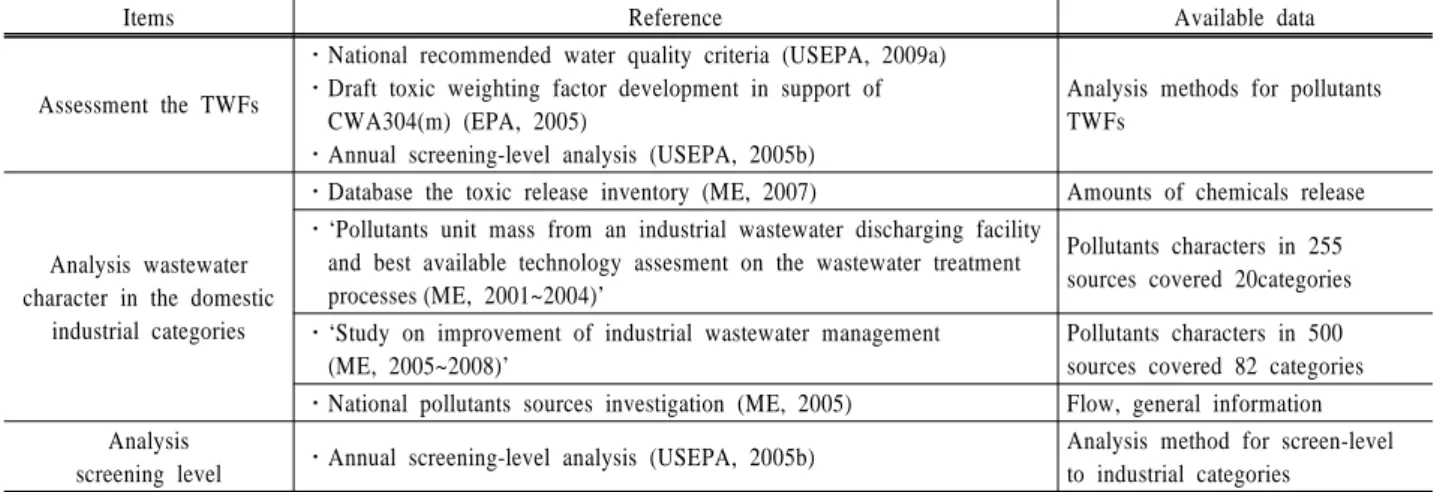
Table 1. Main reference and available data for review items
Items Reference Available data
Assessment the TWFs
․National recommended water quality criteria (USEPA, 2009a)
․Draft toxic weighting factor development in support of CWA304(m) (EPA, 2005)
․Annual screening-level analysis (USEPA, 2005b)
Analysis methods for pollutants TWFs
Analysis wastewater character in the domestic
industrial categories
․Database the toxic release inventory (ME, 2007) Amounts of chemicals release
․‘Pollutants unit mass from an industrial wastewater discharging facility and best available technology assesment on the wastewater treatment processes (ME, 2001~2004)’
Pollutants characters in 255 sources covered 20categories
․‘Study on improvement of industrial wastewater management (ME, 2005~2008)’
Pollutants characters in 500 sources covered 82 categories
․National pollutants sources investigation (ME, 2005) Flow, general information Analysis
screening level ․Annual screening-level analysis (USEPA, 2005b) Analysis method for screen-level to industrial categories
관리대책이 마련되어야 할 것이다.
3. 연구방법 및 자료 분석
다음 Table 1은 본 연구내용인 TWFs 산정, 업종별 폐수 배출특성, 업종별 발생폐수 기여도를 분석하기 위해 활용된 중요한 참고자료들을 정리한 것이다.
오염물질 위해도 지표인 TWFs는 ‘Draft Toxic Weighting Factor Development in Support of CWA304(m)’ (USEPA, 2005a)에서 제시한 산정 방식을 채택하였다. 아직 국내에서 는 수질오염물질별로 인체 및 수생태계를 고려한 수질환경 기준 설정연구가 진행 중에 있으므로 EPA에서 설정한 국 가수질 준거치를 활용하였다. 분석을 위한 기초 수질자료로 는 국내 화학물질 배출량 조사 자료와 기존 연구에서 조사 한 배출시설 수질자료들을 활용하였다. 국내 업종별 화학물 질 수계 배출자료는 ‘화학물질 배출량 조사자료’ (환경부, 2007)를 이용하였으며, 국내 82개 업종 배출시설별 수질오 염물질 자료들은 ‘산업폐수 관리체계 개선방안 연구’ (환경 부, 2005~2008)에서 조사한 수질자료를 활용하여 분석하였 다. ‘폐수처리 공정별 BAT평가 및 원단위 산정연구’ (환경 부, 2001~2004)에서는 20개 업종들만 전체 수질오염물질들 을 대상으로 조사가 이루어졌고 나머지 62개 업종들은 일 반오염물질들만 조사 하였으므로 20개 업종 수질자료들만 을 활용하였다. 또한 오염부하 산정을 위한 유량 자료는 전국 폐수배출시설 조사자료(환경부, 2005)결과를 활용하였 다(Table 1 참조).
3.1. 독성오염물질 가중치 인자(TWFs(Toxic Weighting factors)) 산정
미국 EPA는 업종별로 각 수질오염물질들 제거율에 대한 통합적인 처리평가와 비용효과분석을 위한 지표로 1981년 에 TWFs 개발하였으며, 물질별 위해성 평가지표들이 계속 변화됨에 따라 주기적으로 개정하고 있다. 만일 TWFs를 고려하지 않는다면 폐수 내 구리 l μg/L와 위해성이 매우 높은 PCBs l μg/L를 동등한 값으로 평가 할 수 밖에 없다 (USEPA, 2005a). TWFs는 산업폐수의 유해도를 정확히 나
타내는 과학적 지표라고 할 수는 없지만 다양하게 배출되 는 수질오염물질들의 위해성을 고려하여 각 업종별 수계 배출정도를 정량적으로 판단할 수 있는 지표로서 현재까지 EPA에서 유용하게 활용하고 있다.
TWFs는 구리의 수생태계 준거치(5.6 μg/L)를 기준으로 하여 각 수질오염물질들의 수생태계 만성 준거치와 인체 유기물 섭취 건강 준거치를 합한 값으로 다음 식 (1)로 계 산된다.
(1)
TWF : toxic weighting factor
AQ : chronic aquatic life value (μg/L) : 수생태계 만성 준거치 HHOO : human health (ingesting organisms only) value
(μg/L) : 인체 유기물 섭취 건강 준거치 5.6 : 구리 생태계 만성 준거치(개정전 기준)
EPA는 오염 물질별 독성정도를 나타내기 위한 기준물질 로 비교적 산업폐수에서 쉽게 검출되고, 제거되는 구리를 선정하였다. 구리 수질 준거치는 1980년에 5.6 μg/L으로 결 정되었고 이후 1998년에 9 μg/L로 변경되었으나 예전 자료 와 비교분석을 용이하게 하기 위해서 기존 구리 준거치인 5.6 μg/L를 적용하고 있다(EPA, 2005a). 이번 연구에서 TWFs 산정은 국내에서 수계로 배출된다고 보고된 48종 화 학물질과 국내 기존 연구에서 조사된 18종의 수질오염물질 들을 대상으로 하였다(Table 2 참조). 일반오염물질인 BOD, COD, SS, T-P는 위해도 평가 지표가 없으므로 제외하였다.
3.2. 화학물질 배출량 조사자료 분석
화학물질 배출량 자료는 환경부에서 2007년도 실시한 조 사 자료를 이용하였다. 환경부 화학물질 배출량 조사에서 업종별 분류는 한국표준산업분류체계에 따른 분류로서 환 경부에서 지정한 82개 배출시설별 분류체계와 차이가 있 다. 조사자료는 한국표준산업분류에 의한 36개 업종에 속 한 사업장 중 배출시설 설치허가 또는 신고를 한 종원업 수 30인 이상, 자일렌 등 219종 화학물질 중 하나 이상의
Table 2. Pollutants to assess the TWFs
Reference data Pollutants to assess the TWFs
Database for the toxic release inventory (ME, 2007)
T-N, phenol, cyanide, chrome, soluble-Fe, zinc, copper, cadmium, organic phosphate, arsenic, lead, hexavalent chrome, soluble-Mn, fluorine, PCBs, TCE, PCE, aluminum, chloroform, etc. (48)
‘Study on improvement of industrial wastewater management
(ME, 2005~2008)’ T-N, phenol, cyanide, chrome, iron, zinc, copper, cadmium, mercury, (organic phosphate), arsenic, lead, hexavalent chrome, soluble-Mn, fluorine, PCBs, TCE, PCE (18)
‘Pollutants unit mass from an Industrial wastewater discharging facility and Best available technology assesment on the wastewater treatment processes’ (ME, 2001~2004)
물질 1톤 이상을 제조, 사용한다고 보고된 3,012개 사업장 을 대상으로 하고 있다. 화학물질 발생량 분석 결과 운송 장비, 화학, 고무플라스틱업종 순서로 화학물질을 많이 배 출되고 상위 5개 업종이 전체 배출량의 63.5%를 차지하는 것으로 나타나고 있다.
본 연구에서는 해당 사업장에서 수계에 배출 한다고 보 고된 화학물질들 중 미국 국가 수질기준 준거치에 포함된 수질유해물질 48종을 대상으로 TWFs와 오염물질별 유해성 을 감안한 오염부하량(Toxic Weight Kilograms Equivalent, TWKE)을 식 (2)와 같이 산정하였다.
TWKE (kg-equivalent/yr) = 오염물질 배출량 (kg/yr) × Toxic Weighting Factors (TWFs) (2)
3.3. 업종별 배출시설 수질자료 및 유량자료 분석 업종별 배출시설 수질자료는 국립환경과학원에서 수행한
‘폐수처리공정별 BAT 평가 및 원단위 산정(2001년~2004 년)’에서 실시한 20개 업종 255여개 배출업소 조사 자료와
‘산업폐수 관리체계 개선방안 연구(2005년~2008년)’에서 실 시한 82개 업종 500여개 배출업소 조사 자료를 활용하였 다. 조사항목들 중 TWFs 산정이 가능한 18종의 수질오염 물질들을 평가대상으로 하였으며, 위해성 지표가 없는 BOD, SS, COD, T-P, 대장균군, 색도 등 일반오염물질들은 제외 하였다.
오염물질별 부하산정을 위한 업종별 유량 자료는 ‘환경부 전국 배출업소 조사자료(2005년)’ 중 해당 업종 배출업소 폐수 방류량 합계를 적용하였다. 업종별 위해도를 고려한 수질오염물질 발생부하(TWKE)는 TWFs에 업종별 폐수 방 류량을 곱하여 식 (3)과 같이 산정하였다.
TWKE (kg-equivalent/yr) = 오염물질농도 (mg/L) × 방류량 (m3/d) × 365일 × TWFs (3)
3.4. 업종별 배출시설 조사자료 한계
∙미국 EPA는 배출시설 인허가 및 허가갱신(5년마다) 시 보고되는 배출오염물질 자료, 자율점검 모니터링 자료, 단속정보 자료 등 다양한 데이터베이스를 활용하여 실질 적인 업종별 배출자료들을 수집하는 반면 국내의 경우 업종별 조사 자료는 매우 부족한 상황으로 현재 자료만 으로 해당업종의 대표성을 갖기 힘들다.
∙평가대상 수질오염물질 자료가 18종에 불과하여 업종별 유 해성을 평가하기에는 부족하다. (현재 환경부 지정 수질오 염물질은 41종, 미국의 경우 200여종 수질유해물질 규제)
∙화학물질 배출량 조사에서는 표준산업분류체계에 의한 36개 업종분류를 이용하여 배출량을 산정하였고 업종별 배출시설 수질자료에서는 환경부에서 지정한 82개 업종 분류체계를 적용하였으므로 분류체계 차이에 의한 업종 별 오염물질 배출량 차이가 발생하며 직접적인 비교가 어렵다.
∙유량과 수질자료가 서로 다른 데이터베이스에서 인용되었 기 때문에 오염부하량 산정이 불확실하다.
∙공공 하폐수처리시설 수질유해물질 배출량이 조사되지 않 았으므로 간접방류로 인한 수계 영향을 파악할 수 없다.
4. 업종별 오염부하 기여도 분석 결과 및 고찰
4.1. 수질오염물질별 TWFs 산정
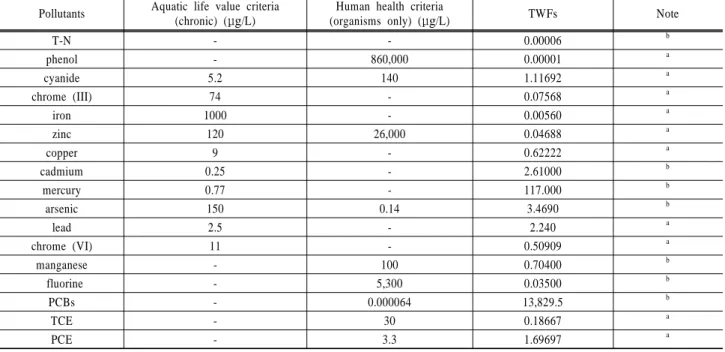
TWFs는 구리의 수생태계 만성 준거치(5.6 μg/L, 개정 전) 를 미국 National recommended water criteria에서 지정된 수질오염물질별 수생태계 만성 준거치(Aquatic life value, chronic)와 인체 유기물 섭취 건강 준거치(Human health, organisms only)로 나눈 값을 합하여 산정하였다(USAPA 2009b). 또한 새로운 위해성 연구결과에 따라 준거치가 변 경된 수질유해물질들은 2005년도 ‘Draft Toxic Weighting Factor Development in Support of CWA304 (m) Planning Process’ (USEPA 2005a)를 기준으로 2006년도 미국 업종별 오염부하 기여도 분석(Screening-Level; USEPA, 2006)에서 적용된 TWFs 값을 적용하였다.
TWF 산정결과 PCBs 13,829.5, 수은 117.0, 비소 3.469 순으로 독성 가중치가 높게 나타났다. 따라서 이들 독성오 염물질들이 폐수 중 소량만 포함되어 있더라도 오염물질 TWKE는 높게 산정된다. T-N의 경우 암모니아와 NO3-N에 의한 인체 및 수생태계 유해성을 고려하여 0.00006으로 산 정되었다(Table 3 참조).
본 연구에서는 국내 수질오염물질 배출허용기준이 설정 된 항목중 기존 업종별 조사연구에서 분석대상에 포함된 오염물질만을 대상으로 하였으므로 다른 수질오염물질들에 대한 TWFs 산정은 제외하였다. 기타 오염물질들 중 다이 옥신류는 많은 이성질체가 존재하므로 TWFs 산정 시 이성 질체별 검량선을 산출하여 산정하고 있다. 현재 국내에는
Table 4. Discharge contribution analysis of Toxic Release Inventory (TRI)
Industrial categories TRI TRI TWKE
ton/yr Rank equ-ton/yr Rank %
Compounds and chemical products manufacturing 51.7 1 17.7 1 35.8
Primary metal processing industry 41.3 2 12.2 2 24.7
Food and beverage industry 25.5 3 8.4 3 17.0
Pulp, paper and paper products manufacturing 7.4 4 4.8 4 9.6
Electronic components, picture, sound and communication equipment
manufacturing 5.3 7 2.1 5 4.2
Nonmetalic minerals manufacturing 0.9 10 1.9 6 3.9
Assembly metal product manufacturing(excluded machine and furniture) 5.9 6 1.0 7 2.0 Other electronic machine and electricity conversion device manufacturing 0.9 11 0.7 8 1.4
Other transportation equipment manufacturing 1.5 8 0.5 9 1.0
Leather, bag and shoes manufacturing 1.2 9 0.1 10 0.2
Table 3. Criteria & TWFs of main pollutants Pollutants Aquatic life value criteria
(chronic) (μg/L)
Human health criteria
(organisms only) (μg/L) TWFs Note
T-N - - 0.00006 b
phenol - 860,000 0.00001 a
cyanide 5.2 140 1.11692 a
chrome (III) 74 - 0.07568 a
iron 1000 - 0.00560 a
zinc 120 26,000 0.04688 a
copper 9 - 0.62222 a
cadmium 0.25 - 2.61000 b
mercury 0.77 - 117.000 b
arsenic 150 0.14 3.4690 b
lead 2.5 - 2.240 a
chrome (VI) 11 - 0.50909 a
manganese - 100 0.70400 b
fluorine - 5,300 0.03500 b
PCBs - 0.000064 13,829.5 b
TCE - 30 0.18667 a
PCE - 3.3 1.69697 a
a :
(AQ, HHOO : Apply the U.S recommended criteria (USEPA. 2009a))
b : Recalculated Toxic Weighting Factors (USEPA, 2005. Draft toxic weighting factor development in support of CWA304 (m).) (USEPA, 2005a, 2006, 2009a)
경우 적합한 TWFs를 산정할 수 있는 위해성 지표 설정을 위한 기초자료는 아직 미흡하므로 향후 국내에 업종별 배 출특성 파악을 위한 수질유해물질 선정 및 위해성 지표 설 정을 위한 추가 연구들이 필요하다고 판단된다(USEPA, 2005a, 2009b).
4.2. 화학물질 배출량 조사자료
화학물질 배출량 조사자료 분석은 화학물질 배출량 조사 자료(환경부, 2007)를 토대로 업종별 화학물질 수계배출량 과 오염물질별 TWFs를 곱하여 TWKE를 산정하였다. 화합 물 및 화학제품 제조업(Compounds and chemical products manufacturing), 제1차 금속산업(Primary metal processing industry), 음식료품 제조업(Food and beverage industry), 펄 프, 종이 및 종이제품 제조업(Pulp, paper and paper pro- ducts manufacturing) 순으로 위해성이 높은 화학물질을 많
이 배출하는 것으로 나타나고 있으며 수계배출 화학물질량 의 87.1%를 이 4개 업종이 차지하고 있는 것으로 나타나 고 있다(Table 4 참조).
비금속광물 제조업의 경우 수계배출 화학물질들의 위해 성이 높아 수계 단순 배출량의 경우 10위를 나타냈으나 독 성가중치를 고려한 TWKE 발생량은 6위를 차지하고 있는 것으로 나타났다.
Table 5는 2007년도 국내에서 화합물 및 화학제품 제조 업(Compounds and chemical products manufacturing)의 수 계 배출 신고된 화학물질 종류 및 화학물질량을 나타낸 것 이다(환경부, 2007). 망간, 알루미늄, 아크릴로니트릴, 이황 화탄소 순으로 수계배출량이 많은 것을 나타났으며 특히 아크릴로니트릴의 경우 배출량은 95kg/yr에 불과하나 독성 가중치 인자인 TWF가 22.4로 매우 높아 TWKE가 2,137 equ-kg/yr로 산정되었다(Table 5 참조).
Table 6. Discharge loads contribution analysis (TWKE ranking) to raw industrial wastewater Rank Industrial categories
Raw wastewater TWKE (equ-kg/yr)
TWFs sum of raw wastewater (equ-mg/L)
Flow rate
Avg. Max. % Avg. Max. m3/d
1 Synthetic resins and other plastics manufacturing 58,308 265,166 21.1 2,855 12,985 55,948
2 Petroleum refining 39,507 85,697 14.3 1,650 3,578 65,610
3 Petrochemical basic compounds manufacturing 39,485 176,163 14.3 1,263 5,634 85,669
4 Synthetic rubber manufacturing 18,658 49,686 6.7 4,103 10,927 12,458
5 Basic inorganic compounds manufacturing 16,828 16,828 6.1 1,587 1,587 29,059
6 Assembly metal products manufacturing 15,521 77,678 5.6 548 2,742 77,603
7 Other food manufacturing 13,217 105,087 4.8 839 6,675 43,135
8 Other nonmetal mineral product manufacturing 6,893 16,467 2.5 730 1,743 25,880
9 Other basic organic compound manufacturing 6,597 19,876 2.4 1,903 5,733 9,499
10 Surfactant, toothpaste, soap and other detergent
manufacturing 6,208 28,618 2.2 14,456 66,646 1,176
Table 5. Discharged Toxic substances in the compounds and chemical products manufacturing
Toxic substances kg/yr TWF TWKE (equ-kg/yr)
Manganese 14,206 0.70400 10,001
Aluminum 6,175 0.64370 3,975
Acrylonitrile 95 22.40000 2,137
Carbon disulfide 214 2.80000 599
Chlorine 1,093 0.48700 532
Cyanide 103 1.11692 115
Copper 133 0.62222 83
Zinc 1,701 0.04688 80
Lead 14 2.24000 30
Benzene 97 0.10980 11
Others - - 116
Sum - - 17,679
현행 환경부 화학물질 배출량 조사자료를 이용하여 업종 별 배출특성 파악 시 다음과 같은 문제점들을 고려해야 한 다. 배출업소 신고 자료만을 대상으로 산정하고 있으므로 유해 화학물질들의 누락 및 발생량 축소 가능성이 있고 공 정 중에 발생되는 화합물에 대한 자료는 조사 시 제외되어 있다. 또한 표준산업분류에 의한 업종별 화학물질 배출량자 료를 근거로 조사되어 환경부 82개 배출업소 분류체계의 업종 배출량자료와 직접적인 비교가 어렵다.
4.3. 업종별 배출시설 조사자료(원수, 처리수) 분석 업종별(환경부 분류) 배출시설 조사자료는 ‘산업폐수 관 리체계 개선방안 연구(환경부, 2005~2008)’와 ‘폐수처리공 정별 BAT 평가 및 원단위 산정(환경부, 2001~2004)’연구 에서 조사한 수질자료를 대상으로 분석하였다. 업종별 원폐 수 발생부하량 TWKE으로 산정한 결과 ‘합성수지 및 기타 플라스틱 물질 제조시설(Synthetic resins and other plastics manufacturing)’이 평균 58,308equ-kg/yr로 전체 부하량의 21%를 차지하여 가장 오염부하 기여도가 높은 것으로 나 타났다. 다음으로 석유정제품 제조시설(Petroleum refining) 과 석유화학계 기초화합물 제조시설(Petrochemical basic compounds manufacturing) 순으로 원폐수 발생부하량 TWKE
가 높은 것을 나타났다. 상위 5개 업종의 원폐수 발생부하 량 TWKE는 전체 62.5%의 오염부하를 차지하고 있으며 상위 10개 업종이 전체의 80%를 차지하고 있다(Table 6 참조).
업종별 원폐수 발생 오염부하 특성을 분석하면 위해성 지표가 높은 업종(TWFs의 합이 높은 경우)은 계면활성제, 치약, 비누 및 기타세제 제조시설(Surfactant, toothpaste, soap and other detergent manufacturing) 등이며, 폐수 발생량에 의한 영향이 큰 업종은 석유화학계 기초화합물 제조시설 (Petrochemical basic compounds manufacturing) 등으로 나 타났다. 또한 위해성 지표와 폐수 발생량 영향이 비슷한 업종은 합성고무제조시설(Synthetic rubber manufacturing) 등으로 분석되었다(Table 7 참조). 폐수 발생량이 많은 업 종의 경우 농도 규제만으로는 오염부하 저감에 한계가 있 으므로 부하(총량) 기준 배출허용기준을 TBELs 제도에 도 입해야 할 것으로 판단된다.
수계 및 공공처리장으로 배출되는 방류수 오염물질들의 TWFs합에 방류량을 곱하여 TWKE를 산정한 결과 제1차 철강산업시설(Primary steel industry)이 평균 291equ-kg/yr가 배출되며, 전체의 19.9%로 가장 많은 양을 차지하고 있다.
다음으로 석유정제품 제조시설(Petroleum refining), 석유화학 계 기초화합물 제조시설(Petrochemical basic compounds manufacturing)이 각각 215equ-kg/yr, 177equ-kg/yr 배출되어 각각 전체 배출량의 14.6%, 12.0%를 차지하고 있다. 상위 5 개 업종의 방류수 TWKE는 전체 62.2%를 차지하고 있으며 10개 업종 부하기여도가 82%에 이르고 있다(Table 8 참조).
방류수 배출특성을 분석한 결과 위해성 지표가 높은 업 종(TWFs의 합이 높은 경우)는 석유정제품 제조시설(Petro- leum refining) 등이고, 폐수 발생량 영향이 큰 업종은 펄 프, 종이 및 종이제품 제조시설(Pulp, paper and paper pro- ducts manufacturing) 등이며, 위해성 지표와 폐수 발생량이 모두 높은 업종은 제1차 철강산업(Primary steel industry) 등으로 나타났다(Table 9 참조). 따라서 위해성 지표가 높 은 석유정제품 제조시설(Petroleum refining) 등은 오염물질 농도기준으로, 폐수 발생량이 많은 펄프, 종이 및 종이시설 제조시설(Pulp, paper and paper products manufacturing) 등
Table 7. Industrial categories's divisions and considerations to raw wastewater characteristic
Divisions Industrial categories Considerations
High toxic effect categories
Synthetic rubber manufacturing / Other basic organic compound manufacturing / Surfactant, toothpaste, soap and other detergent manufacturing (3)
Toxic pollutants's concentration
High flow rate effect categories
Petroleum refining / Petrochemical basic compounds manufacturing / Assembly metal products manufacturing / Other food manufacturing / Other nonmetal mineral product manufacturing (5)
Flow rate
Categories that Toxic effect is similar to flow effect
Synthetic resins and other plastics manufacturing / Basic inorganic
compounds manufacturing (2) Concentration and flow rate
Table 8. Discharge loads contribution analysis (TWKE ranking) to effluent industrial wastewater Rank Industrial categories
Effluent TWKE (equ-kg/yr)
TWFs sum of effluent (equ-mg/L)
Flow rate
Avg. Max. % Avg. Max. m3/d
1 Primary steel industry 291 337 19.9 4.53 5.24 176,056
2 Petroleum refining 215 222 14.6 8.97 9.29 65,610
3 Petrochemical basic compounds manufacturing 177 193 12.0 5.65 6.16 85,669
4 Assembly metal products manufacturing 131 253 8.9 4.63 8.95 77,603
5 Broadcast receiver and other picture, sound
equipment manufacturing 99 655 6.8 0.94 6.18 290,288
6 Plating facilities 83 270 5.7 1.40 4.55 162,873
7 Wastewater treatment, storage and discharge
facilities 67 410 4.6 2.59 15.73 71,340
8 Pulp, paper and paper products manufacturing 58 188 4.0 0.42 1.37 376,460
9 Dyeing and processing facilities 44 151 3.0 0.51 1.75 236,662
10 Coal mining facilities 38 111 2.6 1.81 5.23 58,268
Table 9. Industrial categories's divisions and considerations to effluent character
Divisions Industrial categories Considerations
High toxic effect categories
Petroleum refining / Petrochemical basic compounds manufacturing / Assembly metal products manufacturing / Wastewater treatment, storage and discharge facilities (4)
Toxic pollutants's concentration
High flow rate effect categories
Broadcast receiver and other picture, sound equipment manufacturing / Plating facilities / Pulp, paper and paper products manufacturing / Dyeing and processing facilities (3)
Flow rate
Categories that Toxic effect is similar to flow effect
Primary steel industry / Coal mining facilities/ Assembly metal
products manufacturing (3) Concentration and flow rate
은 부하(총량) 배출허용기준 도입하는 것이 오염부하 저감 차원에서 필요할 것으로 판단된다.
4.4. 화학물질 배출량 및 업종별 배출시설 조사자료 분석결과
원폐수 및 방류수 오염부하기준 및 화학물질 수계배출량 기준으로 각각 업종 순위를 다시 정리하였다(Table 10 참조).
화학물질 배출량(TRI)자료를 이용하여 독성도 높은 화학물 질들의 잠재적인 배출가능성을 고려하고 실질적으로 업종 별 배출시설의 원수 및 처리수에서 검출되고 있는 수질오 염물질들의 위해성과 배출량을 검토하여 우선적으로 집중 관리해야 할 대상 업종을 선정할 수 있다. 표준산업분류체 계에 따른 TRI 분석자료에서는 1차 금속산업(Primary metal processing industry)이 기여도 2위를 차지하고 있으나 환경 부 배출시설 분류체계에 따른 유출수 TWKE 분석자료에서 는 1차 철강산업시설(Primary steel industry)이 1위를 차지
하고 있다. 현재 분류체계(표준산업분류, 환경부 분류)에 따 라서 배출시설들의 구분이 달라지므로 있으므로 화학물질 배출량 조사에서 환경부 분류체계를 포함하는 것이 필요할 것이다.
오염부하 기여도가 높은 업종들은 강화된 TBELs을 우선 적으로 적용되어야 할 업종들이라 판단된다. 조립금속 제품 제조시설(Assembly metal products manufacturing)은 3개의 순위에서 모두 상위를 차지하고 있으며 합성수지 및 기타 플라스틱물질 제조시설(Synthetic resins and other plastics manufacturing), 석유정제품 제조시설(Petroleum refining), 석유화학계 기초화합물 제조시설(Petrochemical basic com- pounds manufacturing), 기타 비금속 광물물질 제조시설 (Other nonmetal mineral product manufacturing), 제1차 철 강산업시설(Primary steel industry), 펄프・종이 및 종이제품 제조시설(Pulp, paper and paper products manufacturing) 등 은 2개 순위에서 중복되고 있으므로 이들 업종들을 중심으
Table 10. Discharge loads contribution rank in industrial categories
Rank Raw wastewater TWKE Effluent TWKE Toxic Release Inventory (TRI)
1 Synthetic resins and other plastics
manufacturing Primary steel industry Compounds and chemical products
manufacturing
2 Petroleum refining Petroleum refining Primary metal processing industry
3 Petrochemical basic compounds manufacturing
Petrochemical basic compounds
manufacturing Food and beverage industry
4 Synthetic rubber manufacturing Assembly metal products manufacturing Pulp, paper and paper products manufacturing 5 Basic inorganic compounds manufacturing Broadcast receiver and other picture,
sound equipment manufacturing
Electronic components, picture, sound and communication equipment manufacturing 6 Assembly metal products manufacturing Plating facilities Nonmetalic minerals manufacturing 7 Other food manufacturing Wastewater treatment, storage and
discharge facilities
Assembly metal product manufacturing (excluded machine and furniture) 8 Other nonmetal mineral
product manufacturing
Pulp, paper and paper products manufacturing
Other electronic machine and electricity conversion device manufacturing 9 Other basic organic compound
manufacturing Dyeing and processing facilities Other transportation equipment manufacturing 10 Surfactant, toothpaste, soap and other
detergent manufacturing Coal mining facilities Leather, bag and shoes manufacturing
로 업종별 산업폐수 관리방안을 수립해야 할 것이라고 판 단된다.
5. 결 론
국내 TBELs 도입 시, 규모별, 업종별로 오염부하 기여도 분석을 통하여 우선순위를 정해 단계적으로 수립하는 것이 효과적이다. 따라서 본 연구는 1) 위해성 지표인 수질오염 물질별 독성물질 가중치 인자, TWFs 산정, 2) 기존 업종별 배출업소 조사자료 분석을 통한 배출특성 파악, 3) 위해성 지표를 이용한 업종별 오염부하인 TWKE 산정을 통한 기 여도 분석으로 진행하였다.
국내 업종별 배출시설 조사자료와 미국 국가수질준거치 및 위해성 가중치인자 연구자료를 활용하여 국내 수질유해 물질별 위해성 가중치 인자인 TWFs를 산정한 결과, PCBs 13,829.5, 수은 117, 비소 3.469 순으로 독성가중치가 높게 나타났으며, TWKE 값 산정 시 이들 오염물질의 영향이 크게 반영된다.
기존 배출시설 조사자료를 활용하여 산업폐수 업종별 배 출특성 평가 및 업종별 오염부하 기여도 분석 결과는 다음 과 같다.
1) 업종별 화학물질 수계 배출량은 화학물 및 화학제품 제 조업(Compounds and chemical products manufacturing), 제1차 금속산업(Primary metal processing industry), 음 식료품 제조업(Food and beverage industry), 펄프・종이 및 종이제품 제조업(Pulp, paper and paper products manu- facturing) 4개 업종이 전체의 87.1%를 차지하고 있다.
2) 업종별 수질자료 분석결과 원폐수 발생 오염부하 기여 도가 가장 높은 업종은 합성수지 및 기타 플라스틱 물 질제조시설(Synthetic resins and other plastics manufac- turing)로서 53,308equ-kg/yr이 발생되고 전체 부하량의 21.1%를 차지하고 있으며 상위 5개 업종 발생 부하량이
전체의 62.5%를 차지하고 있다.
3) 업종별 수질자료 분석결과 방류수 배출 오염부하 기여 도가 가장 높은 업종은 제1차 철강산업시설(Primary steel industry)로서 291equ-kg/yr이 배출되고 전체 배출 오염부하량의 19.9%를 차지하고 있으며, 상위 5개 업종 방류수 배출 부하량이 전체의 62.2%를 차지하고 있다.
방류수 오염부하 기여도가 높은 상위 업종중 배출 수질 유해물질에 의한 위해성 영향이 높은 업종은 석유정제 품 제조시설(Petroleum refining) 등이고, 용수사용량이 많아 유량의 영향이 높은 업종은 펄프종이 및 종이제품 제조시설(Pulp, paper and paper products manufacturing) 등으며, 위해성 영향과 유량의 영향이 모두 비슷한 업종 은 제1차 철강산업시설(Primary steel industry) 등으로 나타났다.
업종별 배출 수질오염물질들의 위해도를 반영한 오염부 하 기여도 분석은 향후 업종별로 차별화된 배출오염부하 저감방법 등 산업폐수 관리대책 수립 시 매우 효과적으로 활용될 수 있을 것이라 판단된다. 현재까지는 업종별 발생 부하조사는 대부분 BOD, COD, SS 등 일반오염물질 중심 으로 이루어져 왔으며 특정수질오염물질을 포함한 수질오 염물질들에 대한 조사와 분석은 2000년대 중반부터 본격적 으로 이루어져 관련 조사 및 자료가 매우 부족한 상황이다.
따라서 향후 체계적인 업종별 조사사업을 통해 위해성을 반영한 업종별 배출부하 기여도 분석을 지속적으로 진행할 필요가 있다고 판단된다. 이번 연구에서 배출부하 기여도 분석에 포함된 수질유해물질들이 대부분 중금속류이고 위 해성이 매우 높은 다이옥신등 잔류성 유기오염물질들은 데 이터의 부재로 제외되었으므로 업종별 배출특성의 위해도 를 정확히 반영할 수 없었다. 따라서 추가 지정된 특정수 질 유해물질 등 폐수의 유해성을 대표할 수 있는 수질유해 물질을 확대 조사하여 업종별 배출특성을 보다 정확히 파 악해야 할 것이다.
사 사
본 연구는 환경부・국립환경과학원 용역과제인 ‘기술에 근 거한 폐수배출허용기준 및 근거자료 조사연구’사업의 지원 에 의해 수행되었습니다.
참고문헌
국립환경과학원(2006~2009). 수질유해물질 적정관리를 위한
배출허용기준설정연구(5차~8차년도). 성균관대.
국립환경과학원(2008). 배출원 특성조사를 통한 업종별 최
적처리 기술 도출연구(I). KIST, 성균관대.
국립환경과학원(2009). 기술에 근거한 폐수배출허용기준 및
근거자료 조사연구(II). KIST, 성균관대.
환경부(2001~2004). 폐수처리공정별 BAT 평가 및 원단위 산 정. 국립환경과학원.
환경부(2005~2008). 산업폐수 관리체계 개선방안 연구. KIST, 성균관대.
환경부(2005). 전국 폐수배출시설 조사자료.
환경부(2007). 화학물질 배출량 조사자료.
환경부(2008). 공장폐수의 발생과 처리.
USEPA(2005a). Draft Toxic Weighting Factor Development in Support of CWA304 (m).
USEPA(2005b). Annual Screening-Level Analysis.
USEPA(2006). Technical Support Document for the 2006 Eff- luent Guidelines Program Plan.
USEPA(2008). Technical Support Document for the 2008 Eff- luent Guidelines Program Plan.
USEPA(2009a). National Recommended Water Quality Criteria.
USEPA(2009b). www.epa.gov/waterscience/guide/.