15
학 술 논 문Classification of Mental States Based on Spatiospectral Patterns of Brain Electrical Activity
Han-Jeong Hwang, Jeong-Hwan Lim and Chang-Hwan Im
Department of Biomedical Engineering, Hanyang University, Seoul, Korea (Received November 29, 2011. Accepted January 28, 2012)
Abstract: Classification of human thought is an emerging research field that may allow us to understand human brain functions and further develop advanced brain-computer interface (BCI) systems. In the present study, we introduce a new approach to classify various mental states from noninvasive electrophysiological recordings of human brain activity. We utilized the full spatial and spectral information contained in the electroencephalography (EEG) signals recorded while a subject is performing a specific mental task. For this, the EEG data were converted into a 2D spa- tiospectral pattern map, of which each element was filled with 1, 0, and -1 reflecting the degrees of event-related synchronization (ERS) and event-related desynchronization (ERD). We evaluated the similarity between a current (input) 2D pattern map and the template pattern maps (database), by taking the inner-product of pattern matrices.
Then, the current 2D pattern map was assigned to a class that demonstrated the highest similarity value. For the verification of our approach, eight participants took part in the present study; their EEG data were recorded while they performed four different cognitive imagery tasks. Consistent ERS/ERD patterns were observed more frequently between trials in the same class than those in different classes, indicating that these spatiospectral pattern maps could be used to classify different mental states. The classification accuracy was evaluated for each participant from both the proposed approach and a conventional mental state classification method based on the inter-hemispheric spectral power asymmetry, using the leave-one-out cross-validation (LOOCV). An average accuracy of 68.13% ( ± 9.64%) was attained for the proposed method; whereas an average accuracy of 57% ( ± 5.68%) was attained for the conventional method (significance was assessed by the one-tail paired t-test, p < 0.01), showing that the proposed simple clas- sification approach might be one of the promising methods in discriminating various mental states.
Key words: brain-computer interface (BCI), spatiospectral pattern, mental state classification, mind reading, elec- troencephalography (EEG)
I. Introduction
Recently, thanks to dramatic advances in technologies for recording human brain activity and methods for statistical pattern recognition, neuroscientists have recognized the pos- sibility of decoding the human mind based on brain activity recorded via multiple neuroimaging modalities, such as func- tional magnetic resonance imaging (fMRI), near infrared spectroscopy (NIRS), electroencephalography (EEG), and
magnetoencephalography (MEG) [1-13]. These “mind read- ing” or “brain reading” technologies have been explored not only to advance our understanding of neural information pro- cessing but also to develop new applications such as brain- computer interfaces (BCI) [2,3,6,11,12], lie detection [1,5,7, 8,13], and communication with severely locked-in patients [4,9,10].
In early “mind reading” fMRI studies, most analyses fo- cused only on brain activity at a small number of volume pixels (voxels) that demonstrated statistically significant re- sponses with respect to given experimental conditions [14- 16]. However, these studies have met with criticisms concern- ing the “original signal-loss” brought about by spatial averag- ing of significant voxel responses [17]. Moreover, the voxels discarded in the analysis have posed another problem in that they might carry meaningful information associated with
Corresponding Author : Chang-Hwan Im
Department of Biomedical Engineering, Hanyang University, 222 Wangsimni-ro, Seongdong-gu, Seoul 133-791, Korea TEL: +82-2-2220-2322 / FAX: +82-2-2296-5943
E-mail: [email protected]
This work was supported by a grant from the National Research Foundation of Korea (NRF) funded by the Korean government (MEST) (No. 2010-0015957).
16
certain mental states [18].
In contrast to the individual voxel-based analysis strategies, a more recent analysis method, referred to as multi-voxel pat- tern analysis (MVPA), uses multi-spatial patterns of brain activity, aiming to enhance the sensitivity of detecting higher order brain functions by introducing statistical pattern clas- sification algorithms [5,19-22]. In MVPA, even voxels with weaker responses are considered to be meaningful features, as they might hold important keys for interpreting cognitive states. To date, several impressive feats of mind reading have been accomplished using MVPA in fMRI studies, demon- strating the superiority of using multi-spatial information of brain activity in decoding human mental states [5,19-22].
As with the fMRI-based mind reading studies, efforts to noninvasively read human thoughts have also been made using EEG studies. Traditionally, spectral powers and their asymmetry between the two hemispheres have been fre- quently adopted as feature vectors for discriminating different mental tasks or cognitive states, such as mental calculation, internal speech, motor imagery, spatial navigation imagery, and so on [23-29]. In the majority of previous EEG-based mind reading studies, brain electrical activities recorded from a few electrodes, which produce the most distinct brain activ- ity patterns, were chosen for analysis [23-25,27,29-31]. How- ever, similar to the individual voxel-based analysis in fMRI studies, this approach might also lead to loss of potentially valuable information associated with rather complex cognitive states because a variety of brain areas can be involved even when a participant is conducting a simple mental task [32].
On the other hand, earliest EEG-based mind reading studies have rarely applied wide frequency bands [23-25]. Recently, however, a number of studies have demonstrated that high fre- quency EEG oscillations correlate closely with various mental activities [33-36], thereby paving the way for researchers to attain superior performance in mental task classification by adding features extracted from high frequency brain activity to those from lower frequency bands [26,27,29]. Since complex higher-order cognitive functions are now believed to be related with various frequency bands, selection of a specific analysis frequency band may also result in loss of information reflecting complex cognitive states.
In the present study, inspired by the MVPA strategy for the fMRI-based mind reading studies, we attempted to use the abundant spatial information extracted from the whole
brain areas, as well as the wide-band spectral information for the classification of different mental states. Using the EEG signals recorded for each mental task, we constructed two- dimensional spatiospectral pattern maps, consisting of quan- tized event-related synchronization (ERS) and event-related desynchronization (ERD) values evaluated at every possible combination of electrode positions and frequency bins. A sim- ilarity between a current 2D pattern map and the template pat- tern maps (database) was evaluated by computing the inner- product of two matrices and was then used to classify the current mental states. The proposed approach has a potential advantage over the conventional methods in that our feature extraction and classification methods do not require complex procedures for selecting specific feature sets and training a classifier. The resultant classification accuracy was also com- pared to that of the conventional mental state classification method frequently adopted in the previous EEG-based mind reading studies.
II. Methods
1. Subjects and experimental conditions
Eight healthy volunteers (all male, all right-handed, aged 20-27 years) participated in the present study. None of them had a previous history of neurological, psychiatric, or other severe diseases that may have influenced the experimental results, nor had they ever participated in EEG-based experi- ments. All participants were asked to abstain from alcohol for 24 hours prior to the experiment in order to maximize con- centration on the experiment. We provided a fully detailed summary of the experimental procedures and protocols to all subjects prior to the experiment. All subjects gave written consent and received monetary reimbursement for their par- ticipation.
In the EEG data acquisition session, the subjects sat on a comfortable armchair facing a 17” LCD monitor. Electrodes were mounted on their scalp according to the extended inter- national 10-20 system. A total of 30 electrodes were evenly and broadly attached to the subjects’ scalps covering whole brain areas (AF3, AF4, Fz, F3, F4, F7, F8, FC1, FC2, FC5, FC6, Cz, C3, C4, CP1, CP2, CP5, CP6, Pz, P3, P4, P7, P8, POz, PO7, PO8, O1, O2, T7, T8) and a multi-channel EEG acquisition system (WEEG-32, Laxtha Inc., Daejeon, Korea) was used for data acquisition. The EEG signals were ac-
17
quired in a dimly lit, soundproof room. The sampling ratewas set at 512 Hz in all experiments. The study protocol was approved by the Institutional Review Board (IRB) at Yonsei University, South Korea.
2. Mental tasks
Four different mental tasks were chosen on the basis of previous studies associated with EEG-based mind reading [28,37,38]. The subjects were asked to use a consistent strat- egy for each mental task to minimize inter-trial variability [39]. The following paragraphs provide descriptions of these tasks.
(Task A) Counting the number of strokes of given Chi- nese characters
Subjects were asked to count the number of strokes of given Chinese characters. All words used for this task con- sisted of four Chinese characters with particular meanings.
Prior to the main recording sessions, the subjects were asked not to think about the meanings of the words to avoid the acquisition of unwanted EEG signals.
(Task B) Mental mathematical calculation
Subjects were given nontrivial multiplication problems in which they were asked to multiply a two digit number by a second two digit number, mentally, as fast as they could. Sub- jects were also asked not to vocalize the numbers and to make no movements while solving the problems. The pairs of two digit numbers used in a session were not repeated to prevent the subjects from becoming accustomed to the problems.
(Task C) Mental singing of the national anthem Subjects were required to sing a song internally, without performing movements to keep the beat. The Korean national anthem was selected as the song to reduce inter-subject vari- ability of the EEG signals.
(Task D) Motor imagery of the tongue
The subjects were asked to perform kinesthetic imagina- tion of tongue movement. Since even small tongue move- ments may contaminate the EEG signals, subjects were instructed not to swallow their saliva during the task period.
In addition to these mental tasks, eyes-closed, resting state EEG signals were recorded for three minutes prior to the main recordings; these were used as a baseline EEG dataset.
During the resting EEG recordings, subjects were asked to
relax and to not think of anything.
3. EEG data acquisition
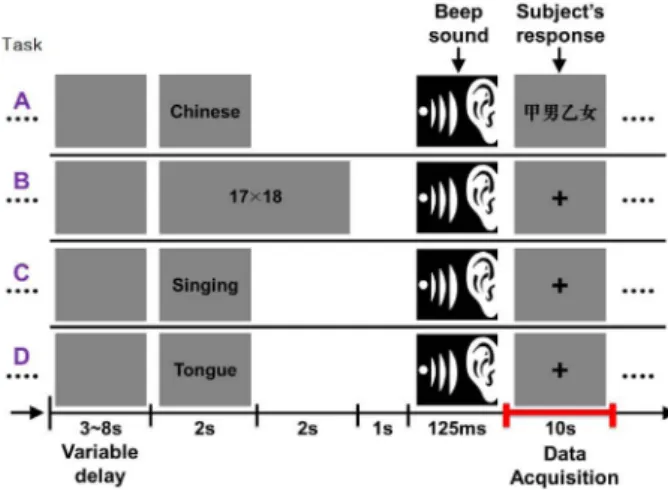
The EEG data were acquired while the participants were performing the four different mental tasks described in the previous section. Fig. 1 depicts the experimental design used in the present study. A gray (RGB: 132, 132, 132) color was selected as the background to prevent eyestrain [40]. At the beginning of each trial, a blank screen was presented for a variable duration (three to eight seconds) and then instruc- tions for the next task appeared in the center of the screen for two seconds for tasks A, C, and D (also see Fig. 1). The preparation period for the mental mathematical calculation (task B) lasted longer (four seconds) than that for the other tasks (two seconds) as the subjects generally needed a longer time to memorize the pair of two digit numbers. Immedi- ately after a beeping sound was presented to the subjects for 125 ms, a black cross fixation was presented at the center of the screen for 10 s for tasks B, C, and D. During this time, subjects were to perform the instructed mental task for 10 s.
In the case of task A (counting the number of strokes of
Fig. 1. Experimental paradigm used in this study. There was a variable delay from 3 s to 8 s before instructing a sub- ject to perform one of the mental tasks. The preparation periods were set to be 2 s for Task A, Task C, and Task D and 4 s for Task B. The preparation period for Task B was longer than the others because the subjects had to memo- rize a pair of two-digit numbers presented on a screen in order to perform the task. After a warning signal was pre- sented for 125 ms (a beeping pure tone sound), the subject was asked to perform the instructed mental task for 10 s.
During the data acquisition period, a cross fixation was
presented at the center of the screen, except the Task A for
which four Chinese characters were presented instead of
the cross fixation.
18
given Chinese characters), a Chinese word consisting of four Chinese characters appeared for 10 s, as it was not trivial for native Koreans to memorize the Chinese words. A single experimental session was composed of 20 independent tri- als, each of which appeared five times in random order.
Seven out of eight participants performed four sessions;
while the other participant (JJ) underwent only three ses- sions due to mental fatigue. Consequently, seven participants performed each mental task 20 times and one participant (JJ) performed each 15 times.
4. EEG data analysis
(1) Feature Extraction
In this study, we developed a feature extraction method that utilizes both the spatial and spectral information con-
tained in the recorded EEG signals. The EEG data were con- verted into 2D spatiospectral pattern maps, of which each element was filled with 1, 0, and -1 reflecting the degrees of ERS and ERD at each electrode and frequency bin. The fol- lowing paragraph provides the detailed explanation on how we constructed the spatiospectral pattern maps.
Five second epochs (2.5-7.5 s from task onset) were ex- tracted from the ten-second EEG signals for each trial and were used for analysis. Each epoch was then divided into one-second segments with 50% overlap, yielding a total of nine time segments in every epoch. Each segment was trans- formed into the frequency domain using the fast Fourier transform (FFT). Then, an average spectral power for each electrode and each frequency was evaluated by averaging the spectral powers of the nine time segments. Consequently, a two-dimensional spectral power map consisting of the spec-
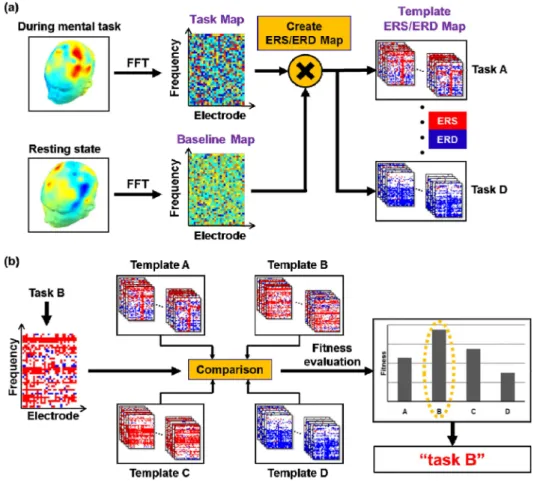
Fig. 2. Schematic illustration of the proposed mental task classification method: (a) A two-dimensional power pattern map
for a specific mental task was constructed by calculating spectral power at each electrode and frequency. The 2D power
pattern map (denoted as “Task Map”) was converted into a 2D spatiospectral pattern map consisting of event-related
(de)synchronization (ERD/S) values (ERS: red color; ERD: blue color), based on the 2D power pattern map constructed for
the resting state (denoted as “Baseline Map”). This procedure was applied to all trials of four mental tasks, Tasks A-D, and
template ERD/S maps for each mental task were obtained. (b) When a new 2D spatiospectral pattern map was fed into the
proposed classification algorithm, this pattern map was compared with the template pattern maps constructed from the
process described in (a). The input pattern map was then assigned to the class with the highest fitness value.
19
tral power values at each electrode and frequency wasobtained for each trial (see Fig. 2a; denoted as the task map).
The frequency resolution was set at 1 Hz and the frequency band ranged from 4 Hz to 45 Hz, including theta (4-7 Hz), alpha (8-13 Hz), beta (14-30 Hz), and lower gamma (30-45 Hz) frequency bands [33-36]. The 2-D spectral power maps for the baseline were also constructed by applying FFT with the same analysis window size (1 s) and the same overlap- ping ratio (50%; see Fig. 2a, denoted as the baseline map).
The mean value and standard deviation of the spectral pow- ers during the baseline period were then evaluated for each electrode-frequency combination. Then, three signed integer values, +1, 0, and -1, were assigned to each element of the 2- D spectral power maps based on the following rules: an event-related synchronization (ERS) value (+1) was assigned to an element for which the power value was larger than
‘mean of baseline powers + one standard deviation of base- line powers’; an event-related desynchronization (ERD) value (-1) was assigned to an element for which the power value was smaller than ‘mean of baseline powers - one stan- dard deviation of baseline powers’; and the other elements, the powers of which were not significantly different from the baseline powers, were filled with zeroes (0). By applying this transformation to all of the 2-D electrode-frequency power maps, we constructed new 2-D spatiospectral pattern maps filled with +1, 0, and -1 values for each mental task (see Fig.
2a; denoted as the template ERS/ERD map).
(2) Classification of Mental States
In order to assess how well the different mental tasks were classified, the leave-one-out cross-validation (LOOCV) method was applied, considering the relatively small number of task trials. We used a single spatiospectral pattern map as valida- tion data, and the remaining pattern maps as training (or template) data. This process was repeated such that every spatiospectral pattern map was used once as the validation data. For the classification of mental tasks, we implemented a simple fitness evaluation technique that measured the sim- ilarity between a validation pattern map and each class of template pattern maps corresponding to each mental task, and the validation pattern map was assigned to a class that dem- onstrated the highest fitness value.
For a given spatiospectral pattern map X, the fitness of X with respect to a set of template pattern maps corresponding
to a specific mental task was evaluated. Similarity between a validation pattern map X and the n-th template pattern map in a set corresponding to a specific mental task, Y(n), was defined as the inner-product of two matrices X and Y(n):
(1)
where E and F are the number of electrodes and frequencies, respectively, the subscripts e and f represent the e-th low and f-th column of the electrode-frequency grid, respectively. As readily seen from (1), ‘1’ was assigned to an element at which two pattern maps had identical ERS/ERD values; ‘-1’
was assigned to an element at which two pattern maps had opposite ERS/ERD values; and ‘0’ was assigned to an ele- ment at which one or both pattern maps had no significant ERS/ERD values.
The similarity values estimated for all template patterns in a class were then averaged into a single value measuring fit- ness between a validation pattern map X and a set of tem- plate pattern maps Y, F(X, Y), as given below:
(2)
where N is the total number of pattern maps included in a set Y. The fitness values between the validation pattern map X and the other sets of template pattern maps were also calculated by applying the same procedure. Finally, a certain validation pat- tern map (an input pattern map in a practical situation) cor- responding to a specific mental task was assigned to the class that demonstrated the greatest fitness value. Fig. 2 is a sche- matic illustration of the proposed mental task classification method. Fig. 2a depicts the process of constructing spa- tiospectral pattern maps for different mental tasks. Fig. 2b describes the process for classifying an input pattern map.
(3) A Conventional Mental State Classification Method
A conventional mental state classification approach was also implemented, considering the methods used in previous EEG-based mind reading studies. Traditionally, spectral pow- ers and their asymmetry between the two hemispheres have been most frequently adopted as feature vectors for discrim- inating different mental tasks or cognitive states [23-29].
Based on the previous literatures, the frequency bands were
h X Y ( ,
( )n) X
e f,Y
e f,( )nf 1=
∑
F e 1=∑
E=
F X Y ( , ) 1
N ---- h X Y ( ,
( )n)
n 1=
∑
N=
20
separated into five sub-frequency bands: theta (4-7 Hz), alpha (8-13 Hz), low beta (14-17 Hz), high beta (18-23 Hz), and gamma (24-45 Hz). In order to extract feature vectors for each trial, spectral powers of the five frequency bands were calculated for all electrodes and the asymmetry ratios bet- ween the right and left hemispheres were also evaluated for each frequency band and corresponding electrode pair (e.g., F3-F4, F7-F8), except for four midline electrodes (Fz, Cz, Pz, and POz) for which merely the spectral powers were used as the feature candidates. LOOCV was also used to measure the classification accuracy. For the feature selection or reduction, we used the sequential floating forward selec- tion (SFFS) that overcomes a well-known drawback of se- quential forward selection (SFS), referred to as a nesting effect, to select the best feature subset as well as to reduce the dimensionality of the feature vectors [41]. Since it has been frequently reported that classification accuracy does not significantly depend on the types of classification algo- rithms [31], the Bayesian classifier that is one of the most frequently used classification algorithms in EEG-based mind
reading studies [25,28,30,31,37] was used for classification.
III. Results
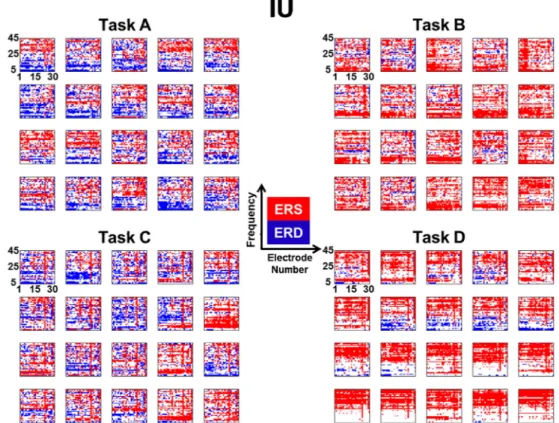
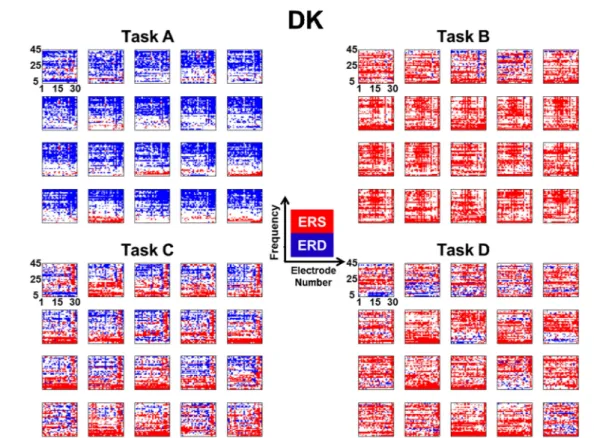
Figs. 3 and 4 show two examples of the 2D spatiospectral maps obtained from two subjects, IU and DK, respectively, who demonstrated the highest classification accuracy (the other six participants’ spatiospectral maps can be downloaded at http://cone.hanyang.ac.kr/bioest/temp/jbmer_si.pdf), where the tasks A, B, C, and D indicate the four mental tasks de- scribed in the previous section. It is evident from visual inspection of Figs. 3 and 4 that the pattern maps obtained while a subject was performing the same mental task exhib- ited similar and consistent trends, and those corresponding to different mental tasks showed discriminable patterns, dem- onstrating the possibility of using these spatiospectral pattern maps for classifying different mental tasks. Unfortunately, however, we did not observe clear inter-subject similarities for specific mental tasks, thought to be secondary to differ- ent levels of baseline activities for each participant. Among
Fig. 3. Two-dimensional spatiospectral pattern maps for all mental tasks performed by subject IU. Event-related synchro- nization (ERS) is plotted in red while event-related desynchronization (ERD) is plotted in blue. The order of electrodes was as follows: the frontal area (AF3, AF4, Fz, F3, F4, F7, F8), the central (sensorimotor) area (FC1, FC2, FC5, FC6, Cz, C3, C4, CP1, CP2, CP5, CP6), the occipital area (Pz, P3, P4, P7, P8, POz, PO7, PO8, O1, O2), and the temporal area (T7, T8).
Consistent intra-class similarity was commonly observed for each task.
21
the eight participants, subject IU had the most consistent intra-class similarity, also reflected in the overall classifica- tion accuracy provided in the next paragraph. Compared to subjects IU and DK, subject JI demonstrated the least con- sistent spatiospectral patterns, which also resulted in the low-
est classification accuracy (see Fig. 5, in advance).
Both the proposed and classical classification methods were applied to the EEG datasets in order to compare per- formance in classifying different mental tasks; results are summarized in Fig. 5. The analysis demonstrated that the classification accuracy was considerably enhanced in all par- ticipants using the proposed method (one-tail paired t-test, p < 0.01). All classification accuracy values exceeded the chance level (25%) for correct classification. The average classification accuracies were 68.13% (± 9.64) for the pro- posed method and 57% (± 5.68) for the conventional method.
IV. Discussion
In order to more accurately discriminate individual’s men- tal states, we proposed a mental task classification method that utilizes spatiospectral pattern maps of brain activity. Our experimental results suggest that our approach can be a promising option to be used in EEG-based mental state clas- sification studies. The proposed approach has another poten-
Fig. 5. Comparison of classification accuracies between the
proposed and classical mental task classification methods.
Fig. 4. Two-dimensional spatiospectral pattern maps for all mental tasks performed by subject DK. Event-related syn-
chronization (ERS) is plotted in red while event-related desynchronization (ERD) is plotted in blue. The order of electrodes
was as follows: the frontal area (AF3, AF4, Fz, F3, F4, F7, F8), the central (sensorimotor) area (FC1, FC2, FC5, FC6, Cz,
C3, C4, CP1, CP2, CP5, CP6), the occipital area (Pz, P3, P4, P7, P8, POz, PO7, PO8, O1, O2), and the temporal area (T7,
T8). Consistent intra-class similarity was commonly observed for each task.
22
tial advantage over the conventional methods in that our feature extraction and classification methods do not require complex procedures for selecting specific feature sets and training a classifier. Instead of selecting an optimal combi- nation of feature vectors, we converted abundant spatial and spectral information into 2D spatiospectral pattern matrices and classified the patterns by calculating the inner-product of pattern matrices.
Thanks to the simplicity of the proposed mental state clas- sification method, this method can be utilized in developing an efficient brain-computer interface (BCI) system. BCI is a cutting edge technology that may help the disabled control external devices and communicate with the outside world. To realize a practical BCI system, the user’s intentions need to be accurately classified in real-time. In this context, the com- putational cost required for the classification of human inten- tions is a critical consideration influencing the performance of the BCI system. Since the proposed classification method does not need the time consuming procedures of feature selection and classifier training, our mental state classifica- tion method would be a useful tool for realizing a more effi- cient on-line BCI system.
Although we did not find distinct inter-subject similarity in the spatiospectral patterns, well-known physiological findings were frequently observed in most of the participants’ pattern maps. The increment of gamma band brain activity is widely believed to be tightly linked with cognitive task execution [34], and this phenomenon was also replicated in the current study; a widespread increment of gamma band activities was observed in most of the participants’ spatiospectral pattern maps for most cognitive tasks. Moreover, the augmentation of theta band power along with gamma ERS was also observed in a large number of frontal and central recording sites for all subjects, excluding subject DS, while performing the numerical multiplication task (task B). This observation agreed with previous studies [34,42] that reported increased frontal and central theta powers while one was performing specific mental tasks requiring high levels of attention, such as mental arithmetic and reasoning. Additionally, most par- ticipants’ spatiospectral maps, excepting subject JI, demon- strated significant increases in alpha power (alpha ERS) around the sensorimotor area during the tongue motor imag- ery task (task D), agreeing with a previous study that reported dominant alpha ERS in the sensorimotor (central)
area during tongue motor imagery [38]. Since characterizing patterns of brain activity associated with specific mental states would be an important issue that may expand our understanding of how a specific mental task is encoded in the brain, we will further investigate this issue in future studies.
Some parameters used in the present study were selected empirically. First, the spectral powers were evaluated using FFT with a one second time window with a 50% overlap and were averaged across all time windows in each epoch. We varied the analysis window sizes and picked the optimal win- dow size (1,000 ms) from trials of 500, 750, 1,000, 1,500 and 2,000 ms. Second, the threshold values of ERD and ERS were set to represent the ‘mean of baseline powers ± one standard deviation of baseline powers’ for all partici- pants. We determined this threshold value empirically, but these values still need to be optimized in future studies with much more experimental datasets. In addition, inner-product was used to evaluate the similarity between two spatiospec- tral pattern maps, but the similarity evaluation using inner- product might not be an optimal method for statistical pattern recognition. We used inner-product as our preliminary anal- yses showed higher classification accuracy when the simi- larity was evaluated by calculating inner-product than when the similarity was evaluated by computing cross-correlation.
Nevertheless, we will try other pattern classification meth- ods in our future studies.