Journal of the Korean Society of Speech Sciences Vol.5 No.4 (2013.12.31) www.speechsciences.or.kr
ISSN 2005-8063, pp. 081~090 http://dx.doi.org/10.13064/KSSS.2013.5.4.081
L2 Proficiency Effect on the Acoustic Cue-Weighting Pattern by Korean L2 Learners of English:
Production and Perception of English Stops
Kong, Eun Jong
1)․Yoon, In Hee
2)ABSTRACT
This study explored how Korean L2 learners of English utilize multiple acoustic cues (VOT and F0) in perceiving and producing the English alveolar stop with a voicing contrast. Thirty-four 18-year-old high-school students participated in the study. Their English proficiency level was classified as either ‘high’ (HEP) or ‘low’ (LEP) according to high-school English level standardization. Thirty different synthesized syllables were presented in audio stimuli by combining a 6-step VOTs and a 5-step F0s. The listeners judged how close the audio stimulus was to /t/ or /d/ in L2 using a visual analogue scale. The L2 /d/ and /t/ productions collected from the 22 learners (12 HEP, 10 LEP) were acoustically analyzed by measuring VOT and F0 at the vowel onset. Results showed that LEP listeners attended to the F0 in the stimuli more sensitively than HEP listeners, suggesting that HEP listeners could inhibit less important acoustic dimensions better than LEP listeners in their L2 perception. The L2 production patterns also exhibited a group-difference between HEP and LEP in that HEP speakers utilized their VOT dimension (primary cue in L2) more effectively than LEP speakers. Taken together, the study showed that the relative cue-weighting strategies in L2 perception and production are closely related to the learner’s L2 proficiency level in that more proficient learners had a better control of inhibiting and enhancing the relevant acoustic parameters.
Keywords: perceptual cue-weighting, Voice Onset Time, fundamental frequency, L2 proficiency
1. Introduction
A single linguistic contrast of the speech sounds can be delivered in multiple dimensions of acoustic cues (e.g., Lisker, 1985). While one of the clear advantages of having multiple acoustic dimensions is that the redundant cues help the listeners
1) Korea Aerospace University, [email protected] 2) Sungkyunkwan University, [email protected],
corresponding author
- This work was supported by 2011 Korea Aerospace University faculty research grant. (2011-01-004).
- This work was supported by the National Research Foundation of Korea Grant funded by the Korean Government (NRF-2012S1A5A8022655).
Received: October 30, 2013 Revised: November 27, 2013 Accepted: December 11, 2013
to successfully perceive the phonetic contrast in speech signals, those acoustic cues do not play an equal role in signaling the speech categories to the listeners. Some cues serve as more critical auditory dimensions to the listeners in identifying the speech sound than other cues do. This is known as perceptual cue-weighting (Holt & Lotto, 2006; Francis, Kaganovich &
Discoll-Huber, 2008; Idemaru et al., 2012; Schultz, Francis &
Llanos, 2012).
Perceptual cue-weighting is language-specific. A closely relevant example comes from the cue-weightings between VOT and F0 in signaling the phonetic contrast of phonation types in stops in English and Korean. While both English and Korean utilize a set of multiple acoustic cues in characterizing a laryngeal contrast in stops (e.g., VOT and f0: Lisker &
Abramson, 1964; Whalen et al., 1993), the two languages differ
in what order the cues are prioritized. English native speakers
primarily use VOT to differentiate /d/ from /t/ (Abramson &
Lisker, 1985; Francis et al., 2008; Schultz et al., 2012). In utilizing the two cues in perception, Schultz, Francis & Llanos (2012) have shown that English listeners put more perceptual weight on VOT than F0 in categorizing /b/ vs. /p/. Kong and Edwards (2011) provided additional supporting evidence drawn from eye-movement patterns to show that F0 was a secondary cue to English listeners since they relied on F0 only when VOT was ambiguous in differentiating /d/ from /t/.
By contrast, F0 is the primary cue for Korean listeners to distinguish lax stops distinctively from the aspirated stops because both laryngeal types are associated with a long-lag VOT as a result of a recent sound change (Kim, Beddor &
Horrocks, 2002; Silva, 2006; Wright, 2007; Kang & Guion, 2008). Kim et al. (2002) showed that Korean listeners were able to identify the lax type of stops solely based on the acoustic property of a low F0 at the following vowel onset when only the vowel portion of the syllable was presented as stimuli.
Similarly, Kong, Beckman & Edwards (2011) showed that young adult listeners tended to rely more on F0 than VOT in differentiating the lax stop /t/ from the aspirated stop /t
h/ when attempting to categorize the stop consonants spoken by adults and children into one of the three stop phonation types.
Therefore, L2 learners must acquire not only the relevant sets of acoustic parameters but also learn the relative importance between cues to perceive and produce L2 phonetic categories in a native-like manner. Developmental studies of children’s L1 production and perception have shown that children start out attending to acoustic dimensions relevant to the phonetic categories, but they are not necessarily more sensitive to the primary cue than other cues in the ambient language (Walley &
Carrel, 1983; Nittrouer 1992; 2002; Nittrouer & Miller, 1997;
Hazan & Barret, 2000; Li, 2012). They gradually learn to prioritize which cue to pay more attention to in order to contrast the speech categories as the adult speakers of the ambient language do. Nittrouer (1992) has shown that in differentiating /s/ from /ʃ/, the spectral cue present in the frication portion of the fricative was perceptually weighted as a more important cue than the F2 cue at the following vocalic onset, which was opposite to the way English-adult listeners gave perceptual weights in distinguishing /s/ from /ʃ/. Robust evidence has also been provided in non-native speech perception literature to show that speech perception is language-specific (e.g., Li et al., 2010) and L2 native-like perception strategies emerge as the exposure to the target language increases (e.g.,
Yamada & Tohkura, 1992; Flege, Bohn & Jang, 1997; Cebrián, 2006). Flege et al. (1997) reported that the Korean L2 learners’
over-use of durational cue in producing English /i/-/ɪ/ were less common for the experienced learners than the inexperienced learners, suggesting that the L2 experience may have affected the Korean L2 learners in attending more to the spectral characteristics, native speakers’ primary cue, than to the duration characteristics of the tense-lax contrast in English.
Given that cue-weighting patterns are language-specifically determined, and therefore learned by linguistic experience, we wonder how Korean L2 learners of English utilize VOT and F0 in distinguishing the English sound /d/ from /t/. There have been previous studies pursuing the current research question with respect to Korean L1 learners’ productions of L2. Kim’s recent studies (Kim, 2011; 2012) showed that the role of F0 as a primary cue in L1 was transferred to L2 productions. The L2 productions of voiced and voiceless stops were separated along the F0 dimension fairly consistently across Korean L2 speakers (e.g., low F0 for voiced stops and high F0 for voiceless stops measured at the following vocalic onset), while the voiceless vs.
voiced stops were differentiated along the VOT dimension with a large amount of individual variations (e.g., a shorter VOT for high L2 proficiency speakers’ voiceless stops). She remarked that this tendency of L1 transfer to L2 productions could imply that a similar L1 transfer effect might exist in the L2 perception. Current research can provide experimental evidence regarding the question of whether the effect of L1 transfer would exist in the Korean L2 learner’s perception of L2 as well as in the L2 productions. More importantly, in the present study, we investigate whether the effects of L1 transfer to L2 processing strategies are conditioned to a particular acoustic dimension and whether the degree of transfer effects would differ between the high vs. low L2 proficiency groups.
2. Perception experiment
2.1 Methods 2.1.1 Participants
34 senior high school students were recruited from two
different institutions – one located in Seoul and the other in a
city called Bucheon (Gyeonggi Province) on the outskirts of
Seoul. The two high schools were specifically chosen so as to
be able to recruit subjects with clearly different levels of
English proficiency: High vs. Low. One of the schools was a
regular high school (“LEP”: Low English Proficiency group)
where we recruited 15 students (eight females and seven males) that scored between the 3
rdand 5
thlevels on the standardized English proficiency test for high-school students. None of them had an experience of living in English-speaking countries. The other school was a foreign language high school (“HEP”: High English Proficiency group) where 19 participating students (nine females and 10 males) had attained the 1
stlevel of English proficiency according to the same national standardized test.
They were rewarded with a gift for their participation.
2.1.2 Stimulus
The sound stimuli were synthesized based on the natural productions of /da/ and /ta/ by an English-speaking male from Wisconsin. VOT values were incremented in six logarithm steps from 9ms (the VOT of the original /da/ syllable) to 59ms by pasting the extractions of the release portion from the /ta/
production. The F0 dimension was also manipulated by imposing five-step F0 values (98Hz ~ 130Hz) over the vowel portion of the /da/ production. As a result, 30 different syllables were prepared by pairing the six VOT logarithm steps (9ms, 13ms, 19ms, 28ms, 40ms, 59ms) and five F0 linear steps (98Hz, 106ms, 114Hz, 122Hz, 130Hz).
2.1.3 Task
The visual analogue scaling (VAS) method was employed for the speech perception experiment (Massaro & Cohen, 1983;
Munson et al., 2010) The listeners were instructed to judge how close the sound played was to /d/ or to /t/ in English. The monitor displayed an arrow labeled as “d” and “t” at each of the two ends (“d” ←→ “t”). The listeners could click any locations on the arrow to indicate perceptual closeness to /d/ or to /t/ in terms of the distance from the labels. There were 90 trials per listener (30 different syllable stimuli × three repetitions).
2.1.4 Statistical analysis
The mixed effects regression models were constructed in R using the lme4 package (R Core Team, 2012; Bates, Maechler &
Bolker, 2012) to investigate how sensitively the listener’s judgments of /t/-likeness were made as to the varying acoustic parameters of VOT and F0, and whether these sensitivities to each acoustic dimension interacted with the listeners’ group membership of English proficiency (LEP vs. HEP). Specifically, the sensitivity to VOT (i.e., VOT effect) was estimated from the model by quantifying how much difference in terms of /t/-likeness judgment existed between the two extreme conditions of VOT (i.e., 59ms and 9ms). This approach was inspired by the
methods in Gordon et al. (1993) and Escudero & Boersma (2004). Similarly, the F0 effect on /t/-likeness judgment was assessed by calculating differences in the ratings between the two F0 conditions of the lowest F0 (98Hz) and the highest F0 (130Hz). In each regression model, the English proficiency (Low vs. High) was considered as an explanatory factor.
The dependent variable of the model was the log-transformed values of the x-coordinates of the click locations obtained from each trial. In the model used to assess the effect of VOT (VOT model), the fixed effects were the two discrete VOT conditions and the English proficiency levels (LEP vs. HEP). Similarly, the model to assess the effect of F0 (F0 model) had the two F0 conditions and the listener group as the fixed effects. Both model types had the individual subject as a random effect.
2.2 Results
2.2.1 Group and individual patterns
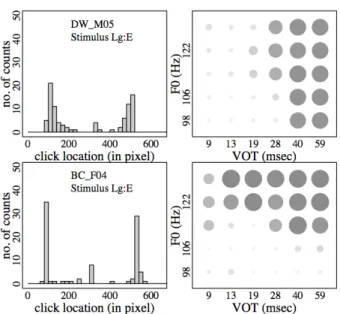
<Figure 1> shows the histograms of click distributions (left) and the dot representations of /t/-likeness degrees in each acoustic condition of 30 different pairs of VOT and F0 values (right) separated by LEP and HEP groups (top vs. bottom panels). In the dot-matrix plot, the sizes and the darkness of the dots become greater as the click locations were closer to the 't' label. When the response patterns of individual listeners were examined, there were differences to greater degrees in whether VOT or F0 dominantly affected the perception of the /t/-likeness. <Figure 1> displays two extreme examples of individual listeners' judgments of /t/-likeness as per each stimulus’ acoustic condition. In the top panel for the listener
“LEP_F04”, darker dots and lighter dots were distinguished mainly along the F0 dimension. By contrast, darker dots were better separated from lighter dots mainly along the VOT dimension in the bottom panel for the listener “HEP_M05”.
<Figure 2> shows the averaged response patterns separated
by listeners’ language proficiency groups. In the top panel, the
dots became larger and darker as F0 values increased, indicating
that the listeners with low English proficiency judged the
stimuli mainly based on the F0 cue of the stimulus. By
contrast, the size and the darkness of the dots in the bottom
panel changed more dramatically when the VOT values
changed, suggesting that the high English proficiency group
relied more on VOT in judging /t/-likeness of the stimuli.
Figure 1. Histograms of the click locations and dot-representations of /t/-likeness on the stimulus-matrix:
examples from two individual subjects
Figure 2. Histograms of the click locations and dot-representations of /t/-likeness on the stimulus-matrix separated by Low (top panels) vs. High (bottom panels)
English proficiency groups
The trends were repeated again in <Figure 3> in which the responses were averaged at each step of a single acoustic dimension pairing with the two edge conditions of the other acoustic dimension. The right panel shows the averaged response of the 6-step VOT conditions when the F0 was 98Hz (solid line) and 130Hz (dashed line). The left panel shows the averaged ratings of /t/-likeness of the 5-step F0 conditions when the VOT was 9ms (solid line) and 59ms (dashed line). In terms of the difference between the listener groups, the LEP group
had a greater difference between 98Hz and 130Hz (i.e., F0 effect) consistently across the 6-step VOT conditions than the HEP group did. The average /t/-likeness of the stimuli with the highest F0 value was higher in the LEP group than the HEP group, and that of the lowest F0 condition was lower in the LEP group than the HEP group. This suggests that the LEP listeners were more sensitive to the F0 dimension in judging English stop voicing contrast than HEP listeners were. In the right panel the averaged judgments of /t/-likeness did not greatly differ between the LEP and HEP groups across the five F0 steps, except that the rating difference between the two extreme VOT conditions (i.e., VOT effect) was greater for the HED group than the LED group when the F0 was 98Hz. We tested the statistical significance of these observations in the following section based on the method in Section 2.1.4.
Figure 3. Averaged logit /t/-likeness across VOT steps when F0 was 98Hz and 130Hz (left) and averaged logit /t/-likeness
across F0 steps when VOT was 9ms and 59ms (right)
2.2.2 Mixed effects regression models: /d/ vs. /t/ perception
<Tables 1 and 2> summarize the estimated parameters of the F0 model and those of the VOT model of mixed effects regression, respectively, where the listener group was considered as an interaction effect in each acoustic dimension. The F0 model showed that the added interaction term of language proficiency group and F0 condition (“F0Steps(130Hz):
Group(HEP)”) was significantly large: coefficient = -0.91, standard error = 0.29, p<0.005. The ANOVA of the model indicated a significant effect of the interaction term by returning a relatively large F-value (F= 9.8). This confirms the pattern depicted in <Figure 3> in which the overall rating differences of /t/-likeness between 98Hz vs. 130Hz F0 conditions (F0 effect) were greater in the LEP group than in the HEP group.
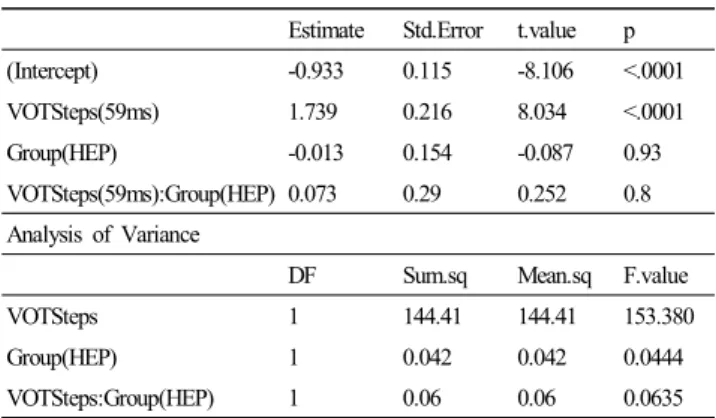
By contrast, the parameter estimation of the VOT model in
<Table 2> did not show statistical significance with respect to the interaction term (“VOTSteps(59ms):Group(HEP)”; coef. = 0.073, standard error = 0.29, p = 0.8), nor was there a significant main effect for the listener group (“Group(HEP)”;
coef. = -0.013, standard error = 0.154, p=0.93). The VOT model, on the other hand, had a significant effect in terms of VOT conditions (“VOTSteps(59ms)”; coef = 1.73, standard error
= 0.216, p <0.001). This model output suggests that the significant amount of VOT effect on the /t/-likeness ratings was present in both English proficiency listener groups of English proficiency to a similar degree.
Estimate Std. Error z value Pr(>|z|)
(Intercept) -1.29 0.12 -11.31 < .0001
F0Steps(130Hz) 2.28 0.22 10.43 < .0001
Group(HEP) 0.45 0.15 2.96 0.003
F0Steps(130Hz):Group(HEP) -0.91 0.29 -3.13 0.0017 Analysis of Variance
DF Sum.sq Mean.sq F.value
F0Steps 1 128.41 128.41 148.62
Group(HEP) 1 0.162 0.162 0.1878
F0Steps:Group(HEP) 1 8.47 8.47 9.8037
Table 1. Parameter estimations and ANOVA summary of the F0 model
Estimate Std.Error t.value p
(Intercept) -0.933 0.115 -8.106 <.0001
VOTSteps(59ms) 1.739 0.216 8.034 <.0001
Group(HEP) -0.013 0.154 -0.087 0.93
VOTSteps(59ms):Group(HEP) 0.073 0.29 0.252 0.8 Analysis of Variance
DF Sum.sq Mean.sq F.value
VOTSteps 1 144.41 144.41 153.380
Group(HEP) 1 0.042 0.042 0.0444
VOTSteps:Group(HEP) 1 0.06 0.06 0.0635
Table 2. Parameter estimations and ANOVA summary of the VOT model
2.3 Discussion
The goal of the perception task was to investigate how L2 Korean listeners utilized the two varying acoustic cues in rating L2 English /t/ and /d/, and whether the perceptual cue-weighting patterns would differ by L2 proficiency. The results showed that there were individual differences in the perceptual cue-weighting patterns among L2 learners. Some listeners based their perceptual ratings mainly on VOT, and others mainly on F0.
Still others judged the sounds in the manner that the two cues were traded. This individual difference was, at least, related to the listener’s L2 proficiency in a way that the lower L2 proficiency listeners tended to be sensitive to F0, the primary cue in their L1, more than the higher L2 proficiency listeners did. By contrast, the two L2 proficiency groups did not show a statistically significant difference in utilizing the VOT cue in perceiving the stop voicing contrast in the L2 stops.
The current findings support Kim (2012)’s prediction that the Korean L2 learners, in general, would consistently differentiate voiced stops from voiceless stops in English in the F0 dimension, the primary acoustic dimension that Korean native speakers utilize most importantly in their L1 perception. The current L2 perception study provides experimental evidence that it was the primary acoustic dimension of L1 (i.e., F0 in Korean) that was a transferable and more variable dimension in L2 perception.
The results further suggest that L2 proficiency can explain, in part, to what degree (and in which direction) the variations of the L1 transfer effect in the F0 dimension would exist among the learners. More proficient L2 learners were able to inhibit the relatively unimportant acoustic cue in L2 (i.e., F0) in perceiving L2 sound categories. This conforms to the general understanding of the cognitive advantages that bilinguals seem to possess; in general bilinguals excel in inhibitory control (and other cognitive skills) over monolinguals since they constantly suppress one language when that language is not in use (e.g., Emmorey, Luk, Pyers & Bialystok, 2008; Coasta, Hernandex, Costa-Faidella & Sebastian-Galles, 2009).
3. Production experiment
3.1 Methods
3.1.1 Participants, materials and tasks
The same participants in the perception experiment were
recorded during their visit. Recordings of a randomly selected
subset of the speakers (M=5, F= 5 for LEP; M=7, F=7 for
HEP) were acoustically analyzed for the current paper. They
read a list of English words printed on a paper in their natural
speech rate (see <Table 3> for a word list). Target consonants
were word initial stops /d/ vs. /t/ in English followed by
various vowel contexts. Each test word was elicited once. The
recordings were made using a digital recorder (Marantz
PMD661) with a hand-held mic (Shure SM81) with a 44,100
Hz sampling rate and 16bit quantization.
English
vowel /d/ /t/
/i, ɪ/ digging, ditch, deer tickle, teacher, teepee /e, ɛ/ danger, deck, desert tent, taste, tail /ɑ, ɔ, ʌ/ dove, dolphin, donkey taco, tongue, tall /u, ʊ/ duke, dull, dude tomb, tuna, tooth /o/ donout, domes, door toad, torn, toast
Table 3. Lists of words: English
3.1.2 Acoustic Analysis
The target stops were acoustically examined by measuring VOT and F0 at the following vowel onset. VOT values were calculated by subtracting the timestamps of the acoustic burst signal (indicated by a spike of energy preceded by a closure) from the voice onset timestamps (indicated by evidence of a voicing bar in the spectrogram). F0s were measured by taking an inverse of the time interval between two adjacent glottal pulses at 20ms into the following vowel. The linear Hz values of the F0 were transformed into semitone so that the anatomical difference between male and female speakers was neutralized in the further analysis (e.g., Shultz et al., 2012).
3.1.3 Statistical Analysis
Mixed-effects logistic regression models were made to test the extent to which each acoustic dimension (i.e., VOT and F0 transformed into semitone) contributed to differentiating the sounds with a voicing contrast, and whether the two language proficiency groups (LEP vs. HEP) would pattern differently in using the acoustic dimensions for a contrast in their productions.
To estimate the relative contributions of VOT and F0, we made two separate regression models for the English productions of the LEP and HEP groups. In the model, the dependent variable was the consonant target categories (/d/ vs. /t/ in English) and the fixed effects were normalized values of VOT and semitone, where we only included positive (lag) VOT tokens. The slopes and the intercepts of the two acoustic variables also varied at the level of individual speaker.
The interaction effects of VOT or semitone with the speaker groups were examined by performing deviance tests. The deviance test compares a simpler model (with fewer test variables) with a more complex model (with more test variables) to assess whether the added variables affect the performance of the complex model significantly by calculating how far the actual observations deviate from the model fits. In our case, if the deviance test indicates that the complex model
with an added interaction term (i.e., speaker group × VOT, or speaker group × semitone) would explain the distributions of /d/
and /t/ better than the simpler model without the interaction term, then this would suggest that L2 proficiency is a significant interaction factor with VOT or semitone dimensions, signaling that there is a group difference in terms of utilizing VOT or semitone in the L2 productions of /t/ and /d/.
3.2 Results
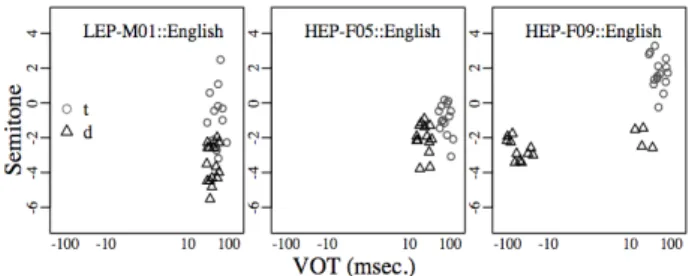
Individual speaker patterns of F0 by VOT were explored first. Three noteworthy examples are presented in <Figure 4>.
Speaker “LEP-M01” in the leftmost panel of <Figure 4>
produced his English /d/ sounds close to /t/ sounds in the VOT dimension, whereas the two sounds were clearly differentiated from each other in the F0 dimension; /d/ had lower semitone values in his productions. By contrast, speaker “HEP-F05” in the center panel showed distributions in which her /d/ tokens were separated from /t/ tokens in the VOT dimension. The semitone values of /d/ and /t/ overlapped. Finally, speaker
“HEP-F09” in the rightmost panel differentiated her /d/
productions from /t/ productions in both acoustic dimensions, producing her /d/ sounds with lead VOT values as well as short lag VOT values.
Figure 4. Scatter-plots of F0 (in semitone) as a function of VOT (in msec.) by three individual speakers
<Figure 5> plots the distributions of /d/ and /t/ productions in the F0 dimension against the VOT dimension, separated by the English L2 proficiency groups (HEP in the top row vs. LEP in the bottom row). The left column of <Figure 5> illustrates that the HEP group could realize their English stops /d/ either with lead VOT values or with short lag VOT values. By contrast, lead VOT tokens were rarely observed in the /d/
productions of the LEP group. When the display window was
narrowed to look closely into only the tokens with positive (lag)
VOT values in the right column, it showed that the two speaker
groups had a subtle difference in their productions in terms of
how close the /d/ targets with the short lag VOTs were to the /t/ targets. The LEP group at the bottom right panel had slightly more overlaps of /d/ and /t/ along the VOT dimension than the HEP group: the /d/ targets of the HEP group had shorter VOT values and the /t/ targets had longer VOT values compared to those by the LEP group (see <Table 4> for a summary of each acoustic parameter).
Figure 5. Scatter-plots of semitone as a function of VOT (in ms.) separated by listener groups’ English proficiency
(HEP at the top vs. LEP at the bottom)
VOT(ms) Semitone
LEP HEP LEP HEP
/d/ 25(±13) 21(±10) -1.65(±3.40) -2.51(±1.95) /t/ 50(±18) 65(±22) 1.79(±2.52) 0.27(±1.99) Table 4. Means (standard deviations) of VOT and semitone:
English /d/ and /t/
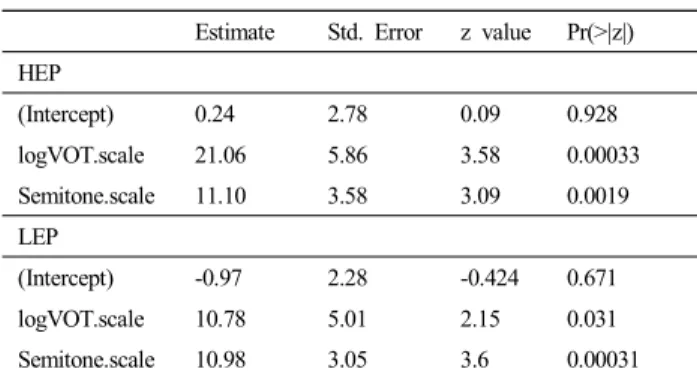
The logistic regression model fits are presented in <Figure 6> based on the fixed effect coefficients of VOT and semitone from the English production model. The solid curves represent how rapidly the probability of voiceless stop /t/ in the HEP speakers’ productions changed as VOT (black lines) and F0 (grey lines) increased. The positive direction of the slopes indicates that the probability of /t/ increased as both VOT and semitone increased. The productions by the LEP speakers (dashed lines) showed similar curve patterns to the HEP group in terms of the direction and the steepness of the curves. The parameter estimations of the regression models (<Table 5>: HEP and LEP separately) showed that the coefficients of VOT and semitone were significant for both speaker groups, indicating that the productions of /t/ and /d/ were differentiated by VOT as well as semitone. The deviance tests further showed that the
VOT interaction term with the speaker group was significant (χ
2= 8.09, DF = 1, p <0.005), but the semitone interaction term with the speaker group was not significant (χ
2=1.56, DF=1, p=
0.21). Together with a lower coefficient of VOT in the LEP group (10.78) than that of the HEP group (21.06), this significant effect of interaction suggests that the contribution of VOT was smaller in the LEP speakers’ productions than in the HEP speakers’ productions, although the LEP speakers utilized the VOT dimension as well as the semitone dimension to distinguish their /t/ targets from /d/ targets.
Figure 6. Estimated probability of /t/ from the logistic regression model for English stop productions
Estimate Std. Error z value Pr(>|z|) HEP
(Intercept) 0.24 2.78 0.09 0.928
logVOT.scale 21.06 5.86 3.58 0.00033
Semitone.scale 11.10 3.58 3.09 0.0019
LEP
(Intercept) -0.97 2.28 -0.424 0.671
logVOT.scale 10.78 5.01 2.15 0.031
Semitone.scale 10.98 3.05 3.6 0.00031