ORIGINAL ARTICLE
*Equal contribution
Received: December 7, 2020, Revised: January 16, 2021, Accepted: January 20, 2021
Corresponding author: Cunchuan Wang, 613 Huangpu Avenue West, Guangzhou 510630, China Department of Bariatric Surgery, The First Affiliated Hospital of Jinan University Tel: +86-20-38688608, Fax: +86-20-38688608, E-mail: [email protected] Corresponding author: Zhiyong Dong, 613 Huangpu Avenue West, Guangzhou 510630, China
Department of Bariatric Surgery, The First Affiliated Hospital of Jinan University Tel: +86-20-38688608, Fax: +86-20-38688608, E-mail: [email protected]
CC This is an open access article distributed under the terms of the Creative Commons Attribution Non-Commercial License (http://creativecommons.org/licenses/by-nc/4.0) which permits unrestricted non-commercial use, distribution, and reproduction in any medium, provided the original work is properly cited.
The Prevalence and Predictors of Obstructive Sleep Apnea in Chinese Bariatric Surgery Candidates: A Single-Center Study
Departments of
1Bariatric Surgery,
2Respiratory and Sleep, The First Affiliated Hospital of Jinan University, Guangzhou, China,
3Department of Bariatric Surgery, The Whittington Hospital NHS Trust, London, United Kingdom
Wenhui Chen
1,*, Xiaotao Zhang
2,*, Chetan Parmar
3, Yucheng Wang
1, Wah Yang
1, Jiyang Pan
2, Zhiyong Dong
1, Cunchuan Wang
1Purpose: The purpose of the study is to determine the prevalence and predictors of OSA in Chinese bariatric surgery candidates. Materials and Methods: The clinical data were collected from 326 patients evaluated for bariatric surgery and referred for polysomnography. Multiple logistic regression was used for identifying independent predictors of presence of OSA and ROC curve analysis to determine the best cut-off value for continuous variable. Results: Baseline BMI and age were 33.3±3.7 kg/m
2and 24.3±3.1 years. 62.9% of the patients fulfilled the diagnostic criteria for OSA; Of these, 22.7%
had mild OSA; 11.3% had moderate OSA, and 28.8% had severe OSA. The prevalence was significantly higher in males (84.2%) than in females (47.3%) (P<0.001). The superobese patients and the obese patients aged older than 50 years that all of those were diagnosed with OSA. A multivariate logistic regression model displayed that increasing age, BMI and neck circumference together with presence of habitual snoring and male sex were identified as risk factors of OSA.
The best cut-off values for the presence of OSA for age, BMI, neck circumference were 24.5 years, 39.45 kg/m
2, 40.40 cm. Conclusion: The prevalence of OSA is very prevalent (62.9%) in Chinese bariatric surgery candidates, especially in male patients (84%). Age, BMI and neck circumference together with presence of habitual snoring and male sex are independent predictors of OSA in these patients. As clinical predictors are not enough to be a properly screening for OSA, routine PSG testing should be recommended to bariatric surgery candidates.
Key Words: Obstructive sleep apnea, Bariatric surgery, Obesity
INTRODUCTION
Obstructive sleep apnea (OSA) is a very common and chronic sleep-related disorder that is characterized by repeated episodes of partial or complete upper airway obstruction during sleeping [1-3]. Repeated episodes of
obstructed breathing results in repetitive hypoxemia and
intermittent pauses in breathing causing oxygen desaturation,
sleep fragmentation, morning headaches and excessive
daytime sleepiness and some patients with OSA may be
asymptomatic [4,5]. Long-term complications of OSA
include pulmonary hypertension, cardiovascular disease,
stroke, diabetes, dyslipidemia and sudden-death during sleep [6-8]. OSA prevalence ranged from 9% to 38% in the general adult population, from 13% to 33% in men and from 6% to 19% in women [9]. Although some questionnaires are available for detecting patients at high risk for OSA such as the Fatigue Severity Scale (FSS) and Epworth Sleepiness Scale (ESS), but nocturnal polysomno- graphy (PSG) is considered as gold standard for the diagnosis of OSA [10,11]. Recently, STOP-Bang (snoring, tiredness, observed apnea, high BP-BMI, age, neck circumference and gender) questionnaires are widely used, because it was a concise, effective, and reliable OSA screening tool [12], but it can’t replace PSG.
There are multifactorial etiologies for OSA, including age, male sex, smoking and alcohol intake, but obesity is recognized as a major risk factor of OSA [13,14]. Some studies have shown that 1% of increasing in BMI, the incidence of OSA increases by 1.14% [15]. Underlying mechanisms of OSA in obese people include airway narrowing caused by fat deposition in the neck and airway obstruction due to relax of tongue soft tissue and throat muscles during sleep [16,17]. Some researchers showed approximately 70% of patients with diagnosed OSA were obese [7]. The prevalence of OSA in bariatric surgery candidates ranged from 60.0% to 91.0% [18,19]. However, about 80–90% of OSA cases remain undiagnosed [20].
Patients with OSA have a greater anesthetic risk, more perioperative complications including developing cardiovascular disease and respiratory depressant, which can increase the costs of postoperative care and the length of hospital stay [21,22]. Therefore, many researches tried to develop predictive models to predict the risk of OSA [18,23,24]. However, most of previous studies were focused on OSA patients with obesity in Western countries. In fact, OSA mechanisms may vary across racial groups [25]. Asians commonly have a greater mandibular plane (MP)–hyoid distance, a longer anterior lower facial height, and retrognathia and micrognathia, which are known risk factors for OSA [26]. Therefore, the aim of the study was to determine the prevalence and predictors of OSA in Chinese bariatric surgery candidates.
MATERIALS AND METHODS
Consecutive patients who planned to undergo bariatric surgery were retrospectively collected in the Bariatric Surgery Department of the First Affiliated Hospital of Jinan University between September 2015 and March 2019. Inclusion criteria were patients aged 18 to 65 years with BMI ≥35 kg/m
2or BMI ≥27.5 kg/m
2with inadequately controlled T2DM or metabolic syndrome;
The patients who evaluated for bariatric surgery agreed to be screened preoperatively for OSA by polysomnography (PSG). The exclusion criteria were alcohol or drug abuse, severe eating disorder, depression or other severe disease contraindicating bariatric surgery. Written informed consent was obtained from all participants, and this study was approved by the ethics committee of the First Affiliated Hospital of Jinan University.
Data collection included gender, age, weight, neck circumference (measured at the level of the laryngeal prominence), waist circumference (measured midway between the lower rib and the iliac crest), hip circumference (measured the horizontal circumference of the most prominent part of the hips backwards), Waist-to-hip ratio, habitual snoring (defined as a snoring frequency 4≥
days per week) [27], hypertension, diabetes, dyslipidemia.
To explore the associations between the prevalence of different severity of OSA and patients’ demographic data, the patients were divided into several subgroups as follows:
ㆍGender: men and women
ㆍ Age: 18 to <30 years, 30 to <40 years, 40 to <50 years, 50 to <65 years
ㆍ BMI: 27.5 to <34.9 kg/m
2, 35 to <39.9 kg/m
2, 40 to
<49.9 kg/m
2, and >50 kg/m
21. Polysomnography
Sleep recordings were performed using a computerized PSG device (Compumedics E-series, Australia). The device was used to document the following parameters:
oronasal airflow (using dual pressure and thermal
sensors), respiratory effort (abdomen and thorax),
electrocardiogram, electrooculogram, electroencephalogram,
snoring using a tracheal microphone, body position and
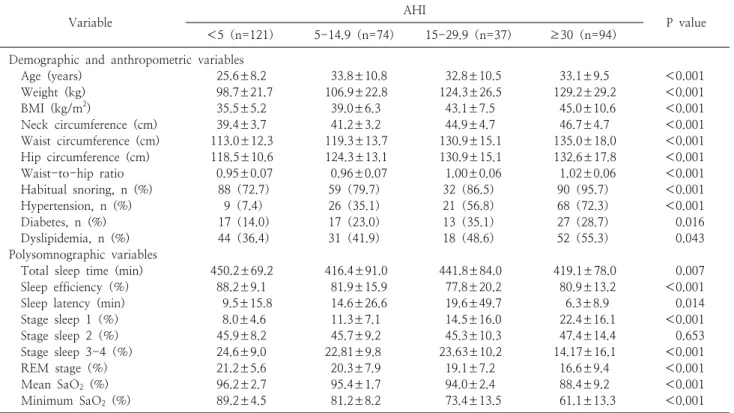
Table 1. Participant demographic, anthropometric and polysomnographic variables stratified by obstructive sleep apnea status
Variable AHI
P value
<5(n=121) 5-14.9(n=74) 15-29.9(n=37) ≥30(n=94)
Demographic and anthropometric variables
Age (years) 25.6±8.2 33.8±10.8 32.8±10.5 33.1±9.5 <0.001
Weight (kg) 98.7±21.7 106.9±22.8 124.3±26.5 129.2±29.2 <0.001
BMI (kg/m
2) 35.5±5.2 39.0±6.3 43.1±7.5 45.0±10.6 <0.001
Neck circumference (cm) 39.4±3.7 41.2±3.2 44.9±4.7 46.7±4.7 <0.001
Waist circumference (cm) 113.0±12.3 119.3±13.7 130.9±15.1 135.0±18.0 <0.001
Hip circumference (cm) 118.5±10.6 124.3±13.1 130.9±15.1 132.6±17.8 <0.001
Waist-to-hip ratio 0.95±0.07 0.96±0.07 1.00±0.06 1.02±0.06 <0.001
Habitual snoring, n (%) 88(72.7) 59(79.7) 32(86.5) 90(95.7) <0.001
Hypertension, n (%) 9(7.4) 26(35.1) 21(56.8) 68(72.3) <0.001
Diabetes, n (%) 17(14.0) 17(23.0) 13(35.1) 27(28.7) 0.016
Dyslipidemia, n (%) 44(36.4) 31(41.9) 18(48.6) 52(55.3) 0.043
Polysomnographic variables
Total sleep time (min) 450.2±69.2 416.4±91.0 441.8±84.0 419.1±78.0 0.007
Sleep efficiency(%) 88.2±9.1 81.9±15.9 77.8±20.2 80.9±13.2 <0.001
Sleep latency (min) 9.5±15.8 14.6±26.6 19.6±49.7 6.3±8.9 0.014
Stage sleep 1(%) 8.0±4.6 11.3±7.1 14.5±16.0 22.4±16.1 <0.001
Stage sleep 2(%) 45.9±8.2 45.7±9.2 45.3±10.3 47.4±14.4 0.653
Stage sleep 3-4(%) 24.6±9.0 22.81±9.8 23.63±10.2 14.17±16.1 <0.001
REM stage(%) 21.2±5.6 20.3±7.9 19.1±7.2 16.6±9.4 <0.001
Mean SaO
2(%) 96.2±2.7 95.4±1.7 94.0±2.4 88.4±9.2 <0.001
Minimum SaO
2(%) 89.2±4.5 81.2±8.2 73.4±13.5 61.1±13.3 <0.001
Data presented as mean±standard deviation, numbers, with percentages in parentheses; P values refer to results of ANOVA using Tukey’s HSD post hoc tests or chi-square test.
AHI = apnea-hypopnea index, BMI = body mass index, REM = rapid eye movement, SaO
2= oxygen saturation.
oxygen saturation (using Nonin finger probe). Apnea was defined as a complete cessation of oronasal airflow for at least 10 seconds. Hypopneas was defined by either a ≥ 30% decrease in oronasal airflow from baseline lasting at least 10 seconds associated with a 4% oxygen desaturation or a decrease in flow by ≥50% of baseline for at least 10 s associated with either a 3% oxygen desaturation, accompanied by thoracoabdominal movement. Apnea- hypopnea index (AHI) was defined as a number of apnea and hypopnea events per hour (AHI less than 5 events/h was considered normal, AHI 5–15 events/h was considered as mild OSA, AHI 15–30 events/h as moderate OSA and AHI more than 30 events/h as severe OSA) [28]. An experienced sleep specialist scored manually and interpreted polysomnographic recordings in accordance with established guidelines [29].
2. Statistical analysis
Statistical analysis was performed using the Statistical
Product and Service Solutions version 13.0 (SPSS 13.0,
SPSS Inc. Chicago, IL, USA). Continuous data were
presented as mean±standard deviation and categorical
data were expressed as percentage (%). We used analysis
of one-way ANOVA analyses to compare means and
distributions of participants without OSA and those with
mild and moderate as well as severe disease. The
prevalence of OSA and OSA severity was subdivided for
obesity, BMI and age subgroups. Subgroups were
compared by using chi-square test or Fisher’s exact test
for prevalence of OSA. Variables correlated with the AHI
evaluated by Pearson’s correlation or Spearman’s rank
correlation. Multiple logistic regression analysis for OSA
was employed with demographic and anthropometric
characteristics. The relevant continuous variables were
included in the ROC analysis. The area under the curve
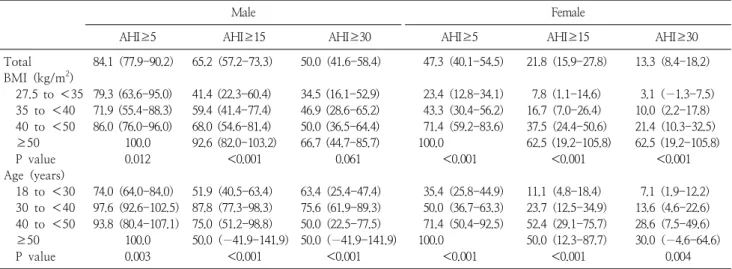
Table 2. BMI-specific and age-specific prevalence of obstructive sleep apnea using various cutoff points for AHI in different gender
Male Female
AHI≥5 AHI≥15 AHI≥30 AHI≥5 AHI≥15 AHI≥30
Total 84.1(77.9-90.2) 65.2(57.2-73.3) 50.0(41.6-58.4) 47.3(40.1-54.5) 21.8(15.9-27.8) 13.3(8.4-18.2)
BMI (kg/m
2)
27.5 to <35 79.3 (63.6-95.0) 41.4 (22.3-60.4) 34.5 (16.1-52.9) 23.4(12.8-34.1) 7.8(1.1-14.6) 3.1(−1.3-7.5)
35 to <40 71.9 (55.4-88.3) 59.4 (41.4-77.4) 46.9 (28.6-65.2) 43.3(30.4-56.2) 16.7(7.0-26.4) 10.0(2.2-17.8)
40 to <50 86.0 (76.0-96.0) 68.0 (54.6-81.4) 50.0 (36.5-64.4) 71.4(59.2-83.6) 37.5(24.4-50.6) 21.4(10.3-32.5)
≥50 100.0 92.6 (82.0-103.2) 66.7 (44.7-85.7) 100.0 62.5 (19.2-105.8) 62.5 (19.2-105.8)
P value 0.012 <0.001 0.061 <0.001 <0.001 <0.001
Age (years)
18 to <30 74.0(64.0-84.0) 51.9(40.5-63.4) 63.4(25.4-47.4) 35.4(25.8-44.9) 11.1(4.8-18.4) 7.1(1.9-12.2)
30 to <40 97.6(92.6-102.5) 87.8(77.3-98.3) 75.6(61.9-89.3) 50.0(36.7-63.3) 23.7(12.5-34.9) 13.6(4.6-22.6)
40 to <50 93.8(80.4-107.1) 75.0(51.2-98.8) 50.0(22.5-77.5) 71.4(50.4-92.5) 52.4(29.1-75.7) 28.6(7.5-49.6)
≥50 100.0 50.0(−41.9-141.9) 50.0(−41.9-141.9) 100.0 50.0(12.3-87.7) 30.0(−4.6-64.6)
P value 0.003 <0.001 <0.001 <0.001 <0.001 0.004
Data presented prevalence (95% confidence interval). Statistical analysis by chi-square test for differences in OSA prevalence.
BMI = body mass index, AHI = apnea–hypopnea index.
(AUC) and 95% confidence intervals were calculated for continuous predictor variable. The cut-off values for each significant predictor was determined, selecting the score that most closely balanced the sensitivity and specificity. P value of less than 0.05 was considered statistically significance.
RESULTS
1. Demographic, anthropometric and polysomnographic characteristics
Of those 339 patients, 13 were subsequently excluded:
because of missing or incomplete data, recording failed, recording time less than 300 min. Therefore, a total of 326 patients were recruited into further study, 188 (58%) women and 138 (42%) men. Baseline BMI and age were 33.3±3.7 kg/m
2and 24.3±3.1 years. Demographic, anthropometric and polysomnographic characteristics of 326 subjects are listed in Table 1 stratified by OSA status (AHI <5, 5–14.9, 15–29.9, and ≥30). As AHI increased, there were statistically significant increases in demographic and anthropometric characteristics as well as in the proportions of subjects with hypertension, diabetes, dyslipidemia. That means that those with OSA were also more likely to be older and larger for all anthropometric
characteristics. There are significant meanings between polysomnographic variables in different groups, except for stage sleep 2. SpO
2values worsened in parallel with increases in AHI (P<0.001 for mean and lowest SpO
2).
2. Prevalence of OSA
Based on the PSG results, 205 (62.9%) patients fulfilled the diagnostic criteria for OSA, specifically 74 (22.7%) with mild OSA, 37 (11.3%) with moderate OSA and 94 (28.8%) with severe OSA. In male patients, the prevalence was 84.1%, compared to 47.3% in female subjects (χ
2= 54.43, P<0.001). The prevalence of OSA (AHI ≥5) was 84.1% and 47.3% in male and female, respectively. The prevalence of OSA, by using the cut-offs of ≥15 and ≥30 was 65.2% and 50.0% in male, and 21.8% and 13.3% in female, respectively. The increase in the male/female ratio with increasing AHI cut-off value. When the cut-off was
≥5, the male/female ratio was 1.78; at ≥15, it was 2.99, and at ≥30, it was 3.76.
The prevalence and severity of OSA by BMI and age are
shown in Table 2 and Fig. 1. In BMI groups, as BMI
increased, the prevalence of OSA also increased progressively
at any cut-off of AHI. All but one is a significant
difference in the prevalence of OSA according to BMI at
different cut-off value, the exception being AHI ≥30/h in
male. All of super-obese patients with a BMI ≥50 kg/m
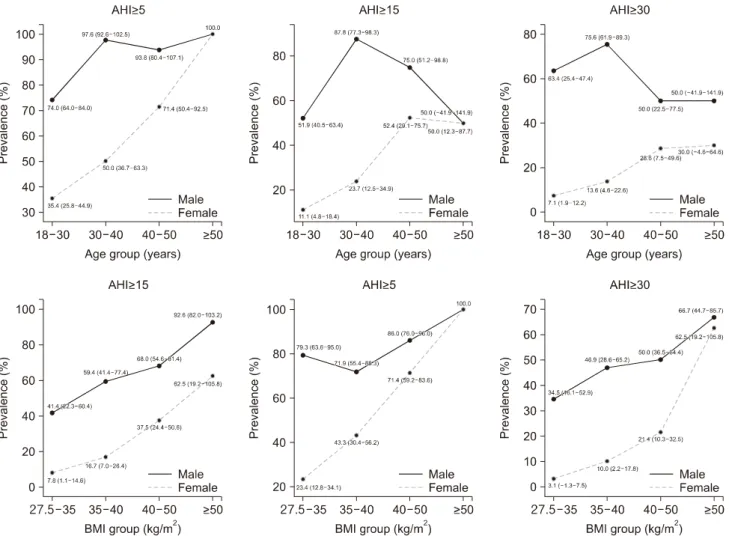
2Fig. 1. Distribution of the OSA prevalence by sex, age, BMI.
were diagnosed with OSA. Furthermore, the prevalence of OSA of male subjects was higher than that of female subjects at every cut-off value of AHI.
In age groups, both male subjects and female subjects are a significant difference in the prevalence of OSA according to age at different cut-off value. Men aged 30 to 40 years in both AHI ≥5 and AHI ≥15 has the highest prevalence of OSA than any other age group. Among women, the prevalence of OSA in women increased with age at cut-off of AHI ≥5 and ≥15. For the obese patients aged older than 50 years, all of those were diagnosed with OSA.
3. Predictors of the risk factors of OSA
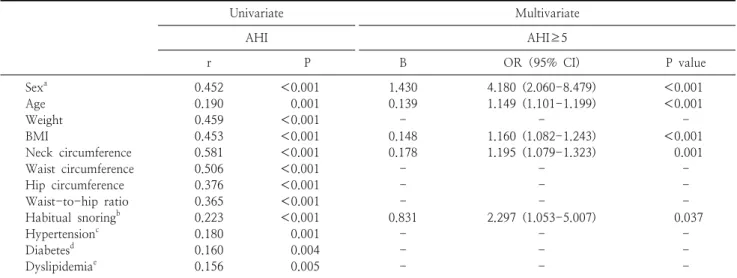
All variables were correlated with AHI as shown in Table 3. On the basic results, the following variables were
included in the multiple logistic regression analysis based on their significant correlation with the AHI: gender, age, weight, neck circumference, waist circumference, hip circumference, waist-to-hip ratio, habitual snoring, hypertension, diabetes, dyslipidemia. Multiple logistic regression analysis confirmed that male sex, a higher BMI, a larger neck circumference, the presence of habitual snoring as predictors of OSA (Table 3).
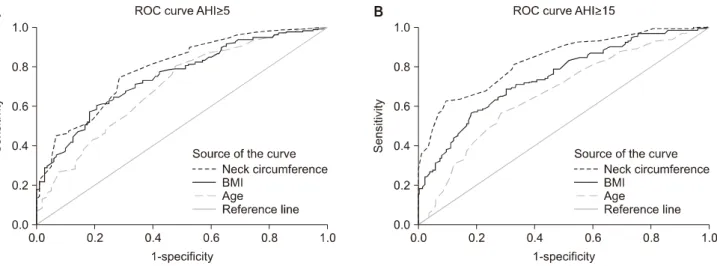
The ROC curve was analyzed the relevant continuous
variables according to results of multiple logistic regression
at cut-off of AHI ≥5 and ≥15 in Table 4. The cut-off
values for each variable were determined to best balance
between the sensitivity and specificity. In the prediction of
an AHI of ≥5 , the optimal cut-off value for the presence
of OSA for age, BMI, neck circumference were 24.5 years,
39.45 kg/m
2, 40.40 cm, separately. In another model for
Table 3. Predictors of obstructive sleep apnea based on univariate and multivariate logistic regression models
Univariate Multivariate
AHI AHI≥5
r P B OR(95% CI) P value
Sex
a0.452 <0.001 1.430 4.180 (2.060-8.479) <0.001
Age 0.190 0.001 0.139 1.149 (1.101-1.199) <0.001
Weight 0.459 <0.001 - - -
BMI 0.453 <0.001 0.148 1.160 (1.082-1.243) <0.001
Neck circumference 0.581 <0.001 0.178 1.195 (1.079-1.323) 0.001
Waist circumference 0.506 <0.001 - - -
Hip circumference 0.376 <0.001 - - -
Waist-to-hip ratio 0.365 <0.001 - - -
Habitual snoring
b0.223 <0.001 0.831 2.297 (1.053-5.007) 0.037
Hypertension
c0.180 0.001 - - -
Diabetes
d0.160 0.004 - - -
Dyslipidemia
e0.156 0.005 - - -
a